

Abstract
BACKGROUND
Diffuse large B-cell lymphomas (DLBCLs) are phenotypically and genetically heterogeneous. Gene-expression profiling has identified subgroups of DLBCL (activated B-cell–like [ABC], germinal-center B-cell–like [GCB], and unclassified) according to cell of origin that are associated with a differential response to chemotherapy and targeted agents. We sought to extend these findings by identifying genetic subtypes of DLBCL based on shared genomic abnormalities and to uncover therapeutic vulnerabilities based on tumor genetics.
METHODS
We studied 574 DLBCL biopsy samples using exome and transcriptome sequencing, array-based DNA copy-number analysis, and targeted amplicon resequencing of 372 genes to identify genes with recurrent aberrations. We developed and implemented an algorithm to discover genetic subtypes based on the co-occurrence of genetic alterations.
RESULTS
We identified four prominent genetic subtypes in DLBCL, termed MCD (based on the co-occurrence of MYD88L265P and CD79B mutations), BN2 (based on BCL6 fusions and NOTCH2 mutations), N1 (based on NOTCH1 mutations), and EZB (based on EZH2 mutations and BCL2 translocations). Genetic aberrations in multiple genes distinguished each genetic subtype from other DLBCLs. These subtypes differed phenotypically, as judged by differences in gene-expression signatures and responses to immunochemotherapy, with favorable survival in the BN2 and EZB subtypes and inferior outcomes in the MCD and N1 subtypes. Analysis of genetic pathways suggested that MCD and BN2 DLBCLs rely on “chronic active” B-cell receptor signaling that is amenable to therapeutic inhibition.
CONCLUSIONS
We uncovered genetic subtypes of DLBCL with distinct genotypic, epigenetic, and clinical characteristics, providing a potential nosology for precision-medicine strategies in DLBCL. (Funded by the Intramural Research Program of the National Institutes of Health and others.)
GENE-EXPRESSION PROFILING DEFINED the activated B-cell–like (ABC) and germinal-center B-cell–like (GCB) subgroups of diffuse large B-cell lymphoma (DLBCL), leaving approximately 10 to 20% of cases “unclassified.”1,2 This phenotypic distinction is associated with overall survival after standard therapy with rituximab, cyclophosphamide, doxorubicin, vincristine, and prednisone (R-CHOP) chemotherapy3 and predicts response of relapsed or refractory DLBCL to ibrutinib, an inhibitor of B-cell receptor–dependent nuclear factor κB (NF-κB) activation.4 Responses to ibrutinib were especially frequent in ABC tumors that have both a mutation in CD79B, encoding a B-cell receptor subunit, and the MYD88L265P mutation — a finding that suggests that tumor genotype could influence response.
Genomic sequencing studies in DLBCL have focused on recurrent mutations in individual genes, revealing oncogenic mechanisms (reviewed by Shaffer et al.5). Functional genomic screening has provided a complementary view of regulatory pathways that are essential for the proliferation and survival of DLBCL cells.6–8 Here, we undertook a multiplatform analysis of structural genomic abnormalities and gene expression in DLBCL biopsy samples. We hypothesized that this hybrid approach might yield a nosology of DLBCL based on shared genetic pathogenesis that could aid in our understanding of treatment response and identify therapeutic vulnerabilities.
METHODS
PROCEDURES
Fresh-frozen DLBCL biopsy samples were analyzed by means of exome and transcriptome sequencing, deep amplicon resequencing of 372 genes, and DNA copy-number analysis (Fig. S1A in Supplementary Appendix 1, available with the full text of this article at NEJM.org). Most biopsies were performed before treatment (96.5%), and the biopsy samples included ABC cases (51.4%), GCB cases (28.6%), and unclassified cases (20.0%). Because most biopsy samples lacked matched normal DNA, we developed a tumor-only mutation-calling pipeline. Using sequencing data from 48 cases with matched normal DNA, we created and validated a random forest-based model of somatic mutations, which predicted that 94% of the mutations called by our tumor-only pipeline are somatic (see the Methods section in Supplementary Appendix 1).
STATISTICAL ANALYSIS
P values relating discrete variables to each other were calculated with the use of a Fisher’s exact test. P values for survival were calculated from a Cox proportional-hazards score test. The score on the International Prognostic Index (IPI; range, 0 to 5, with higher scores indicating greater risk) was treated as a categorical variable: low (score of 0 or 1), intermediate (score of 2 or 3), or high (score of 4 or 5). P values for the differences in signature averages between DLBCL genetic subtypes were derived from Student t-tests. All P values reported are two-sided.
RESULTS
GENETIC DISTINCTIONS AMONG GENE-EXPRESSION SUBGROUPS
Multiplatform genomic analysis of 574 DLBCL biopsy samples identified genes that were altered at significantly different frequencies (P<0.01) in ABC and GCB cases (Fig. 1A; and Fig. S1B in Supplementary Appendix 1 and Tables S1 through S8 in Supplementary Appendix 2, available at NEJM.org). Because the genetic composition of unclassified DLBCL is unknown, we enriched for these cases (20.0% in our cohort, as compared with 11.3% in a population-based cohort9). Among common genetic features in unclassified DLBCL, NOTCH2 mutations and BCL6 fusions significantly co-occurred (P = 2.78×10⁻¹²) and distinguished unclassified from other DLBCLs (Fig. 1B, and Fig. S1C and S1D in Supplementary Appendix 1). Unclassified cases were enriched for mutations targeting SPEN, an inhibitor of NOTCH-dependent gene expression, and 30.4% of cases had NOTCH2 or SPEN mutations (Fig. 1B, and Fig. S1C in Supplementary Appendix 1). We additionally identified gain-of-function NOTCH1 mutations in 19 cases (Fig. S1C in Supplementary Appendix 1). However, these were primarily in ABC cases (95%) and never co-occurred with NOTCH2 or SPEN mutations, which suggests that NOTCH1 and NOTCH2 contribute to distinct pathogenetic pathways.
Figure 1. (facing page). Relationship between Gene-Expression Subgroups and Genetic Alterations.
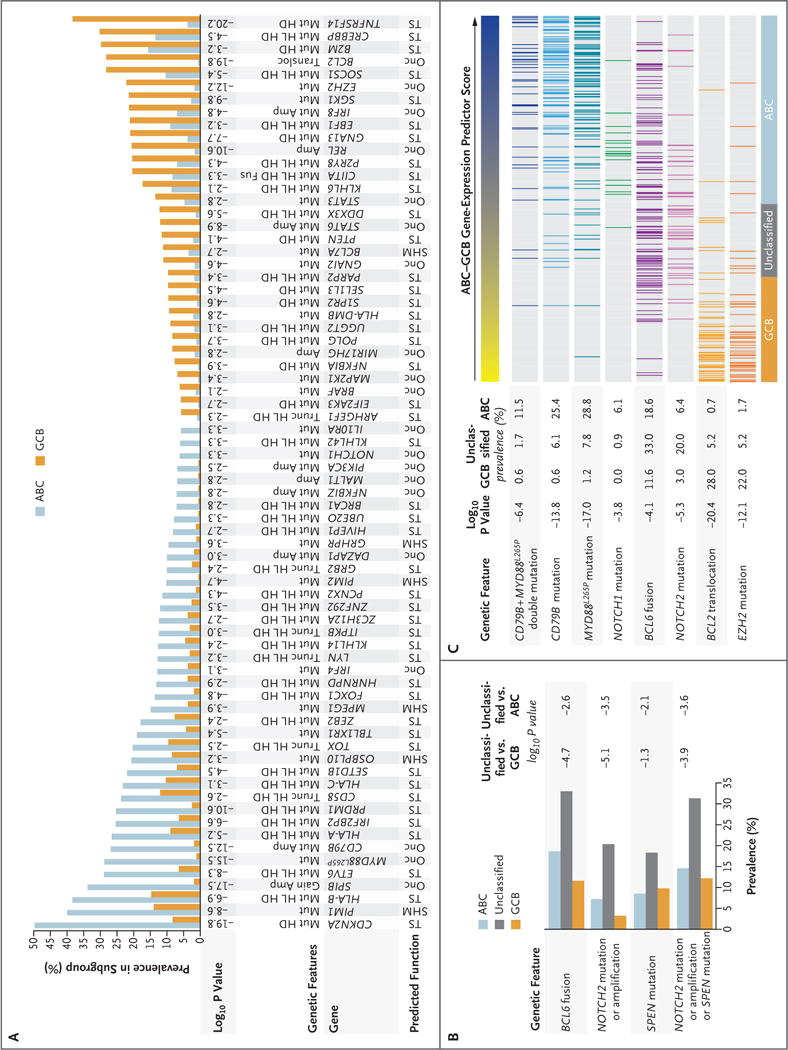
Panel A shows genetic aberrations that distinguish the activated B-cell–like (ABC) and germinal-center B-cell–like (GCB) subgroups of diffuse large B-cell lymphoma (DLBCL). Shown is the prevalence of the indicated genetic abnormalities in 72 genes in ABC and GCB, along with the log10 P value for the difference in prevalence between the two subgroups. Putative assignment as an oncogene (Onc), tumor suppressor (TS), or target of aberrant somatic hypermutation (SHM) is shown. Amp denotes amplification, Fus gene fusion, Gain single-copy gain, HD homozygous deletion, HL heterozygous loss, Mut mutation, Transloc translocation, and Trunc proteintruncating mutation. Panel B shows genetic lesions that are associated with unclassified DLBCL. Shown is the prevalence of the indicated genetic aberrations in the gene-expression subgroups, along with the log10 P values for the differences between unclassified and either ABC or GCB. Panel C shows the correlation between genetic abnormalities and the ABC–GCB gene-expression predictor score. The ABC–GCB predictor score is a quantitative metric used to assign DLBCL cases to the indicated gene-expression subgroups. High values (blue) are on the ABC end of the spectrum, and low values (yellow) are on the GCB end of the spectrum. The log10 P value of the correlation between the predictor score and the presence of the indicated aberrations is shown.
We next investigated whether genetic aberrations were correlated with the ABC–GCB predictor score, a quantitative gene-expression metric with low values for the most GCB-like cases and high values for the most ABC-like (Fig. 1C). NOTCH2 mutations and BCL6 fusions were concentrated in the center of this distribution, a finding consistent with their enrichment in unclassified DLBCL. In contrast, cases with CD79B and MYD88L265P mutations were enriched at the far ABC end of the spectrum, with significant co-occurrence of these abnormalities (P = 2.81×10⁻¹¹) (Fig. 1C). Although most NOTCH1 mutant cases were ABC DLBCL, none had CD79B or MYD88L265P mutations and their predictor scores were significantly lower than those of the CD79B–MYD88L265P double-mutant cases (P = 0.006) (Fig. 1C). On the GCB end of the spectrum, EZH2 mutations and BCL2 translocations significantly co-occurred (P = 6.39×10⁻¹⁴) and were present in cases with the lowest predictor scores (Fig. 1C). Together, these analyses suggest that the gene-expression subgroups may have distinct genetic subtypes.
A GENETIC CLASSIFIER FOR DLBCL
To identify genetic subtypes in DLBCL, we created an automated method that starts with a set of seed classes and iteratively moves cases into and out of the classes to optimize a genetic distinctiveness metric (see the Methods section and Fig. S2 in Supplementary Appendix 1). We chose four seeds as follows: CD79B–MYD88L265P double mutation, NOTCH2 mutation or BCL6 fusion in ABC or unclassified DLBCL, NOTCH1 mutation, and EZH2 mutation or BCL2 translocation. The algorithm converged on genetic subtypes that we term MCD (71 cases, from the MYD88L265P–CD79B seed), BN2 (98 cases, from the BCL6–NOTCH2 seed), N1 (19 cases, from the NOTCH1 seed), and EZB (69 cases, from the EZH2–BCL2 seed). A separate algorithm that used random forest methods produced significantly overlapping genetic subtypes (P<1×10−105) (see the Methods section in Supplementary Appendix 1). Among non-subtyped “other” cases, the only gene that was mutated in more than 10% of cases and was significantly enriched in this subset was TET2 (10.5% prevalence, P = 0.03). Thus, additional genetic subtypes were not apparent in our data set but may emerge from the study of larger DLBCL cohorts.
The MCD and N1 subtypes were dominated by ABC cases, EZB included mostly GCB cases, and BN2 had contributions from all three gene-expression subgroups (Fig. 2A). Overall, we classified 44.8% of our samples into these genetically “pure” subtypes of DLBCL and recognize that non-subtyped cases may share genetic features as well as etiologic factors with the genetic subtypes (Fig. 2B). Because we deliberately skewed our sample cohort toward ABC and unclassified cases, we modeled the expected prevalence of the genetic subtypes using a recent population-based analysis of the prevalence of ABC, GCB, and unclassified DLBCL.9 On the basis of the gene-expression predictor classifications of MCD, BN2, N1, and EZB cases, we estimate that these genetic subtypes would comprise 46.6% of cases (Fig. 2C).
Figure 2. Genetic Aberrations That Distinguish Genetic Subtypes of DLBCL.
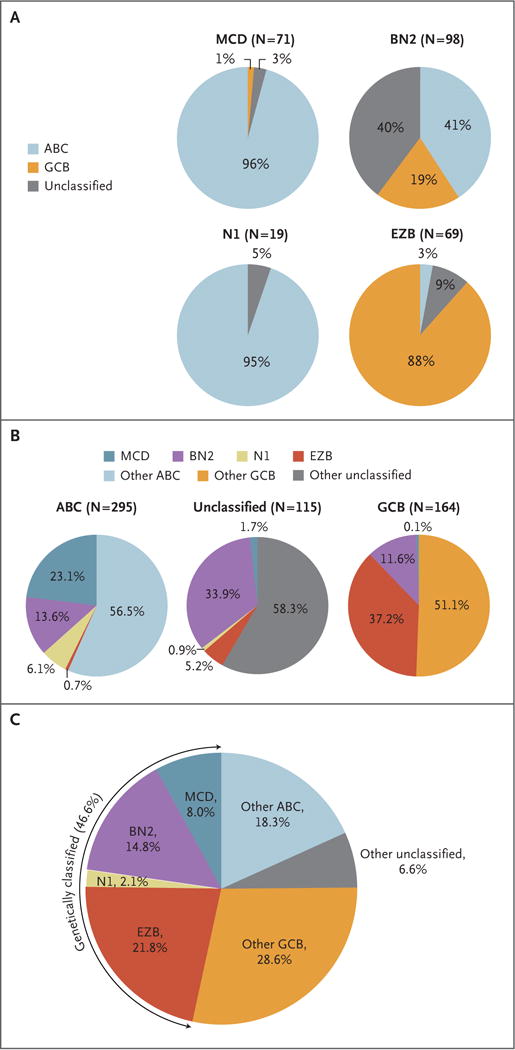
Panel A shows the distribution of gene-expression subgroups within genetic subtypes, termed MCD (based on the co-occurrence of MYD88L265P and CD79B mutations), BN2 (based on BCL6 fusions and NOTCH2 mutations), N1 (based on NOTCH1 mutations), and EZB (based on EZH2 mutations and BCL2 translocations). Panel B shows the distribution of genetic subtypes within gene-expression subgroups. In Panels A and B, the number of cases of DLBCL is shown in parentheses. Panel C shows the predicted prevalence of the indicated DLBCL subsets in a population-based cohort.9
To explore how this subtype classification might be implemented clinically, we created a subtype predictor using mutations in 50 genes and translocations of BCL2 and BCL6 (see the Methods section in Supplementary Appendix 1). In 10-fold cross-validation testing, the predictor was 94.8% accurate. A related predictor that included amplifications and homozygous deletions achieved 97.5% accuracy. Thus, next-generation sequencing tests for this subtype distinction would be feasible.
A total of 79 genes with aberrations that characterized each genetic subtype are shown in Figure S2B in Supplementary Appendix 1. MYD88L265P or a CD79B aberration (mutation or amplification) was present in 82% of MCD cases, with 42% bearing both abnormalities. MCD had frequent gain or amplification of SPIB, encoding a transcription factor that, with IRF4, defines the ABC phenotype and promotes plasmacytic differentiation.10 Full plasmacytic differentiation is blocked in MCD by mutations that inactivate BLIMP1 (PRDM1).11,12 Known tumor suppressors in MCD include CDKN2A, ETV6, BTG1, and BTG2, and putative tumor suppressors include TOX, SETD1B, FOXC1, TBL1XR1, and KLHL14. The tumor suppressor TP53 was mutated significantly less often in MCD than in other subtypes. Immune editing appears prominent in MCD genomes, with 76% acquiring a mutation or deletion of HLA-A, HLA-B, or HLA-C and 30% acquiring truncating mutations targeting CD58, an activator of natural killer cells.13
BN2 was dominated by NOTCH pathway aberrations, with 73% acquiring a NOTCH2 mutation or amplification, SPEN mutation, or mutation in DTX1, a NOTCH target gene. Many SPEN mutant BN2 cases (50%) lacked NOTCH2 aberrations, which suggests that NOTCH2 ligand– induced signaling may play a role in BN2. BCL6 fusion, the other BN2 hallmark, occurred in 73% of cases. BCL6 fusions were enriched in cases with NOTCH2, SPEN, or DTX1 lesions to a significantly greater extent in BN2 than in non-BN2 cases (72% vs. 15%, P = 2.31×10⁻¹⁰), a finding that suggests oncogenic cooperation between these pathways in BN2.
Genetic aberrations targeting regulators of the NF-κB pathway were a prominent feature of BN2. Lesions targeting the NF-κB negative regulator A20 (TNFAIP3) or its partner TNIP1 were common (55%). Two components of the B-cell receptor–dependent NF-κB pathway, protein kinase C beta (PRKCB) and BCL10, were altered by mutations or amplifications in 47% of BN2 cases. Other likely gain-of-function events included mutations targeting cyclin D3 and CXCR5, whereas inactivating lesions targeting the immune regulator CD70 suggested immune escape.
N1 was characterized by NOTCH1 mutations and aberrations targeting transcriptional regulators of B-cell differentiation (IRF4, ID3, and BCOR), which may contribute to its plasmacytic phenotype (see below). TNFAIP3 mutations in N1 could reinforce this phenotype by fostering NF-κB–induced IRF4 expression.
EZB was enriched for most genetic events previously ascribed to GCB DLBCL, including BCL2 translocation, EZH2 mutation, and REL amplification, as well as inactivation of the tumor suppressors TNFRSF14, CREBBP, EP300, and KMT2D. The germinal-center homing pathway involving S1PR2 and GNA1314 was disrupted in 38% of EZB cases. Janus-associated kinase–signal transducers and activators of transcription (JAK-STAT) signaling may have been promoted in 49% of cases by a STAT6 mutation or amplification or by a mutation or deletion targeting SOCS1, a JAK-STAT negative regulator. Phosphatidylinositol 3 (PI3) kinase–mammalian target of rapamycin signaling may have been activated in 23% of cases by MTOR mutations or amplification of MIR17HG, encoding a microRNA targeting PTEN. Immune editing may also sculpt EZB genomes since 39% acquired lesions in the major histocompatibility complex class II pathway genes CIITA and HLA-DMA.
EPIGENETIC ATTRIBUTES OF THE DLBCL GENETIC SUBTYPES
We used RNA-sequencing data to explore phenotypic differences among the DLBCL genetic subtypes, using gene-expression signatures of B-cell differentiation, oncogenic signaling, and the tumor microenvironment15 (Fig. 3). MCD expressed genes that are transactivated by IRF4, a master regulator of the ABC phenotype.10 In EZB, a signature of BCL6-repressed genes was low and a signature of TCF3-activated genes was high, implying a germinal-center origin. N1 expressed a plasma-cell signature highly.
Figure 3. Gene-Expression Signatures That Distinguish the DLBCL Genetic Subtypes.
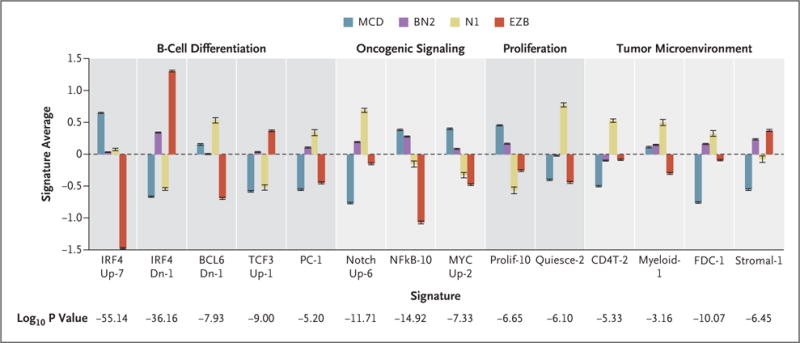
The mean values of the indicated signature averages for cases assigned to each genetic subtype are shown. A full annotation of these signatures is available in Figure S3 in Supplementary Appendix 1 and at https://lymphochip.nih.gov/signaturedb/. P values were calculated with the use of an F-test. I bars indicate standard errors.
Among oncogenic signatures, NOTCH signatures were highest in BN2 and N1. Signatures of B-cell receptor–dependent NF-κB activation were highest in MCD and BN2. Genes induced by MYC were highly expressed in MCD and BN2, as were signatures of proliferation. Conversely, a signature of quiescent cells was high in N1.
With respect to the tumor microenvironment, signatures of T cells, myeloid cells, and follicular dendritic cells were highest in N1. BN2 and EZB cases expressed the Stromal-1 signature highly, which reflects a fibrotic microenvironment that is associated with favorable survival in DLBCL after immunochemotherapy.3
CLINICAL ATTRIBUTES OF THE DLBCL GENETIC SUBTYPES
For the survival analysis, we selected all untreated patients with outcome data who received immunochemotherapy (R-CHOP or CHOP-like chemotherapy; 240 patients), including 119 patients whose tumors were classified into one of the genetic subtypes. Our genetic algorithm, which did not use clinical information, was locked down before the analysis of clinical data, allowing us to analyze the relationship between genetic subtypes and survival in this entire cohort. The four subtypes differed significantly in progression-free survival (P = 8.88×10⁻⁶) and overall survival (P = 1.70×10⁻⁴), with the BN2 and EZB subtypes having much more favorable outcomes than the MCD and N1 subtypes (Fig. 4A and 4B). The predicted 5-year overall survival rates for the MCD, N1, BN2, and EZB subtypes were 26%, 36%, 65%, and 68%, respectively.
Figure 4. (facing page). Relationship between DLBCL Genetic Subtypes and Survival after R-CHOP Chemotherapy.
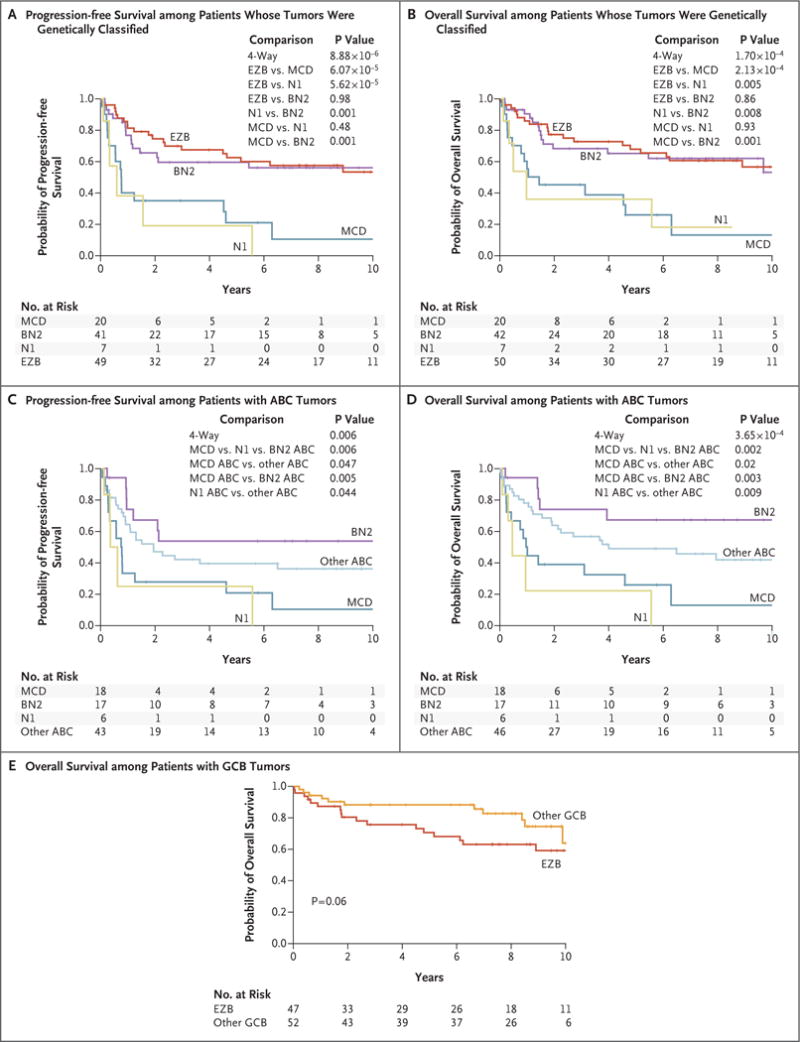
Panels A and B show Kaplan–Meier models of progression-free survival and overall survival, respectively, according to DLBCL genetic subtype. Panels C and D show Kaplan–Meier models of progression-free survival and overall survival, respectively, among patients with ABC DLBCL according to genetic subtype and including patients with non-subtyped ABC cases as “other ABC.” Panel E shows a Kaplan–Meier model of overall survival among patients with GCB DLBCL cases belonging to the EZB subtype or not (“other GCB”). R-CHOP denotes rituximab, cyclophosphamide, doxorubicin, vincristine, and prednisone.
Within ABC DLBCL, the MCD, N1, and BN2 genetic subtypes had distinct progression-free survival (P = 0.006) and overall survival (P = 0.002) (Fig. 4C and 4D). Patients with MCD had significantly inferior survival as compared with those with BN2, and patients with either MCD or N1 had significantly inferior survival as compared with patients with ABC tumors that were not genetically classified (Fig. 4C and 4D). Within GCB DLBCL, there was a trend toward inferior overall survival among patients with EZB as compared with patients with other GCB tumors (P = 0.06) (Fig. 4E). The distinction regarding the gene-expression profiling subgroup and the distinction regarding the genetic subtype contributed independently to survival in a multivariate analysis: gene-expression profiling added significantly to a genetic-subtype model (P = 7.91×10⁻⁷), and genetic subtype added significantly to a gene-expression profiling model (P = 4.16×10⁻⁴).
The IPI score did not vary significantly among the genetic subtypes (Tables S9 and S10 in Supplementary Appendix 2). However, with respect to individual IPI components, patients with EZB tumors had significantly better performance status (greater prevalence of an Eastern Cooperative Oncology Group performance status >1; P = 0.001). A trend toward increased extranodal involvement (>1 site) was a feature of MCD (28% prevalence, as compared with 16% in others; P = 0.051) and potentially N1 (38%; P = 0.06). The degree of extranodal involvement in MCD is of interest, given the frequent CD79B and MYD88L265P mutations in these tumors, which are cardinal features of extranodal lymphomas such as primary central nervous system lymphoma.16 Moreover, several other genes that were characteristically mutated in MCD tumors are recurrently mutated in primary central nervous system lymphoma (Fig. S4 in Supplementary Appendix 1).
The IPI score was associated with progression-free survival (P = 1.51×10⁻⁶) and overall survival (P = 6.05×10⁻⁵), as expected. The genetic subtype distinction added significantly to the IPI model of progression-free survival (P =5.60×10⁻⁴) and overall survival (P = 0.001).
ONCOGENIC PATHWAYS
To gain insight into potential therapeutic strategies for the genetic subtypes of DLBCL, we considered groups of genetic aberrations that target oncogenic signaling pathways (Fig. 5). First, we considered the regulation of proximal B-cell receptor signaling, both positively by mutation or amplification of CD79B and CD79A (“CD79A/B”) and negatively by known inhibitors of B-cell receptor signaling in normal B cells, including LAPTM5,17 LYN,18 PTPN6,18 GRB2,19 PRKCD,20 DGKZ,21 SLA,22 and MAP4K123 (Fig. 5, and Fig. S5A in Supplementary Appendix 1). Potential loss-of-function lesions targeting negative regulators of B-cell receptor signaling (“BCRnegreg”) were present in 38.5% of cases. They were more prevalent in CD79A/B cases with MYD88L265P (56%) than in cases lacking these aberrations (36.4%) (P = 0.02). This is notable given evidence that aggressive lymphomas with both MYD88L265P and CD79B mutations frequently have a response to ibrutinib and presumably have “chronic active” B-cell receptor signaling.4,16,24
Figure 5. Genetic Aberrations Targeting Oncogenic Signaling Pathways in DLBCL.
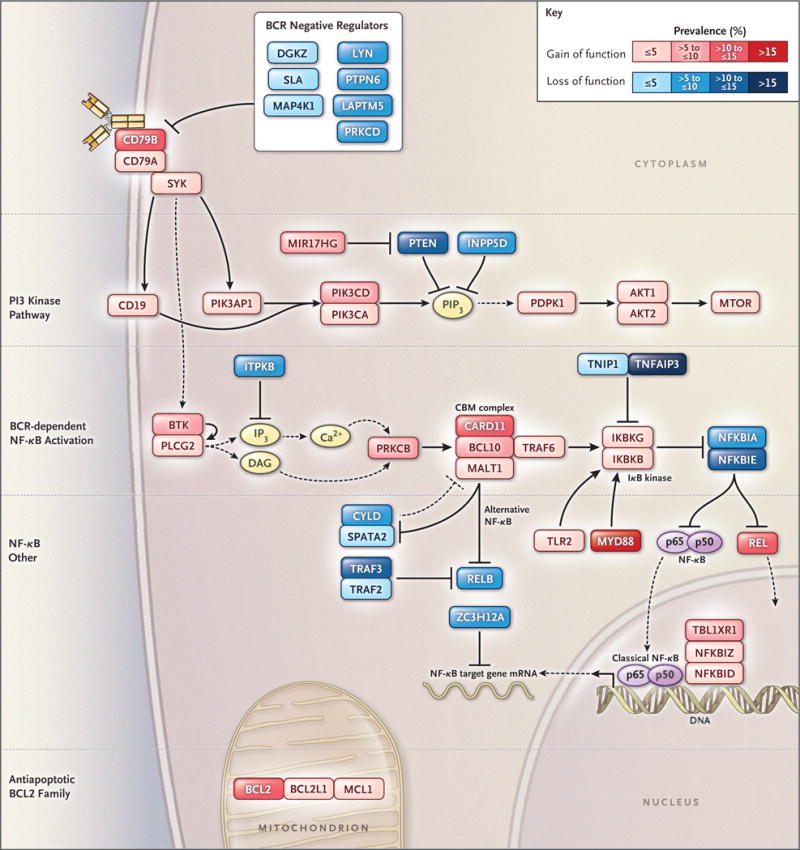
Shown is the prevalence of putative gain-of-function or loss-of-function genetic aberrations targeting genes in each indicated oncogenic signaling category. The prevalence of genetic aberrations is indicated by the color scale shown. Genetic aberrations included for each gene are indicated in Figure S5B in Supplementary Appendix 1. BCR denotes B-cell receptor, CBM complex CARD11–BCL10–MALT1 signaling adaptor complex, mRNA messenger RNA, and NF-κB nuclear factor κB.
Signaling enzymes and adaptors that promote B-cell receptor–dependent NF-κB activation (“BCR–NF-κB”) were genetically aberrant in 44.9% of cases (Fig. 5, and Fig. S5A and S5B in Supple mentary Appendix 1). This B-cell receptor signaling cascade activates IκB kinase (IKK), which was altered in 8.5% of cases. IKK is negatively regulated by A20 and its partner TNIP1, which were targeted by mutations and deletions in 25.8% of cases. A variety of additional genetic events in 66.2% of cases affected other NF-κB regulators, such as TLR2 and regnase-1 (ZC3H12A), which negatively regulates the stability of NF-κB– dependent messenger RNA (mRNA).25 The PI3 kinase pathway, which can indirectly activate NF-κB,26 was genetically altered in 34.3% of cases.
Among the genetic subtypes, BCRnegreg aberrations were most frequent in MCD and least frequent in EZB, but these aberrations occurred in all genetic subtypes, suggesting that constitutive B-cell receptor signaling is a pervasive aspect of DLBCL pathogenesis (Fig. S5B in Supplementary Appendix 1). In addition to BCRnegreg alterations, MCD frequently acquired CD79A/B aberrations and thus was significantly enriched for lesions targeting B-cell receptor proximal signaling (in 75% of cases; P = 3.72×10⁻⁶). BN2 was notably enriched for BCR–NF-κB aberrations (in 66% of cases; P = 3.81×10⁻⁶) and IKK regulator aberrations (in 56% of cases; P = 8.34×10⁻¹¹). These findings support the hypothesis that B-cell receptor–dependent NF-κB activation is a recurrent feature of MCD and BN2 tumors.
In addition to NF-κB, survival of DLBCL cells is promoted by antiapoptotic BCL2 family members (BCL2, BCL-XL [BCL2L1], and MCL1), which were targeted by genomic amplification or translocation in 17.4% of cases (Fig. 5, and Fig. S5A and S5B in Supplementary Appendix 1). As expected, BCL2 mRNA levels were significantly higher in EZB tumors with BCL2 translocations than in other EZB tumors (P = 0.004) (Fig. S5C in Supplementary Appendix 1). MCD tumors also had high BCL2 mRNA expression as compared with other cases (P = 0.009) (Fig. S5C in Supplementary Appendix 1), a finding that potentially explains why MCD was significantly lacking in amplifications and translocations of antiapoptotic BCL2 family members (P = 1.60×10⁻⁴) (Fig. S5A in Supplementary Appendix 1).
DISCUSSION
The genetic framework for DLBCL that we present here provides a new and evolving understanding of the pathogenesis of DLBCL and the molecular attributes that may influence therapeutic response. Unlike previous genetic investigations that catalogued individual genetic aberrations, our study identified genetic subtypes of DLBCL that differ from one another by many recurrent genetic aberrations. There are two overarching implications of these findings. First, it seems likely that these genetic subtypes have distinct evolutionary histories driven by the stage of B-cell differentiation from which they arise or by their initiating genetic events (or both), which may influence the subsequent acquisition of cooperating genetic lesions. Second, the genetic subtypes had distinct outcomes after immunochemotherapy and could affect the selection of targeted therapies owing to their distinct oncogenic abnormalities.
The MCD genetic subtype was enriched for many of the genetic changes that have been ascribed previously to the ABC subgroup of DLBCL. MCD included cases with both MYD88L265P and CD79B mutations, a genotype that has been associated with a response to ibrutinib in relapsed or refractory ABC DLBCL4 and is common in primary central nervous system lymphoma, which has an ABC phenotype and which often has a response to ibrutinib.16,24 Moreover, MCD tumors had extensive extranodal involvement and acquired mutations in genes that are recurrently mutated in primary extranodal lymphomas. Together, these observations suggest that the pathogenesis of nodal MCD DLBCL is related to that of primary extranodal lymphomas.
The BN2 subtype sheds light on unclassified DLBCL, a previously obscure gene-expression subgroup, and is predicted to rely on B-cell receptor–dependent NF-κB activation and to be responsive to antagonists of B-cell receptor signaling such as the Bruton’s tyrosine kinase (BTK) inhibitors. NOTCH2 mutations link BN2 to marginal-zone lymphoma, which is also responsive to ibrutinib.27–29 BCL6 fusions, the second defining feature of BN2, are common in transformed marginal-zone lymphoma,30 raising the possibility that BN2 arises from an occult marginal-zone lymphoma. N1 differs from BN2 genetically, phenotypically, and clinically, despite functional similarities between NOTCH1 and NOTCH2, suggesting a distinct pathogenesis. Finally, most of the genetic lesions previously associated with GCB DLBCL were concentrated in the EZB subtype, reflecting a shared genetic pathogenesis and distinguishing them from other GCB tumors.
In our cohort, these genetic subtypes differed in their outcomes after immunochemotherapy, which were favorable in BN2 and EZB and poorer in MCD and N1. Moreover, within ABC DLBCL, heterogeneity in clinical outcome can be traced, in part, to genetic heterogeneity, with inferior survival in the MCD and N1 subtypes and favorable survival in the BN2 subtype. Hence, our findings suggest that clinical trials involving patients with ABC DLBCL who received R-CHOP–like chemotherapy should be interpreted in the light of these genetic distinctions. Our survival analysis tested a single hypothesis on the basis of a locked-down genetic-subtype algorithm that did not use the clinical data. Nonetheless, evaluation of the relationship between these genetic subtypes and treatment response in additional cohorts will be important to confirm and extend these findings.
The results of our studies suggest that, in clinical trials, targeted agents in DLBCL could be evaluated in the context of particular genetic subtypes or genetic aberrations that affect the targeted pathway. For example, drugs that target B-cell receptor–dependent NF-κB activation (e.g., inhibitors of BTK and protein kinase C beta) could be investigated in BN2 and MCD, given their enrichment for genetic aberrations that should activate or augment this signaling. Clinical trials evaluating inhibitors of B-cell receptor proximal signaling (e.g., spleen tyrosine kinase [SYK] inhibitors) or the downstream PI3 kinase pathway could investigate whether response is correlated with lesions that alter negative regulators of B-cell receptor signaling or the B-cell receptor subunits CD79A and CD79B. Differential BCL2 expression could be considered in the assessment of response to BCL2 inhibitors. Finally, immune-checkpoint inhibitors could be studied in the N1 subtype, given its prominent T-cell gene-expression signature and poor response to R-CHOP.
In summary, our multiplatform genomic analysis builds on the gene-expression classification of DLBCL by the addition of a genetic nosology that may inform DLBCL pathogenesis. Our analysis uncovered an interrelationship between this genetic nosology and oncogenic signaling pathways, suggesting testable therapeutic interventions. From the perspective of precision medicine, selecting treatment for DLBCL on the basis of individual genetic alterations is not optimal since it is likely that constellations of genetic aberrations influence therapeutic response. The genetic subtypes that we define may provide a conceptual edifice on which to develop precision therapies for these aggressive cancers.
Supplementary Material
Acknowledgments
Supported by the Intramural Research Program of the National Institutes of Health (NIH), the Center for Cancer Research of the National Cancer Institute (NCI), and an NCI Strategic Partnering to Evaluate Cancer Signatures grant (5U01CA157581-05). Dr. Schmitz was supported by the Dr. Mildred Scheel Stiftung fur Krebsforschung (Deutsche Krebshilfe). Dr. Kasbekar was supported by the NIH Oxford–Cambridge Scholars Program and the Washington University in St. Louis Medical Scientist Training Program. Dr. Hodson was a Kay Kendall Leukaemia Fund intermediate research fellow.
We thank Kathleen Calzone, Ina Felau, Bill Wysocki, Michael Fitzsimons, and Wendy Wu for help with Database of Genotypes and Phenotypes and NCI Genomic Data Commons submission; Arati Raziuddin, Xiaolin Wu, and Nina Bubunenko (Frederick National Laboratory for Cancer Research, Leidos Biomedical Research) for help with exome library preparation and NanoString analysis; Norman Gerry (Advanced BioMedical Laboratories) for processing data from the Affymetrix Genome-Wide Human SNP Array 6.0 platform; Michele Ceribelli and Hee Min Yoo for helpful discussions; and Arlene Dyer for administrative assistance.
APPENDIX
The authors’ full names and academic degrees are as follows: Roland Schmitz, Ph.D., George W. Wright, Ph.D., Da Wei Huang, M.D., Calvin A. Johnson, Ph.D., James D. Phelan, Ph.D., James Q. Wang, Ph.D., Sandrine Roulland, Ph.D., Monica Kasbekar, Ph.D., Ryan M. Young, Ph.D., Arthur L. Shaffer, Ph.D., Daniel J. Hodson, M.D., Ph.D., Wenming Xiao, Ph.D., Xin Yu, M.Sc., Yandan Yang, Ph.D., Hong Zhao, M.Sc., Weihong Xu, M.Sc., Xuelu Liu, M.Sc., Bin Zhou, M.Sc., Wei Du, Ph.D., Wing C. Chan, M.D., Elaine S. Jaffe, M.D., Randy D. Gascoyne, M.D., Joseph M. Connors, M.D., Elias Campo, M.D., Armando Lopez-Guillermo, M.D., Andreas Rosenwald, M.D., German Ott, M.D., Jan Delabie, M.D., Ph.D., Lisa M. Rimsza, M.D., Kevin Tay Kuang Wei, M.D., Andrew D. Zelenetz, M.D., Ph.D., John P. Leonard, M.D., Nancy L. Bartlett, M.D., Bao Tran, M.Sc., Jyoti Shetty, M.Sc., Yongmei Zhao, M.Sc., Dan R. Soppet, Ph.D., Stefania Pittaluga, M.D., Wyndham H. Wilson, M.D., Ph.D., and Louis M. Staudt, M.D., Ph.D.
From the Lymphoid Malignancies Branch (R.S., D.W.H., J.D.P., J.Q.W., S.R., M.K., R.M.Y., A.L.S., D.J.H., W. Xiao, X.Y., Y.Y., H.Z., W. Xu, W.H.W., L.M.S.), the Biometric Research Program, Division of Cancer Diagnosis and Treatment (G.W.W.), and the Laboratory of Pathology, Center for Cancer Research (E.S.J., S.P.), National Cancer Institute, and the Office of Intramural Research, Center for Information Technology (C.A.J., X.L., B.Z., W.D.), National Institutes of Health, Bethesda, and the Cancer Research Technology Program, Leidos Biomedical Research, Frederick National Laboratory for Cancer Research, Frederick (B.T., J.S., Y.Z., D.R.S.) – all in Maryland; the Department of Pathology, City of Hope National Medical Center, Duarte, CA (W.C.C.); the BC Cancer Agency, Vancouver, BC (R.D.G., J.M.C.), and the University Health Network, Laboratory Medicine Program, Toronto General Hospital and University of Toronto, Toronto (J.D.) – both in Canada; the Hospital Clinic of Barcelona, University of Barcelona, Institute for Biomedical Research August Pi I Sunyer, Barcelona (E.C., A.L.-G.); the Institute of Pathology, University of Würzburg, and Comprehensive Cancer Center Mainfranken, Würzburg (A.R.), and the Department of Clinical Pathology, Robert-Bosch-Krankenhaus, and Dr. Margarete Fischer-Bosch Institute for Clinical Pharmacology, Stuttgart (G.O.) – all in Germany; the Department of Laboratory Medicine and Pathology, Mayo Clinic, Scottsdale, AZ (L.M.R.); the National Cancer Centre of Singapore, Singapore (K.T.K.W.); Memorial Sloan Kettering Cancer Center (A.D.Z.) and Weill Cornell Medicine (J.P.L.) – both in New York; the Department of Medicine, Washington University School of Medicine, St. Louis (N.L.B.); and the Alliance for Clinical Trials in Oncology, Chicago (A.D.Z., J.P.L., N.L.B.).
Footnotes
Disclosure forms provided by the authors are available with the full text of this article at NEJM.org.
References
- 1.Alizadeh AA, Eisen MB, Davis RE, et al. Distinct types of diffuse large B-cell lymphoma identified by gene expression profiling. Nature. 2000;403:503–11. doi: 10.1038/35000501. [DOI] [PubMed] [Google Scholar]
- 2.Rosenwald A, Wright G, Chan WC, et al. The use of molecular profiling to predict survival after chemotherapy for diffuse large-B-cell lymphoma. N Engl J Med. 2002;346:1937–47. doi: 10.1056/NEJMoa012914. [DOI] [PubMed] [Google Scholar]
- 3.Lenz G, Wright G, Dave SS, et al. Stromal gene signatures in large-B-cell lymphomas. N Engl J Med. 2008;359:2313–23. doi: 10.1056/NEJMoa0802885. [DOI] [PMC free article] [PubMed] [Google Scholar]
- 4.Wilson WH, Young RM, Schmitz R, et al. Targeting B cell receptor signaling with ibrutinib in diffuse large B cell lymphoma. Nat Med. 2015;21:922–6. doi: 10.1038/nm.3884. [DOI] [PMC free article] [PubMed] [Google Scholar]
- 5.Shaffer AL, III, Young RM, Staudt LM. Pathogenesis of human B cell lymphomas. Annu Rev Immunol. 2012;30:565–610. doi: 10.1146/annurev-immunol-020711-075027. [DOI] [PMC free article] [PubMed] [Google Scholar]
- 6.Ngo VN, Davis RE, Lamy L, et al. A loss-of-function RNA interference screen for molecular targets in cancer. Nature. 2006;441:106–10. doi: 10.1038/nature04687. [DOI] [PubMed] [Google Scholar]
- 7.Davis RE, Ngo VN, Lenz G, et al. Chronic active B-cell-receptor signalling in diffuse large B-cell lymphoma. Nature. 2010;463:88–92. doi: 10.1038/nature08638. [DOI] [PMC free article] [PubMed] [Google Scholar]
- 8.Ngo VN, Young RM, Schmitz R, et al. Oncogenically active MYD88 mutations in human lymphoma. Nature. 2011;470:115–9. doi: 10.1038/nature09671. [DOI] [PMC free article] [PubMed] [Google Scholar]
- 9.Scott DW, Mottok A, Ennishi D, et al. Prognostic significance of diffuse large B-cell lymphoma cell of origin determined by digital gene expression in formalin-fixed paraffin-embedded tissue biopsies. J Clin Oncol. 2015;33:2848–56. doi: 10.1200/JCO.2014.60.2383. [DOI] [PMC free article] [PubMed] [Google Scholar]
- 10.Yang Y, Shaffer AL, III, Emre NC, et al. Exploiting synthetic lethality for the therapy of ABC diffuse large B cell lymphoma. Cancer Cell. 2012;21:723–37. doi: 10.1016/j.ccr.2012.05.024. [DOI] [PMC free article] [PubMed] [Google Scholar]
- 11.Mandelbaum J, Bhagat G, Tang H, et al. BLIMP1 is a tumor suppressor gene frequently disrupted in activated B cell-like diffuse large B cell lymphoma. Cancer Cell. 2010;18:568–79. doi: 10.1016/j.ccr.2010.10.030. [DOI] [PMC free article] [PubMed] [Google Scholar]
- 12.Calado DP, Zhang B, Srinivasan L, et al. Constitutive canonical NF-κB activation cooperates with disruption of BLIMP1 in the pathogenesis of activated B cell-like diffuse large cell lymphoma. Cancer Cell. 2010;18:580–9. doi: 10.1016/j.ccr.2010.11.024. [DOI] [PMC free article] [PubMed] [Google Scholar]
- 13.Challa-Malladi M, Lieu YK, Califano O, et al. Combined genetic inactivation of β2-Microglobulin and CD58 reveals frequent escape from immune recognition in diffuse large B cell lymphoma. Cancer Cell. 2011;20:728–40. doi: 10.1016/j.ccr.2011.11.006. [DOI] [PMC free article] [PubMed] [Google Scholar]
- 14.Muppidi JR, Schmitz R, Green JA, et al. Loss of signalling via Gα13 in germinal centre B-cell-derived lymphoma. Nature. 2014;516:254–8. doi: 10.1038/nature13765. [DOI] [PMC free article] [PubMed] [Google Scholar]
- 15.Shaffer AL, Wright G, Yang L, et al. A library of gene expression signatures to illuminate normal and pathological lymphoid biology. Immunol Rev. 2006;210:67–85. doi: 10.1111/j.0105-2896.2006.00373.x. [DOI] [PubMed] [Google Scholar]
- 16.Lionakis MS, Dunleavy K, Roschewski M, et al. Inhibition of B cell receptor signaling by ibrutinib in primary CNS lymphoma. Cancer Cell. 2017;31(6):833–843.e5. doi: 10.1016/j.ccell.2017.04.012. [DOI] [PMC free article] [PubMed] [Google Scholar]
- 17.Ouchida R, Kurosaki T, Wang JY. A role for lysosomal-associated protein transmembrane 5 in the negative regulation of surface B cell receptor levels and B cell activation. J Immunol. 2010;185:294–301. doi: 10.4049/jimmunol.1000371. [DOI] [PubMed] [Google Scholar]
- 18.Cornall RJ, Cyster JG, Hibbs ML, et al. Polygenic autoimmune traits: Lyn, CD22, and SHP-1 are limiting elements of a biochemical pathway regulating BCR signaling and selection. Immunity. 1998;8:497–508. doi: 10.1016/s1074-7613(00)80554-3. [DOI] [PubMed] [Google Scholar]
- 19.Lösing M, Goldbeck I, Manno B, et al. The Dok-3/Grb2 protein signal module attenuates Lyn kinase-dependent activation of Syk kinase in B cell antigen receptor microclusters. J Biol Chem. 2013;288:2303–13. doi: 10.1074/jbc.M112.406546. [DOI] [PMC free article] [PubMed] [Google Scholar]
- 20.Mecklenbräuker I, Saijo K, Zheng NY, Leitges M, Tarakhovsky A. Protein kinase Cdelta controls self-antigen-induced B-cell tolerance. Nature. 2002;416:860–5. doi: 10.1038/416860a. [DOI] [PubMed] [Google Scholar]
- 21.Wheeler ML, Dong MB, Brink R, Zhong XP, DeFranco AL. Diacylglycerol kinase ζ limits B cell antigen receptor-dependent activation of ERK signaling to inhibit early antibody responses. Sci Signal. 2013;6:ra91. doi: 10.1126/scisignal.2004189. [DOI] [PMC free article] [PubMed] [Google Scholar]
- 22.Dragone LL, Myers MD, White C, et al. Src-like adaptor protein (SLAP) regulates B cell receptor levels in a c-Cbl-dependent manner. Proc Natl Acad Sci U S A. 2006;103:18202–7. doi: 10.1073/pnas.0608965103. [DOI] [PMC free article] [PubMed] [Google Scholar]
- 23.Wang X, Li JP, Kuo HK, et al. Down-regulation of B cell receptor signaling by hematopoietic progenitor kinase 1 (HPK1)-mediated phosphorylation and ubiquitination of activated B cell linker protein (BLNK) J Biol Chem. 2012;287:11037–48. doi: 10.1074/jbc.M111.310946. [DOI] [PMC free article] [PubMed] [Google Scholar]
- 24.Grommes C, Pastore A, Palaskas N, et al. Ibrutinib unmasks critical role of Bruton tyrosine kinase in primary CNS lymphoma. Cancer Discov. 2017;7:1018–29. doi: 10.1158/2159-8290.CD-17-0613. [DOI] [PMC free article] [PubMed] [Google Scholar]
- 25.Iwasaki H, Takeuchi O, Teraguchi S, et al. The IκB kinase complex regulates the stability of cytokine-encoding mRNA induced by TLR-IL-1R by controlling degradation of regnase-1. Nat Immunol. 2011;12:1167–75. doi: 10.1038/ni.2137. [DOI] [PubMed] [Google Scholar]
- 26.Kloo B, Nagel D, Pfeifer M, et al. Critical role of PI3K signaling for NF-kappaB-dependent survival in a subset of activated B-cell-like diffuse large B-cell lymphoma cells. Proc Natl Acad Sci U S A. 2011;108:272–7. doi: 10.1073/pnas.1008969108. [DOI] [PMC free article] [PubMed] [Google Scholar]
- 27.Rossi D, Trifonov V, Fangazio M, et al. The coding genome of splenic marginal zone lymphoma: activation of NOTCH2 and other pathways regulating marginal zone development. J Exp Med. 2012;209:1537–51. doi: 10.1084/jem.20120904. [DOI] [PMC free article] [PubMed] [Google Scholar]
- 28.Noy A, de Vos S, Thieblemont C, et al. Targeting Bruton tyrosine kinase with ibrutinib in relapsed/refractory marginal zone lymphoma. Blood. 2017;129:2224–32. doi: 10.1182/blood-2016-10-747345. [DOI] [PMC free article] [PubMed] [Google Scholar]
- 29.Kiel MJ, Velusamy T, Betz BL, et al. Whole-genome sequencing identifies recurrent somatic NOTCH2 mutations in splenic marginal zone lymphoma. J Exp Med. 2012;209:1553–65. doi: 10.1084/jem.20120910. [DOI] [PMC free article] [PubMed] [Google Scholar]
- 30.Flossbach L, Antoneag E, Buck M, et al. BCL6 gene rearrangement and protein expression are associated with large cell presentation of extranodal marginal zone B-cell lymphoma of mucosa-associated lymphoid tissue. Int J Cancer. 2011;129:70–7. doi: 10.1002/ijc.25663. [DOI] [PubMed] [Google Scholar]
Associated Data
This section collects any data citations, data availability statements, or supplementary materials included in this article.