

Abstract
Protein-protein interactions are an important mechanism for the regulation of enzyme function allowing metabolite channeling, crosstalk between pathways or the introduction of post-translational modifications. Therefore, a number of high-throughput studies have been carried out to shed light on the protein networks established under different pathophysiological settings. Surprisingly, this type of information is quite limited for enzymes of intermediary metabolism such as betaine homocysteine S-methyltransferase, despite its high hepatic abundancy and its role in homocysteine metabolism. Here, we have taken advantage of two approaches, affinity purification combined with mass spectrometry and yeast two-hybrid, to further uncover the array of interactions of betaine homocysteine S-methyltransferase in normal liver of Rattus norvegicus. A total of 131 non-redundant putative interaction targets were identified, out of which 20 were selected for further validation by coimmunoprecipitation. Interaction targets validated by two different methods include: S-methylmethionine homocysteine methyltransferase or betaine homocysteine methyltransferase 2, methionine adenosyltransferases α1 and α2, cAMP-dependent protein kinase catalytic subunit alpha, 4-hydroxyphenylpyruvic acid dioxygenase and aldolase b. Network analysis identified 122 nodes and 165 edges, as well as a limited number of KEGG pathways that comprise: the biosynthesis of amino acids, cysteine and methionine metabolism, the spliceosome and metabolic pathways. These results further expand the connections within the hepatic methionine cycle and suggest putative cross-talks with additional metabolic pathways that deserve additional research.
Introduction
High levels of homocysteine (Hcy) in plasma have been associated with a variety of pathologies that expand from cardiovascular disease to hearing loss [1–4]. The liver, and precisely, impairments in hepatic methionine metabolism seem to be responsible of these increased plasmatic Hcy concentrations, since approximately 50% of the ingested methionine is used in this organ [5]. Hcy is produced in the methionine cycle, catabolized by the transsulfuration pathway and its excess is exported to the blood [6]. However, when there is a need of methionine, Hcy can be methylated for the synthesis of this amino acid. Three enzymes can perform Hcy methylation using different methyl donors and, among them betaine homocysteine S-methyltransferase (BHMT) uses the osmolyte betaine for this purpose [7]. The diet is the main source of betaine [8], but this metabolite can be also obtained by choline oxidation in the mitochondria [9]. This oxidation allows recovery of one out of the three methyl groups donated by S-adenosylmethionine for the synthesis of phosphatidylcholine from phosphatidylethanolamine in one of the hepatic processes that more S-adenosylmethionine consumes [10]. Therefore, BHMT becomes a link between osmoregulation, phospholipid synthesis and methionine/Hcy metabolism.
BHMT is mainly expressed in the liver [11, 12], where it constitutes ~1% of the total protein of hepatocytes [7, 13, 14]. Nevertheless, different levels of Bhmt gene expression are also detected in other rat tissues [11, 15, 16]. Intermediate expression levels are measured in the kidney, followed by the testis and brain, and low levels are found in the lung, cerebellum and skeletal muscle [11]. Moreover, in tissues with low expression levels the BHMT protein is only detected in specific cell types (i.e. Sertoli and Purkinje cells) [11]. BHMT gene expression is altered in several diseases mainly concerning the liver (i.e. cirrhosis), but also in diabetes [17] or Barret’s esophagus [18]. Moreover, the presence of the protein in the lens has been associated to its role in osmoregulation, a process that is altered during cataract development [19].
BHMTs are highly conserved and sequences for the human and rat proteins are ~92% identical. The enzyme is a homotetramer with high thermal stability [20, 21], a property that has been used for its purification from mammalian tissues. Crystal structures show the tight binding between BHMT monomers in the dimer, as well as that of the dimers in the tetramer [22, 23]. An essential contributor to the high enzyme stability is the existence of a C-terminal α-helix (~30 residues) that extends from one monomer towards another located immediately below or above, establishing a large number of hydrophobic interactions [20, 21, 24]. The rest of the subunit folds into a (α/β)8 barrel, where Zn2+ binding takes place through three cysteines and a tyrosine [22, 23, 25].
Classical studies have considered BHMT a cytoplasmic enzyme, but recent data show BHMT immunostaining both in the cytoplasm and the nuclear compartment in most cell types. Nevertheless, the cytoplasmic localization is preferred in hepatocytes, whereas nuclear localization is favored in tissues/cells exhibiting low expression [11]. Importantly, BHMT has the same oligomeric assembly in both subcellular compartments, where it is able to catalyze methionine synthesis [11]. In normal liver, only minute amounts of nuclear BHMT can be detected, but reductions in the cytosolic protein content together with nuclear accumulation are detected upon induction of acute liver injury with D-galactosamine or inhibition of glutathione synthesis by buthionine sulfoximine [11]. This anomalous nucleocytoplasmic distribution can be prevented by the administration of N-acetylcysteine or glutathione monoethyl ester, two compounds that serve as glutathione precursors and aid to the preservation of the normal GSH/GSSG ratio.
Mechanisms that have been involved in the control of nucleocytoplasmic distribution include the addition or removal of posttranslational modifications (PTMs), as well as protein-protein interactions. Datasets derived from several high-throughput studies focused on the identification of protein targets for certain PTMs or on the elucidation of the human interactome have rendered data concerning BHMT. For example, phosphorylation [26, 27], ubiquitination [28], acetylation [29, 30], succinylation [30], carbonylation [31], and nitrosylation [32] are some of the PTMs detected on BHMT in these analyses, whereas other studies also identify BHMT as a target for modification by transglutaminase [33]. Nevertheless, in many cases the existence of these PTMs has not been verified by additional methods, neither the enzymes catalyzing these modifications have been identified. Additionally, datasets from high-throughput experiments also showed the involvement of BHMT in some protein-protein interactions, which constitutes a surprisingly small set given the hepatic protein abundance. This list includes e.g. BHMT2 and high mobility group box 1 (HMGB1), which needs to be translocated to the cytoplasm for its interaction with BHMT [34–36]. Therefore, in order to expand the current network of BHMT hepatic interacting partners we have carried out a new high-throughput study using a double approach, affinity purification combined with mass spectrometry (AP-MS) and yeast two-hybrid (YTH). Here, we describe the new targets identified, as well as their validation by coimmunoprecipitation.
Materials and methods
Plasmid constructions and mutagenesis
The pTYB12-BHMT and pFLAG-BHMT plasmids containing the ORF of R. norvegicus Bhmt were described previously [11, 25]. Plasmids containing the sequences of BHMT interaction targets were prepared from Image clones containing the complete ORFs that were purchased from Source Bioscience Geneservice (Nottingham, UK). Exceptions are: i) pHA-MAT containing the rat Mat1a ORF that was previously described [37]; ii) pHA-MAT2A that was obtained by NdeI/EcoRI digestion of pT7.7-MAT2A [38], cloning of the ORF into a modified pBluescript containing a NdeI restriction site, EcoRI digestion of pBS(NdeI)-MAT2A and ligation of the ORF in the same site of pCMV-HA (Clontech, Mountain View, CA, USA); and iii) pHA-ALDOB and pHA-HPD that were prepared from total R. norvegicus liver RNA. The ORFs were amplified using the SuperscriptTM one-step RT-PCR kit (Invitrogen, Carlsbad, CA, USA), the primers and RT-PCR conditions described in Table 1. Cloning into pCMV-HA (Clontech) was carried out to obtain the corresponding HA-tagged proteins, whose linker sequences are listed in Table 2. The molecular weight of the tagged proteins was calculated using the ExPASy Compute pI/Mw tool (http://web.expasy.org/compute_pi/).
Table 1. ORFs of BHMT interaction targets, PCR programs and primers used for amplification.
| Protein code or name | Source or IMAGE clone | origin | Amplification primersa | Restriction sites | PCR program |
|---|---|---|---|---|---|
| A7VJC2 | 2822109 | human | 5’-cggaattcgaaatcgggctgaagcgact-3’ | EcoRI KpnI | 95°C 2 min (95°C 30s; 56° 1 min; 72°C 90s) x 30 72°C 10 min |
| 5’-ggggtaccgtgaagcccatggcaaatag-3’ | |||||
| Q9ESW0 | 3845478 | human | 5’-ggggtaccttcgcttgtgtccctctttct-3’ | KpnI NotI | 95°C 2 min (95°C 30s; 56° 1 min; 72°C 210s) x 30 72°C 10 min |
| 5’-atagtttagcggccgcctttggggagggtcagca-3’ | |||||
| O88902b | 6579163 | human | 5’-cggaattcggcgattcggcacgag-3’ | EcoRI XhoI | 95°C 2 min (95°C 30s; 56°C 60s; 72°C 3 min) x 30 72°C 10 min |
| 5’-cgtgcgctcgagcag-3’ | |||||
| 5’- ccgctcgagcgcacgcagt-3’ | XhoI XhoI | 95°C 2 min (95°C 30s; 56°C 60s; 72°C 3 min) x 30 72°C 10min |
|||
| 5’-tcgctcgagaggaccaggtaggcaaaacc-3’ | |||||
| P60711 | 6920838 | rat | 5’-cggaattcacaaccttcttgcagctcctc-3’ | EcoRI KpnI | 95°C 2 min (95°C 30s; 56° 1 min; 72°C 90s) x 30 72°C 10 min |
| 5’-ggggtaccaagggtgtaaaacgcagctc-3’ | |||||
| Q6DUV1 | 40028213 | human | 5’-ggggtaccccgaccatggtagtgttcaa-3’ | KpnI NotI | 95°C 2 min (95°C 30s; 55° 1 min; 72°C 150s) x 30 72°C 10 min |
| 5’-ataatttagcggccgccatcggcaaagtccaactg-3’ | |||||
| Q9JLS3 | 9020643 | human | 5’-cgagatctgccaggccccactctcagg-3’ | BglII NotI | 95°C 2 min (95°C 30s; 56° 1 min; 72°C 4 min) x 30 72°C 10 min |
| 5’-ataatttagcggccgcctggaagggctggagtcag-3’ | |||||
| Q56R17 | 4834709 | human | 5’-ggggtaccacgggggaaggagtcacc-3’ | KpnI NotI | 95°C 2 min (95°C 30s; 58° 1 min; 72°C 90s) x 30 72°C 10 min |
| 5’-atagtttagcggccgcgctgcattgtacctaacttcca-3’ | |||||
| P23514 | 5599357 | rat | 5’-ggggtaccgccatgaccgcagctgagaa-3’ | KpnI NotI | 95°C 2 min (95°C 30s; 56° 1 min; 72°C 210s) x 30 72°C 10 min |
| 5’-atagtttagcggccgcacactttcgaggaccgtttg-3’ | |||||
| P63018 | 7104230 | rat | 5’-cggaattcaagcctacacgcaagcaacc-3’ | EcoRI KpnI | 95°C 2 min (95°C 30s; 56° 1 min; 72°C 120s) x 30 72°C 10 min |
| 5’-ggggtaccgaacaatgctataccctctactttga-3’ | |||||
| P62961 | 7105037 | rat | 5’-ggggtaccacagtcaccatcaccgcaac-3’ | KpnI NotI | 95°C 2 min (95°C 30s; 54° 1 min; 72°C 1 min) x 30 72°C 10 min |
| 5’-atagtttagcggccgcgaccaaaccggatgatggta-3’ | |||||
| P13383 | 7109097 | rat | 5’-cggaattcccgccatcatggtgaaa-3’ | EcoRI NotI | 95°C 2 min (95°C 30s; 55° 1 min; 72°C 150s) x 30 72°C 10 min |
| 5’-ataatttagcggccgcctattcaaacttcgtcttctttcc-3’ | |||||
| P14659 | 7112083 | rat | 5’-cggaattcattggtcactccgaccagtca-3’ | EcoRI KpnI | 95°C 2 min (95°C 30s; 56° 1 min; 72°C 120s) x 30 72°C 10 min |
| 5’-ggggtaccaggtttacgcggactccag-3’ | |||||
| B1WC97 | 7114289 | rat | 5’-cggaattctactgcttgactttagttcttcagg-3’ | EcoRI KpnI | 95°C 2 min (95°C 30s; 56° 1 min; 72°C 1 min) x 30 72°C 10 min |
| 5’-ggggtaccgattcttgtttcccaggacaat-3’ | |||||
| B4F7A9 | 7114331 | rat | 5’-ggggtaccacagtttcggtccggattc-3’ | KpnI NotI | 95°C 2 min (95°C 30s; 56° 1 min; 72°C 90s) x 30 72°C 10 min |
| 5’-atagtttagcggccgcgaggaaccgcaacagacc-3’ | |||||
| P63159 | 7128547 | rat | 5’-cggaattctcgcggaggaaaatcaactaa-3’ | EcoRI KpnI | 95°C 2 min (95°C 30s; 56° 1 min; 72°C 1 min) x 30 72°C 10 min |
| 5’-ggggtaccgggggttaaatgctttatagacaa-3’ | |||||
| Q5XIQ3 | 7134100 | rat | 5’-cggaattcaagcagtttgcaggctctcc-3’ | EcoRI KpnI | 95°C 2 min (95°C 30s; 56° 1 min; 72°C 1 min) x 30 72°C 10 min |
| 5’-ggggtaccgagggcagctttgggttc-3’ | |||||
| P27791 | 7314651 | rat | 5’-ggggtacccagccgcgtcgcagctc-3’ | KpnI NotI | 95°C 2 min (95°C 30s; 62° 1 min; 72°C 90s) x 30 72°C 10 min |
| 5’-atagtttagcggccgcagaaaacccatggggcaca-3’ | |||||
| P04256 | 7374689 | rat | 5’-cggaattcaacgctctcatcatcctaccg-3’ | EcoRI KpnI | 95°C 2 min (95°C 30s; 56° 1 min; 72°C 1 min) x 30 72°C 10 min |
| 5’-ggggtaccaagctttgtttcctggctgt-3’ | |||||
| Q4V8C1 | 7456915 | rat | 5’-ggggtaccggacttctcaccccaaacct-3’ | KpnI NotI | 95°C 2 min (95°C 30s; 58° 1 min; 72°C 90s) x 30 72°C 10 min |
| 5’-ataatttagcggccgcgcaagttgagaccttgcac-3’ | |||||
| ALDOB | Liver RNA | rat | 5’-cgaattccgatggctcaccgatttccag-3’ | EcoRI XhoI | 50°C 30 min 94°C 2 min (94°C 15s; 58°C 30s; 70°C 75s) x 36 72°C 10 min |
| 5’-ccgctcgagggtgacggtatctagtagg-3’ | |||||
| HPD | Liver RNA | rat | 5’-cgaattccgatgacaacctacagcaac-3’ | EcoRI XhoI | 50°C 30 min 94°C 2 min (94°C 15s; 40°C 30s; 70°C 75s) x 36 72°C 10 min |
| 5’-ccgctcgagttacattccagacctcac-3’ |
arestriction sites appear underlined
bamplification of two fragments containing XhoI restriction sites was done independently and the whole ORF obtained upon ligation
Table 2. Linkers of the HA-tagged proteins used in this study.
| Protein code or name | No linker residues | Amino acid sequence of the linker | Tagged protein size (kDa)a |
|---|---|---|---|
| A7VJC2 | 18 | LMAMEARIRNRAEATESA | 40.69 |
| Q9ESW0 | 38 | LMAMEARIRSTEISRGTFACVPLSSVALESRRAAPSLD | 42.77 |
| O88902 | 21 | LMAMEARIRRFGTRGRRVPAA | 167.07 |
| P60711 | 26 | LMAMEARIHNLLAAPPSPVHTRHQFA | 45.84 |
| Q6DUV1 | 19 | LMAMEARIRSTEISRGTPT | 86.89 |
| Q9JLS3 | 25 | LMAMEARIRSTEICQAPLSGPPGAT | 142.55 |
| Q56R17 | 26 | LMAMEARIRSTEISRGTTGEGVTGPA | 61.81 |
| P23514 | 18 | LMAMEARIRSTEISRGTA | 110.20 |
| P63018 | 15 | LMAMEARIQAYTQAT | 73.77 |
| P62961 | 24 | LMAMEARIRSTEISRGTTVTITAT | 39.54 |
| P13383 | 11 | LMAMEARIPAI | 79.56 |
| P14659 | 16 | LMAMEARIHWSLRPVR | 72.80 |
| B1WC97 | 34 | LMAMEARILLLDFSSSGLRPPAYPKPRPPPRARG | 38.05 |
| B4F7A9 | 31 | LMAMEARIRSTEISRGTTVSVRIPGIPVPPA | 45.70 |
| P63159 | 16 | LMAMEARILAEENQLN | 27.94 |
| Q5XIQ3 | 25 | LMAMEARIQAVCRLSQQRGLGLGPT | 36.52 |
| P27791 | 33 | LMAMEARIRSTEISRGTQPRRSSGTGPGRDAAA | 45.30 |
| P04256 | 16 | LMAMEARIQRSHHPTV | 37.29 |
| Q4V8C1 | 26 | LMAMEARIRSTEISRGTGLLTPNLPL | 46.95 |
| MATα1 | 9 | LMAMEAEFH | 45.86 |
| MATα2 | 13 | LMAMEARIPLWHH | 46.46 |
| HPD | 9 | LMAMEARIP | 47.34 |
| ALDOB | 9 | LMAMEARIP | 41.75 |
aCalculated using ExPASy tools
Plasmids for YTH were prepared from pBS-BHMT that contains the ORF of rat Bhmt [25]. For this purpose, pBS-BHMT was NdeI/BamHI digested and the ORF cloned into the same sites on pGBKT7 (Clontech) to render pGBKT7-BHMT. Cloning into pACT2 (Clontech) required site-directed mutagenesis of pBS-BHMT to create a NcoI restriction site using the QuikChange method and the primers 5’-GATATCGAATTCCATGGCACCGATTGCC-3’ (sense; NcoI site underlined) and its complementary. The mutated plasmid was NcoI/BamHI digested and cloned into pACT2 to obtain pACT2-BHMT. Sequences were verified by automatic sequencing at the Genomic Service of the Instituto de Investigaciones Biomédicas “Alberto Sols” (IIBM).
Production of intein and intein-BHMT
Competent E. coli BL21(DE3) cells were transformed with either pTYB12 or pTYB12-BHMT and grown in LB plates containing 50 μg/ml ampicillin (LBA). A single colony was used to inoculate 100 ml of LBA medium that was grown overnight at 37°C. This culture was used to inoculate 3 liters of LBA medium that were further incubated at 37°C to reach A600~0.9. At this point, expression of the proteins was induced by addition of 0.5 mM IPTG overnight at 22°C. Cells were harvested by centrifugation and the pellet was divided in aliquots (1 g) for storage at -80°C.
Bacteria overexpressing intein (6 g) or intein-BHMT (2 g) were lysed on ice in 20 mM Tris/HCl pH 8, 500 mM NaCl, 0.1 mM EDTA, 0.1% Triton X-100 (buffer A) containing protease inhibitors (2 μg/ml aprotinin, 1 μg/ml pepstatin A, 2.5 μg/ml antipain, 0.5 μg/ml leupeptin, 0.1 mM PMSF, 0.1 mM benzamidine) in a Branson 250 sonifier (30 cycles on/off 30s; out power level 8). Lysates were cleared by centrifugation at 13000 xg for 30 min at 4°C, the supernatants collected and used to load chitin columns (New England Biolabs, Ipswich, MA, USA).
Preparation of liver cytosolic samples
Male R. norvegicus Wistar (~250g; N = 10) received standard diets ad libitum and were euthanized by CO2 asphyxiation. The livers were immediately extracted, washed with PBS and frozen using liquid nitrogen for storage at -80°C. Cytosolic fractions were prepared immediately before use by homogenization of liver samples (10 g) in 20 ml of 10 mM sodium phosphate buffer pH 7.4, 5 mM EDTA, 0.1 mM EGTA (buffer B) containing protease inhibitors (2 μg/ml aprotinin, 1 μg/ml pepstatin A, 2.5 μg/ml antipain, 0.5 μg/ml leupeptin, 0.1 mM PMSF, 5 mM benzamidine and 10 μg/ml soybean trypsin inhibitor). Homogenates were centrifuged at 15000 xg 20 min at 4°C and the supernatant centrifuged for 1h at 105000 xg and 4°C to obtain the cytosols. The experiments included in this study were approved by the CSIC Bioethics Committee and carried out in full accordance with Spanish regulations (RD 53/2013) and the European Community guidelines (2010/63/EU) for the use of laboratory animals.
Preparation of columns and isolation of protein interaction targets
Three columns containing chitin beads (New England Biolabs) were prepared for each of the nine independent experiments carried out. Column 1 (4 ml) was equilibrated with buffer B, whereas columns 2 (4 ml) and 3 (1 ml) were equilibrated in buffer A and loaded with intein and intein-BHMT lysates, respectively. After binding of the baits, columns 2 and 3 were also equilibrated in buffer B before loading of rat liver protein samples. All columns were run at 10 ml/h and 4°C.
Column 1 was loaded with liver cytosol and the flowthrough collected and loaded into column 2. The flowthrough of this second column was also collected and loaded into column 3. The three columns were then extensively washed with buffer B until A280 ~0. At this point elution of the proteins bound was carried out with a gradient from 0–500 mM NaCl (40 column volumes). Fractions (5 ml for columns 1 and 2; 1 ml for column 3) were collected during all the process and A280 recorded. Columns 2 and 3 were later incubated with 3 column volumes of buffer B containing 30 mM 2-mercaptoethanol for 48 h at 23°C for intein excision, allowing recovery of strong interactors together with BHMT. Samples (50 μl) of the loaded cytosols and flowthroughs, as well as from the eluted peaks were separated on 10% SDS-PAGE gels, which were later stained with Coomassie Blue. Protein peaks were washed extensively with 20 mM ammonium acetate pH 7.7 using PM-10 membranes (AMICON Inc. Beverly, MA, USA). The concentrated protein pools were then lyophilized, reconstituted with water (50 μl) and divided in aliquots to measure protein concentration and to prepare for SDS-PAGE (10–30 μg/lane) by addition of Laemmli buffer.
Mass spectrometry detection of protein interaction targets
Proteins were in-gel digested using a previously described protocol [39]. Briefly, identical amounts of each protein sample were suspended in sample buffer and loaded in 2.8-cm-wide wells of an SDS-PAGE gel. The run was stopped as the front entered 3 mm into the resolving gel. The protein band was visualized by Coomassie Blue staining, excised, and digested overnight at 37°C with 60 ng/l trypsin (Promega, Madison, WI, USA; Cat. No. V5111) at a 5:1 (w/w) protein:trypsin ratio in 50 mM ammonium bicarbonate pH 8.8, containing 10% (v/v) acetonitrile and 0.01% (w/v) 5-cyclohexyl-1-pentyl-D-maltoside (Fluka; Cat. No. 96193). The supernatant was recovered and the gel pieces incubated with 12 mM ammonium bicarbonate pH 8.8 for 1 hour. Both supernatants were combined and 25% (v/v) trifluoroacetic acid (Merck, Darmstadt, Germany; Cat. No. 808260) added until pH 3. Peptides were finally desalted using OMIX tips (Varian Inc., Walnut Creek, CA, USA; Cat. No. A57003100) following manufacturer’s instructions and dried down. Isolated peptides were analyzed by LC-MS/MS using a Surveyor LC system coupled to a linear ion trap mass LTQ spectrometer (Thermo Fisher) as previously described [40]. The LTQ was operated in a data-dependent MS/MS mode using the 15 most intense precursors detected in a survey scan from 400 to 1,600 m/z [40, 41]. Number of microscans, normalized collision energy, and dynamic exclusion parameters were as previously described [40, 41]. Protein identification was carried out as described previously using the SEQUEST algorithm (Bioworks 3.2 package, Thermo Finnigan) [40, 42]. The MS/MS raw files were searched against the Rat Uniprot database (UniProt release 06/2009) supplemented with porcine trypsin and human keratin. The same collections of MS/MS spectra were also searched against inverted databases constructed from the same target databases. SEQUEST results were analyzed using the probability ratio method [43], and false discovery rates (FDR) were calculated using the refined method [44]. Peptide and scan counting was performed assuming as positive events those with an FDR lower than 5%.
Yeast two-hybrid
Screening for BHMT interactions was carried out with a rat liver Matchmaker cDNA library (RL4004AH; Clontech) and the AH109 yeast strain. Transformation was performed with EasyComp solutions (Invitrogen) and selection achieved using low (-Leu/-Trp; LW) and high stringency (-Ade/-His/-Leu/-Trp; -AHLW) SC media for growth of the resulting transformants. Screening of 1.5 x 10⁷ clones was carried out and 52 putative interactions detected, from which only 38 were confirmed in–AHLW SC medium. DNAs of the positive clones were isolated and used to transform E. coli DH5α competent cells. Plasmids were purified with Qiagen plasmid purification kits (Qiagen, Hilden, Germany) and sequenced at the IIBM Genomic Service. Fourteen biologically relevant preys were found, the rest corresponding to BHMT-BHMT interactions; this large background was expected from the homo-oligomeric association state of BHMT and guarantees native folding of the fusion protein used for screening. Verification of positive interactions was carried out by cotransformation of plasmids harboring the Bhmt ORF and putative preys and growth on–AHLW SC media.
Transient transfections and immunoprecipitation procedures
Commercial COS-7 (monkey kidney), N2a (mouse neuroblastoma) or H35 (rat hepatoma) cell lines were obtained from the IIBM collection and originally purchased from the ATCC. Cells were grown in DMEM (Gibco, Carlsbad, CA, USA) supplemented with 10% (v/v) fetal bovine serum and 2 mM glutamine. Cells (2x10⁶) were transfected using lipofectamine (Invitrogen) for 6 hours using pFLAG-BHMT, pHA-prey plasmids or cotransfected with pFLAG-BHMT/pHA-prey plasmids (10 μg) at 1:1 ratios. Total lysates were prepared 48 hours after transfection in 200 μl of 50 mM Tris/HCl pH 7.5, 150 mM NaCl, 1 mM EDTA, 1% (v/v) NP-40, 1 mM DTT containing 1 mM PMSF, 1 mM benzamidine, 2 μg/ml aprotinin, 1 μg/ml pepstatin A, 0.5 μg/ml leupeptin, 2.5 μg/ml antipain (immunoprecipitation buffer) by incubation on ice for 10 min, followed by six passages through a 25G syringe. Input samples were taken at this step, whereas the remaining sample was centrifuged for 15 min at 10000 xg and 4°C.
Cellular fractions (150 μl total lysates or 100 μl cytosolic fractions) were incubated o/n at 4ºC with mouse monoclonal anti-FLAG M2 Agarose (50 μl; Sigma, St. Louis, MI, USA; Cat. No. A2220) for anti-FLAG immunoprecipitation. On the other hand, the cellular fractions were precleared using anti-mouse IgG (2 μg) for 2 hours at 4°C before anti-HA immunoprecipitation as previously described [45]. Samples were then centrifuged for 15 min at 10000 xg before overnight incubation with mouse monoclonal anti-HA (2 μg, Covance; Cat. No. MMS-101R) coupled to protein A Sepharose CL-4B (GE Healthcare, Uppsala, Sweden) at 4°C. The beads were washed 3 times with immunoprecipitation buffer and later boiled in Laemmli sample buffer (40 μl) containing 100 mM DTT for 10 min. Following centrifugation for 5 min at 10000 xg, the supernatants were loaded on SDS-PAGE gels and proteins were electrotransferred to nitrocellulose membranes for immunoblotting.
Immunoblotting
Membranes were incubated with mouse monoclonal anti-FLAG M2 (5 μg/ml, Sigma; Cat. No. F3165), mouse monoclonal anti-HA (1:1000 v/v, Covance; Cat. No. MMS-101R) or rabbit polyclonal anti-BHMT (1:20000 v/v) [25] as required. To avoid hindrance with mouse immunoglobulin bands after anti-FLAG or anti-HA immunoprecipitation, mouse TrueBlot ULTRA (1:1000 v/v, eBioscience; Cat. No. 18–8817) was used. Proteins were visualized using Western Lightning™ chemiluminescence reagent (Perkin Elmer, Waltham, MA, USA). The images were scanned and quantification carried out using ImageJ software.
Determination of protein concentration
The protein concentration of the samples was measured using the Bio-Rad protein assay kit and bovine serum albumin as the standard.
Protein-protein interaction network and statistical analysis
The list of BHMT-protein interactors obtained by AP-MS and YTH was analyzed using STRING (https://string-db.org/) and Bioprofiling (http://www.bioprofiling.de) tools for the identification of protein-protein interaction networks [46–48]. Student’s t-test for unpaired samples was applied for statistical analysis using GraphPad Prism v. 5.0 (GraphPad Software, San Diego, CA, USA). Data are shown as the mean ± SEM and differences were considered significant when p≤0.05.
Results
The search for BHMT interaction targets was performed initially by AP-MS using liver cytosols of Wistar rats. Elimination of unspecific interactors was carried out by sequential passages through control (beads only) and intein columns, before loading onto intein-BHMT columns (Fig 1). Proteins bound to each column were then eluted using a salt gradient and the A280 registered. For the three columns, the absorption profiles showed a single peak between 50–100 mM NaCl that was collected (Fig 2). Elution of stronger interactors required excision of the intein-BHMT tag by incubation with a reducing agent. In this case, BHMT (45 kDa) was recovered together with its strong interacting partners as observed in the corresponding gels (Fig 2E); again, the pools were collected. Identification of the proteins bound in each case was carried out after trypsinization by mass spectrometry. First, comparison between datasets corresponding to control and intein columns versus datasets of the intein-BHMT column was performed for proteins eluting with the salt gradient. Sixty-nine potential BHMT interaction targets were identified, which showed the same binding behavior in independent experiments (Table 3 and S1 Table). The same analysis was carried out for stronger interactors eluting upon excision of the intein tag and 59 putative interaction targets were identified in several experiments (Table 4 and S1 Table). Nevertheless, some targets of potential interest that were found only in one experiment were considered also for further validation. Among them, proteins of the methionine cycle, MATα1, MATα2 and BHMT2.
Fig 1. Schematic representation of the affinity purification/mass spectrometry procedure.
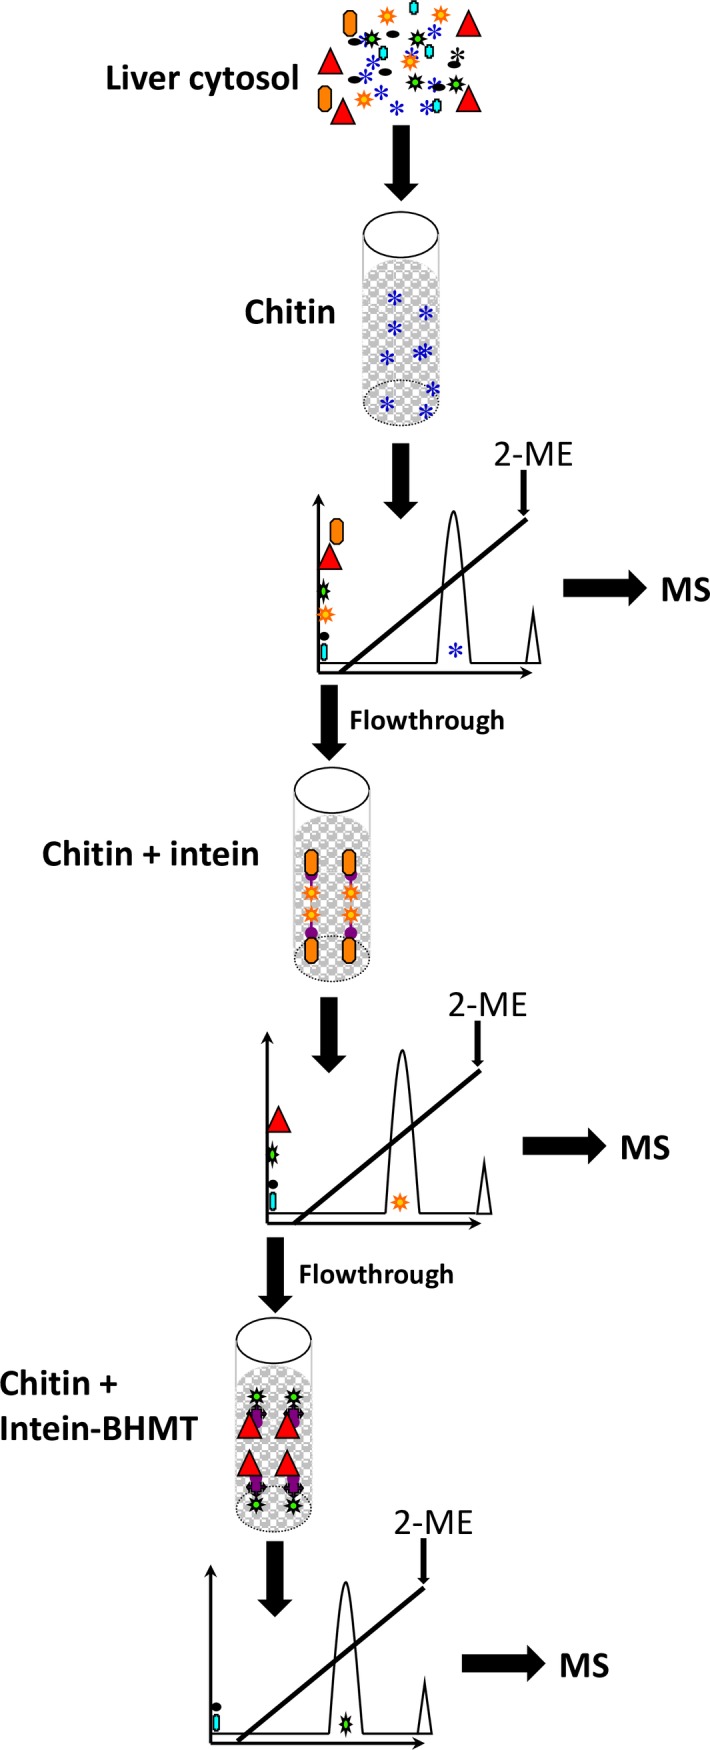
Three chitin columns were used: column 1 contained only the beads (4 ml); column 2 contained intein bound to the beads (4 ml); and column 3 has intein-BHMT bound to the beads (1 ml). Liver cytosol was loaded on column 1, the flowthrough recovered and loaded on column 2 and the flowthrough of this last column loaded on column 3. Elution of the proteins bound to each of the columns was first performed with a salt gradient and finally, by incubation with 2-mercaptoethanol. A280 was measured during all the procedure to identify the eluted protein peaks that were collected and digested with trypsin for mass spectrometry identification of the interaction targets.
Fig 2. Elution profiles from control, intein and intein-BHMT loaded chitin columns.

The figure shows representative A280 elution profiles from control (beads only; 4 ml), intein (4 ml) and intein-BHMT (1 ml) loaded chitin columns, as well as representative Coomassie Blue stained SDS-PAGE gels of liver cytosol, flowthroughs loaded on these columns and samples of the eluted peaks. (A) Control columns were loaded with liver cytosol and eluted with a NaCl gradient. (B) The flowthrough from the control column was loaded onto the intein column and elution performed with the same salt gradient. (C) The flowthrough of the intein column was loaded onto the intein-BHMT column and elution carried out with a NaCl gradient. (D) SDS-PAGE of the protein fractions loaded onto the columns: liver cytosol (2 μl); flowthrough of the chitin column (2 μl); flowthrough of the intein column (2 μl); and flowthrough of the intein BHMT column (2 μl). (E) Eluted proteins using salt gradients and 2-mercaptoethanol (2-ME) excision were collected and analyzed by SDS-PAGE: chitin peak (40 μl); intein peak (40 μl); and intein-BHMT peak (40 μl). Molecular weight standards are shown on the right side of each gel.
Table 3. Candidates for BHMT interaction identified by mass spectrometry after affinity purification on chitin columns eluted with a salt gradient.
| Uniprot code | Protein |
|---|---|
| P13444a | S-adenosylmethionine synthase isoform type-1, MATα1 |
| P18298 | S-adenosylmethionine synthase isoform type-2, MATα2 |
| Q5U2R0 | Methionine adenosyltransferase 2 subunit beta, MATβb |
| Q6P688 | S-adenosylmethionine synthase, MATα2b |
| Q63432 | RAT Rat protein kinase C-family relatedb |
| Q6DUV1 | RAT Protein kinase C epsilon typeb |
| B4F7A9 | Casein kinase 2 α2 |
| Q9JIH7 | Serine/threonine-protein kinase WNK1 |
| O88902 | Tyrosine-protein phosphatase non-receptor type 23, PTPN23 |
| Q5XIQ3 | CXXC-type zinc finger protein 5, CXXC5 |
| P60711 | ACTB Actin, cytoplasmic 1 (Beta-actin). |
| Q4V8C1 | RGD1306462 protein |
| P14659 | HSP72 Heat shock-related 70 kDa protein 2 |
| P63018 | HSP7C Heat shock cognate 71 kDa protein |
| Q56R17 | Importin subunit alpha, Karyopherin alpha 4b |
| B1WC97 | BTB/POZ domain-containing protein KCTD7 |
| P23514 | Coatomer subunit beta |
| A7VJC2 | Heterogeneous nuclear ribonucleoproteins A2/B1 |
| P04256 | Heterogeneous nuclear ribonucleoprotein A1 |
| P63159 | High mobility group protein B1 (HMGB-1) |
| P13383 | Nucleolin |
| P62961 | Nuclease-sensitive element-binding protein 1 |
| Q9ESW0 | DNA damage-binding protein 1 |
| P52925 | High mobility group protein 2 (HMGB-2) |
| P17132 | Heterogeneous nuclear ribonucleoprotein D0 |
| Q6URK4 | Heterogeneous nuclear ribonucleoprotein A3 |
| Q8VHV7 | Heterogeneous nuclear ribonucleoprotein H |
| Q66HM7 | Sjogren syndrome antigen B, SSB |
| P13084 | Nucleophosmin |
| P52590 | Nuclear pore complex protein Nup107b |
| P43138 | DNA-(apurinic or apyrimidinic site) lyase, APEX1 |
| Q63396 | Activated RNA polymerase II transcriptional coactivator p15 |
| Q6AY09 | Heterogeneous nuclear ribonucleoprotein H2 |
| B0BN99 | High mobility group box 3, Hmgb3 |
| B0BNC9 | Quinone oxidoreductase-like protein 2 |
| O35796 | C1QBP Complement component 1 Q subcomponent-binding protein, mitochondrial |
| Q6P6R6 | Transglutaminase 2, C polypeptideb |
| Q9WVJ6 | Tissue-type transglutaminaseb |
| P17764 | Acetyl-CoA acetyltransferase, mitochondrial |
| P28042 | SSBP1 Single-stranded DNA-binding protein, mitochondrial |
| B0BND0 | ENPP6 Ectonucleotide pyrophosphatase/phosphodiesterase family member 6 |
| Q672K1 | NADPH oxidase 3b |
| P35281 | RAB10 Ras-related protein Rab-10b |
| Q7TPK6 | Serine/threonine-protein kinase WNK4b |
| Q9Z286 | Adenylate cyclase type 10b |
| Q6IMF3 | Keratin, type II cytoskeletal 1 |
| Q5EAP4 | Guanine nucleotide binding protein, alpha 14 |
| P04785 | Protein disulfide-isomeraseb |
| P06761 | 78 kDa glucose-regulated proteinb |
| P13107 | Cytochrome P450 2B3b |
| Q6LCX1 | Cytochrome P450 2B3b |
| P07896 | ECHP Peroxisomal bifunctional enzyme |
| Q9Z2M4 | DECR2 Peroxisomal 2,4-dienoyl-CoA reductase |
| Q6AYD3 | Proliferation-associated protein 2G4 |
| B2RYX0 | Naca protein |
| A1A5S1 | Pre-mRNA splicing factor 6 |
| Q6WAY2 | Phospholipid phosphatase-related protein type 1 |
| P47245 | Nardilysin |
| Q6VV72 | Eukaryotic translation initiation factor 1A |
| B1H281 | LOC499754 protein |
| B5DFF5 | Triobp protein |
| O88311 | AlF-C1 |
| B0LT89 | Serine/threonine-protein kinase 24b |
| P12749 | 60S ribosomal protein L26 |
| P62864 | 40S ribosomal protein S30 (Fau) |
| Q07205 | Eukaryotic translation initiation factor 5 |
| B2RZB7 | Small nuclear ribonucleoprotein D1 |
| B5DEN5 | Eukaryotic translation elongation factor 1 beta 2 |
| Q9QYQ9 | Homeobox protein |
aIn bold, proteins selected for validation by immunoprecipitation.
bProteins that are found in only one experiment, but are related to BHMT protein function, subcellular localization or previously described as BHMT protein-protein interaction targets.
Table 4. Candidates for BHMT interaction identified by mass spectrometry after affinity purification on chitin columns eluted with 2-mercaptoethanol.
| Uniprot code | Protein |
|---|---|
| Q9JLS3a | Serine/threonine-protein kinase TAO2 |
| P27791a | cAMP-dependent protein kinase catalytic subunit alphab |
| O88902a | Tyrosine-protein phosphatase non-receptor type 23 |
| P51577 | P2X purinoceptor 4 |
| Q62969 | Prostacyclin synthase |
| A1A5S1 | Pre-mRNA splicing factor 6 |
| Q6WAY2 | Phospholipid phosphatase-related protein type 1 |
| Q5BK24 | Uncharacterized protein C8orf76 homolog |
| Q3T1I3 | Usher syndrome type-1C protein-binding protein 1 |
| B2GV26 | LOC304239 protein |
| Q5BJT0 | Arginine and glutamate-rich protein 1b |
| Q5XIC3 | Hsp90 co-chaperone Cdc37-like 1b |
| A2IA98 | 40S ribosomal protein S3b |
| O08875 | Serine/threonine-protein kinase DCLK1b |
| P52796 | Ephrin-B1b |
| P97531 | Cdc42-interacting protein 4b |
| Q00939 | Forkhead box protein G1b |
| Q5SGD7 | Connector enhancer of kinase suppressor of ras 3b |
| B2GUW9 | RGD1562161 proteinb |
| B5DFC1 | Vps35 proteinb |
| Q4V8M7 | LOC304239 proteinb |
| Q5BJR5 | Microspherule protein 1b |
| Q5U2M4 | DNA ligaseb |
| Q6P7B6 | Ephrin B1b |
| Q8CH93 | Hyaluronan synthase 1b |
| Q8QZV1 | High affinity cGMP-specific 3’,5’-cyclic phosphodiesterase 9Ab |
| Q9QYU6 | Zinc finger proteinb |
| Q80W87 | Roundabout homolog 4b |
| A0JPQ3 | Microtubule associated scaffold protein 2b |
| O35762 | Homeobox protein Nkx-6.1b |
| Q07936 | Annexin A2b |
| Q5M821 | Protein phosphatase 1Hb |
| Q5PQK1 | Septin-10b |
| Q6AXN8 | Zinc finger and SCAN domain containing 21b |
| Q8VHU4 | Elongator complex protein 1b |
| Q923J6 | Dynein heavy chain 12, axonemalb |
| Q9EQH1 | GRB2-associated-binding protein 2b |
| O70199 | UDP-glucose 6-dehydrogenaseb |
| P05539 | Collagen alpha-1(II) chainb |
| P23457 | 3-alpha-hydroxysteroid dehydrogenaseb |
| P32821 | Trypsin V-Ab |
| P60669 | Pleckstrin homology domain-containing family A member 4b |
| P70673 | ATP-sensitive inward rectifier potassium channel 11b |
| Q09167 | Serine/arginine-rich splicing factor 5b |
| Q4V8G7 | Centromere protein Ub |
| Q5M7W4 | Transmembrane channel-like protein 5b |
| Q5M883 | Chloride intracellular channel protein 2b |
| Q62770 | Protein unc-13 homolog Cb |
| Q63100 | Cytoplasmic dynein 1 intermediate chain 1b |
| Q6IG00 | Keratin, type II cytoskeletal 4b |
| Q8K3Y6 | Zinc finger CCCH-type antiviral protein 1b |
| Q9R0L4 | Cullin-associated NEDD8-dissociated protein 2b |
| O35816 | Sodium myo-inositol transporterb |
| Q3B8P7 | RCG58555, isoform CRA_ab |
| Q5I0E7 | Transmembrane emp24 domain-containing protein 9b |
| Q5RK26 | Polr3a proteinb |
| Q7TPK7 | Ac2-048b |
| Q80WM6 | 2',5'-oligoisoadenylate synthetase-dependent ribonuclease Lb |
| Q68FT5a | BHMT2 S-methylmethionine homocysteine S-methyltransferase b |
aIn bold, proteins selected for validation by immunoprecipitation.
bProteins found in only one experiment, but that are related to BHMT protein function or subcellular localization.
In parallel, YTH screening of a rat liver cDNA library was performed for the identification of additional interaction targets using the full-length ORF of rat Bhmt as bait. This screening rendered 14 putative preys that grew in the–AHLW high stringency SC media (Table 5). Interestingly, seven of these putative preys were previously identified by AP-MS, namely S-methylmethionine homocysteine methyltransferase (BHMT2), transthyretin, 4-hydroxyphenylpyruvic acid dioxygenase (HPD), glutathione-S-transferase alpha type 2, alpha-2u globulin PGCL1/Major urinary protein, ornithine transcarbamylase and aldolase b protein (ALDOB). Among them, BHMT2 binds strongly to intein and intein-BHMT columns, but more peptides were recovered from peaks eluting from intein-BHMT (34 scans, 3 peptides) than from intein columns (18 scans, 2 peptides). Thus, the relevance of the BHMT-BHMT2 interaction was confirmed. Regarding the 6 remaining preys identified in the yeast two-hybrid screening and also found by AP-MS, all of them showed unspecific binding to chitin or intein columns and no peptide was found on intein-BHMT eluents, therefore their interaction with BHMT could not be validated.
Table 5. Hepatic BHMT interaction targets identified by yeast two-hybrid.
| Protein code | Protein | gene | Clones found |
|---|---|---|---|
| P62982 | Ubiquitin-40S ribosomal protein S27a | Rps27a | 1 |
| P02767 | Transthyretin precursor (Prealbumin) | Ttr | 1 |
| P09367 | serine dehydratase/Sds protein | Sds | 2 |
| P20673 | argininosuccinate lyase | Asl | 1 |
| P05503 | cytochrome c oxidase subunit I | Mtco1 | 2 |
| P32755 | 4-hydroxyphenylpyruvic acid dioxygenase | Hpd | 1 |
| P04903 | Glutathione-S-transferase, alpha type 2 | Gsta2 | 1 |
| P02761 | alpha-2u globulin PGCL1/Major urinary protein | - | 1 |
| - | Similar to Hypothetical protein BC014729 | - | 1 |
| Q6RJR6 | reticulon 3 protein isoform b | Rtn3 | 1 |
| P00481 | ornithine transcarbamylase | Otc | 2 |
| P00884 | Aldolase b protein | Aldob | 1 |
| Q68FT5 | hypothetical protein LOC365972/S-methylmethionine homocysteine methyltransferase 2 | Bhmt2 | 3 |
| P02793 | ferritin light chain subunit | Ftl1 | 1 |
Twenty additional proteins were selected from AP-MS data, together with MATα1, MATα2, HPD and ALDOB for further validation of their interaction with BHMT by coimmunoprecipitation. For this purpose, the ORFs of interest were cloned into pCMV4-HA for expression and the size of the tagged proteins verified by immunoblotting using anti-HA (Fig 3). Whenever possible, the ORFs corresponded to rat proteins, but there were cases in which only the human counterpart was available. This fact was not expected to exert a major drawback given the high identity level between rat and human BHMT sequences (~93%). Nevertheless, several proteins had to be excluded from further validation, as these HA-tagged preys did not achieve detectable expression levels in any of the cell lines used, or the size of the protein obtained differed notably from theoretical calculations. Therefore, only fourteen HA-tagged preys met the criteria for their use in coimmunoprecipitation experiments. Cotransfection with pFLAG-BHMT (47 kDa) and the pHA-prey plasmids of interest was then performed using different cell lines to ensure coexpression of both bait and prey. In several cases, expression and/or coexpression were not achieved, and hence validation of these interactions was precluded. Moreover, differences in the expression levels attained in lysates of cotransfectants and controls bearing a single plasmid were commonly observed independently of the pFLAG-BHMT/pHA-prey ratio used for transfection. These differences were taken into account for the analysis of immunoprecipitation results.
Fig 3. Expression of HA-tagged candidates for interaction with BHMT.

Several proteins identified as potential targets for BHMT interaction during yeast two-hybrid and AP-MS screenings were cloned into pCMV-HA and expressed in several cell lines to verify their molecular size. The figure shows representative images of anti-HA immunoblots of those HA-tagged proteins exhibiting the correct size upon expression in Cos7 cells; the molecular weight of the standards is indicated on the side of each blot. HPD (P32755), 4-hydroxyphenylpyruvic acid dioxygenase; MATα1, methionine adenosyltransferase α1; Q4V8C1, RGD1306462 protein; P27791, cAMP-dependent protein kinase catalytic subunit alpha; P60711, actin cytoplasmic 1; B4F7A9, casein kinase 2 alpha2; P63159, high mobility group protein B1; P04256, heterogeneous nuclear ribonucleoprotein A1; MATα2, methionine adenosyltransferase α2; P63018, heat shock cognate 71 kDa protein; P62961, nuclease-sensitive element-binding protein 1; P14659, heat shock-related 70 kDa protein 2; ALDOB (P00884), aldolase B; Q5XIQ3, CXXC-type zinc finger protein 5.
First, we concentrated on preys of the methionine cycle that were found by AP-MS, specifically the catalytic subunits of methionine adenosyltransferases (MATs), which are directly linked to BHMT function as consumers of methionine. Anti-FLAG immunoprecipitation from cotransfected cells allowed recovery of HA-MATα1, whereas a nonspecific background was found in immunoprecipitates of control cells overexpressing only HA-MATα1 (Fig 4). Changes in the composition of the buffers (e.g. salt concentration, detergents) did not reduce this background. Quantification of the HA-signals in the inputs and immunoprecipitates was carried out and their ratio (IP/input) calculated to correct for differences in expression between samples. This ratio was also significantly higher for coimmunoprecipitates, thus confirming the BHMT/MATα1 interaction. When the same procedure was used with HA-MATα2, coimmunoprecipitation with FLAG-BHMT was also detected, but a higher background was consistently observed, which is favored by the higher HA-MATα2 expression levels obtained in control cells (Fig 5). Nevertheless, the difference between the calculated IP/input ratios was significant, also validating the BHMT/MATα2 interaction.
Fig 4. Validation of MATα1 as a BHMT interaction target.

Cos7 cells were transfected with pFLAG-BHMT, pHA-MATα1 or cotransfected with both plasmids at a 1:1 (w/w) ratio. Lysates were obtained 48 hours posttransfection and immediately processed by anti-FLAG immunoprecipitation. Samples of the inputs (25 μl) and immunoprecipitates (40 μl) were analyzed by western blotting using specific antibodies and mouse TrueBlot. (A) Representative anti-HA immunoblots from a single immunoprecipitation experiment (N = 10). (B) Representative anti-FLAG results from a single immunoprecipitation experiment (N = 10). The size of the protein standards is indicated on the left side of each image. (C) Anti-HA signals were quantified using ImageJ and the immunoprecipitate/input ratio (mean ± SEM) for all the experiments calculated (N = 10) to correct for differences in expression between control bearing only pHA-MATα1 and cotransfectants. Statistical analysis of the data was performed by Student’s t-test using GraphPad Prism; *p≤0.05.
Fig 5. Confirmation of MATα2 and BHMT interaction.

Cos7 cells were transfected with pFLAG-BHMT, pHA-MATα2 or cotransfected with both plasmids at a 1:1 (w/w) ratio. Lysates were obtained 48 hours posttransfection and immediately processed by anti-FLAG immunoprecipitation. Input (25 μl) and immunoprecipitate samples (40 μl) were analyzed by western blotting using specific antibodies and mouse TrueBlot. (A) Representative anti-HA results from a single immunoprecipitation experiment (N = 8). (B) Representative anti-FLAG immunoblot from a single immunoprecipitation experiment (N = 8). The size of the protein standards is indicated on the left side of each image. (C) Anti-HA signals were quantified using ImageJ and the immunoprecipitate/input ratio (mean ± SEM) for all the experiments calculated (N = 8) to correct for differences in expression between control bearing only pHA-MATα2 and cotransfectants. Statistical analysis of the data was performed by Student’s t-test using GraphPad Prism; *p≤0.05.
Next, verification of the putative interaction between FLAG-BHMT and HA-tagged targets actin B (ACTB; P60711), nuclease-sensitive element-binding protein 1 (Ybx1; P62961), HMGB1 (P63159) and cAMP-dependent protein kinase catalytic subunit alpha (Prkaca; P27791) was carried out. Again, strong differences in expression levels were found between cotransfectants and controls carrying a single plasmid. Anti-FLAG and anti-HA immunoprecipitations were performed to analyze the putative interaction with HA-actin B due to the existence of unspecific signals from the anti-FLAG antibody. Nonspecific HA-actin B binding to FLAG-Sepharose reached similar levels than that detected in coimmunoprecipitates and no significant differences were found between the calculated IP/input ratios (Fig 6). Therefore, the BHMT/actin B interaction could not be confirmed. Similarly, coimmunoprecipitation of BHMT and Ybx1 was detected, but the high unspecific binding of Ybx1 precluded verification of this interaction (Fig 7). No HMGB1 signal was detected in control or coimmunoprecipitates, despite the existence of previous reports identifying this protein as a BHMT interaction partner (Fig 8). However, this result could be expected from the fact that the HMGB1-BHMT interaction requires translocation of HMGB1 from the nucleus to the cytoplasm, a process that was favored in previous reports. In contrast, HA-Prkaca coimunoprecipitated with FLAG-BHMT and no significant HA-signal was observed in the controls (Fig 9). Thus, the Prkaca was validated as a BHMT interactor.
Fig 6. Corroboration of the BHMT/actin B interaction.

Cos7 cells were transfected with pFLAG-BHMT, pHA-actin B or cotransfected with both plasmids at a 1:1 (w/w) ratio. Lysates were obtained 48 hours posttransfection and immediately processed by anti-FLAG immunoprecipitation. Input (25 μl) and immunoprecipitate samples (40 μl) were analyzed by western blotting using specific antibodies and mouse TrueBlot. (A) Representative anti-HA immunoblot from the immunoprecipitations experiments carried out (N = 7). (B) Representative anti-FLAG immunoprecipitations from the experiments performed (N = 7). The size of the protein standards is indicated on the left side of each image. (C) Anti-HA signals were quantified using ImageJ and the immunoprecipitate/input ratio (mean ± SEM) from all the experiments performed (N = 7) calculated to correct for differences in expression between control bearing only pHA-actin B and cotransfectants. Statistical analysis of the data was performed by Student’s t-test using GraphPad Prism; *p≤0.05.
Fig 7. Testing Ybx1 as putative BHMT interaction target.

Cos7 cells were transfected with pFLAG-BHMT, pHA-Ybx1 or cotransfected with both plasmids at a 1:1 (w/w) ratio. Lysates were obtained 48 hours posttransfection and immediately processed by anti-FLAG immunoprecipitation. Input (25 μl) and immunoprecipitate samples (40 μl) were analyzed by western blotting using specific antibodies and mouse TrueBlot. (A) Representative anti-HA images from the immunoprecipitation experiments carried out (N = 3). (B) Representative anti-FLAG immunoblot from the immunoprecipitation experiments performed (N = 3). The size of the protein standards is indicated on the left side of each image. (C) Anti-HA signals were quantified using ImageJ and the immunoprecipitate/input ratio (mean ± SEM) from all the experiments (N = 3) calculated to correct for differences in expression between control bearing only pHA-Ybx1 and cotransfectants. Statistical analysis of the data was performed by Student’s t-test using GraphPad Prism; *p≤0.05.
Fig 8. Validation of HMGB1 and BHMT interaction.

Cos7 cells were transfected with pFLAG-BHMT, pHA-HMGB1 or cotransfected with both plasmids at a 1:1 (w/w) ratio. Lysates were obtained 48 hours posttransfection and immediately processed by anti-FLAG immunoprecipitation. Input (25 μl) and immunoprecipitate samples (40 μl) were analyzed by western blotting using specific antibodies and mouse TrueBlot. (A) Representative anti-HA immunoblots of the experiments performed (N = 3). (B) Representative anti-FLAG images of the experiments carried out (N = 3). The size of the protein standards is indicated on the left side of each image.
Fig 9. Coimmunoprecipitation of Prkaca and BHMT.

Cos7 cells were transfected with pFLAG-BHMT, pHA-Prkaca or cotransfected with both plasmids at a 1:1 (w/w) ratio. Lysates were obtained 48 hours posttransfection and immediately processed by anti-FLAG immunoprecipitation. Input (25 μl) and immunoprecipitate samples (40 μl) were analyzed by western blotting mouse primary antibodies and mouse TrueBlot. (A) Representative anti-HA immunoblot of the immunoprecipitation experiments performed (N = 3). (B) Representative images of anti-FLAG immunoblots of the experiments carried out (N = 3). The size of the protein standards is indicated at the left side of each image. (C) Anti-HA signals were quantified from all experiments (N = 3) using ImageJ and the immunoprecipitate/input ratio (mean ± SEM) calculated to correct for differences in expression between control bearing only pHA-Prkaca and cotransfectants. Statistical analysis of the data was performed by Student’s t-test using GraphPad Prism; *p≤0.05.
We also sought out for validation of putative preys found in the YTH screening that were detected in previous AP-MS experiments, but that showed unspecific binding to chitin columns. This is the case of ALDOB and HPD. For this purpose, cotransfection with pFLAG-BHMT and pHA-ALDOB or pHA-HPD was performed and anti-HA immunoprecipitation carried out (Fig 10). In both cases, anti-BHMT recognized a band immediately below the heavy chain of anti-HA in the immunoprecipitates of cotransfected cells. Thus, ALDOB and HPD were confirmed as BHMT interaction targets.
Fig 10. Confirmation of the BHMT/ALDOB and BHMT/HPD interaction.
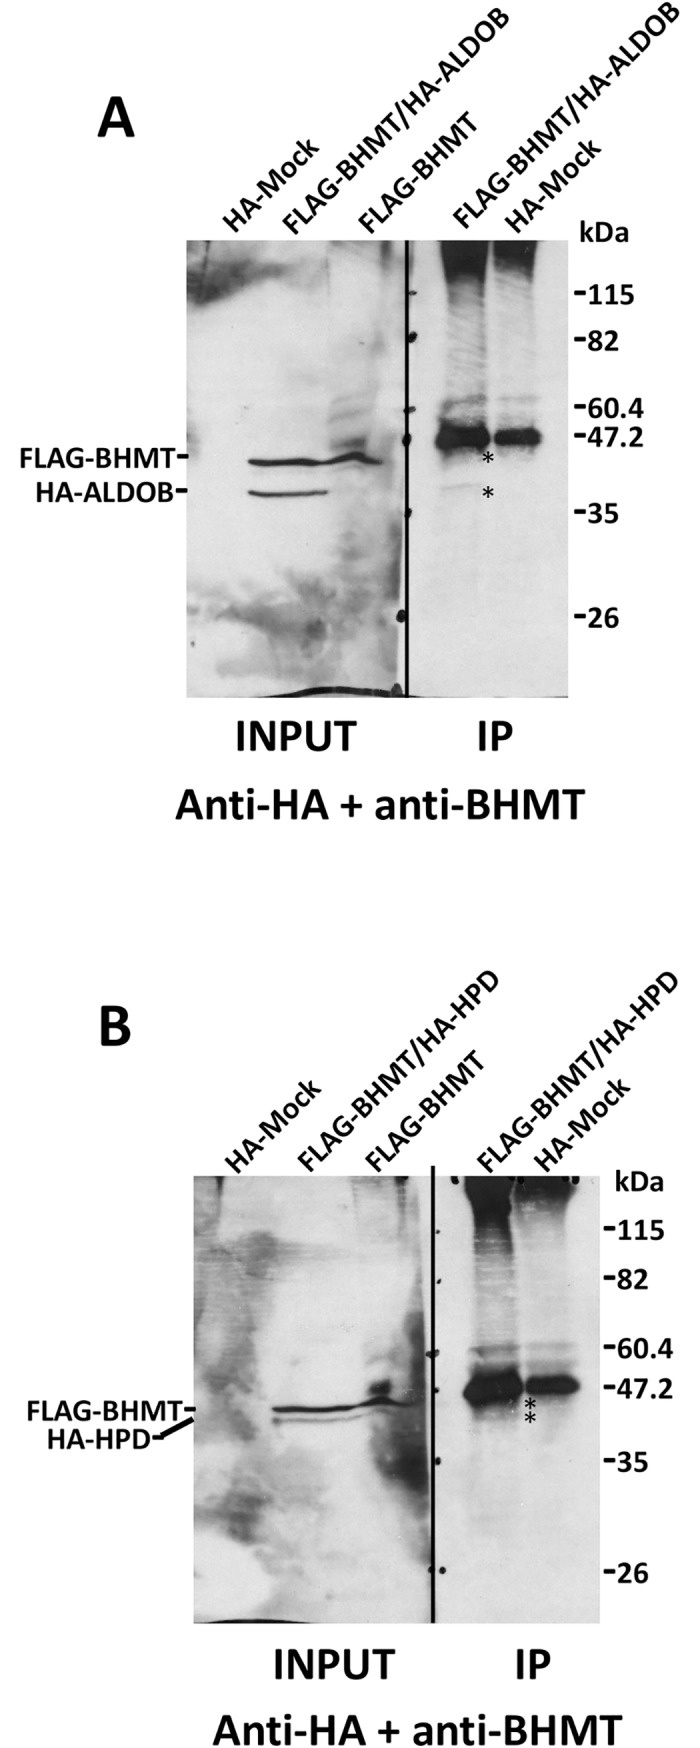
Cos7 cells were transfected with pFLAG-BHMT, pHA-ALDOB and pHA-HPD or cotransfected with pFLAG-BHMT and either of the pHA-preys at a 1:1 (w/w) ratio. Lysates were obtained 48 hours posttransfection and immediately processed by immunoprecipitation. Samples (30 μl) of the inputs and anti-HA immunoprecipitates were loaded on 14% SDS-PAGE gels and analyzed by western blotting. (A) Representative immunoblot of the immunoprecipitation experiments (N = 4) performed for ALDOB analyzed with a mixture of anti-HA and anti-BHMT. (B) Representative immunoblot of the immunoprecipitation experiments (N = 4) performed for HPD analyzed with a mixture of anti-HA and anti-BHMT. The size of the protein standards is indicated on the side of each image. (*) Specific BHMT, ALDOB and HPD bands are indicated in the immunoprecipitation lanes.
Finally, protein-protein interaction network analysis was carried out for the whole set of BHMT interaction targets identified by AP-MS and YTH using STRING. The PPI network constructed contained 131 proteins, 122 nodes and 165 edges (Fig 11A). The average node degree was 2.7 and the PPI enrichment value 4.81e-05. This tool classified the targets in a large number of pathways with statistical significance (FDR <0.05). Several GO pathways were found and grouped according to the biological process (152; Table 6), the molecular function (48; Table 7) and the cellular component (58; Table 8). Moreover, a limited number of KEGG pathways (4) with FDR <0.05 were also identified, including the biosynthesis of amino acids (ID 01230; 4.63e-05), cysteine and methionine metabolism (ID 00270; 0.000212), the spliceosome (ID 03040; 0.000408) and metabolic pathways (ID 01100; 0.04) (Fig 11B). Some of these pathways were also recognized when analysis of the interaction targets was performed with Bioprofiling, although the set with statistical significance was more limited.
Fig 11. Network analysis using STRING and new validated interaction targets.

The whole set of BHMT interaction targets identified by affinity purification/mass spectrometry and yeast two-hybrid was analyzed using STRING set at medium confidence 0.4. (A) The panel shows the network links. (B) Pie chart illustrating the distribution between KEGG pathways with false discovery rates <0.05; The number of proteins identified for each pathway is indicated in parenthesis. (C) Schematic representation of the validated BHMT interactions identified in the present study. Abbreviations: BHMT, betaine homocysteine S-methyltransferase; BHMT2, S-methylmethionine methyltransferase or betaine homocysteine methyltransferase 2; MATα1, methionine adenosyltransferase alpha1; MATα2, methionine adenosyltransferase alpha2; MATβ, methionine adenosyltransferase beta; ALDOB, aldolase b; Prkaca, cAMP-dependent protein kinase catalytic subunit alpha; HPD, 4-hydroxyphenylpyruvic acid dioxygenase.
Table 6. STRING classification of BHMT interaction targets according to the biological process (GO).
| pathway ID | pathway description | count in protein set | false discovery rate |
|---|---|---|---|
| GO:0008152 | metabolic process | 65 | 1.57e-18 |
| GO:0044237 | cellular metabolic process | 60 | 1.57e-18 |
| GO:0044238 | primary metabolic process | 59 | 1.13e-17 |
| GO:0071704 | organic substance metabolic process | 60 | 1.13e-17 |
| GO:0009987 | cellular process | 72 | 2.04e-17 |
| GO:0006807 | nitrogen compound metabolic process | 45 | 1.32e-16 |
| GO:0034641 | cellular nitrogen compound metabolic process | 42 | 1.86e-15 |
| GO:0008150 | biological_process | 66 | 2.88e-12 |
| GO:1901360 | organic cyclic compound metabolic process | 36 | 1.36e-11 |
| GO:0044260 | cellular macromolecule metabolic process | 42 | 1.48e-11 |
| GO:0006725 | cellular aromatic compound metabolic process | 34 | 6.32e-11 |
| GO:0043170 | macromolecule metabolic process | 43 | 1.06e-10 |
| GO:0046483 | heterocycle metabolic process | 33 | 1.94e-10 |
| GO:0006139 | nucleobase-containing compound metabolic process | 32 | 2.02e-10 |
| GO:0044699 | single-organism process | 54 | 3.76e-08 |
| GO:0044271 | cellular nitrogen compound biosynthetic process | 26 | 5.02e-08 |
| GO:0010467 | gene expression | 26 | 2.3e-07 |
| GO:0009058 | biosynthetic process | 30 | 3.64e-07 |
| GO:0044249 | cellular biosynthetic process | 29 | 4e-07 |
| GO:0050896 | response to stimulus | 40 | 4e-07 |
| GO:0044763 | single-organism cellular process | 49 | 6.11e-07 |
| GO:1901576 | organic substance biosynthetic process | 29 | 8.02e-07 |
| GO:0090304 | nucleic acid metabolic process | 24 | 1.39e-06 |
| GO:0006575 | cellular modified amino acid metabolic process | 9 | 1.52e-06 |
| GO:0006396 | RNA processing | 12 | 2.32e-06 |
| GO:1901564 | organonitrogen compound metabolic process | 19 | 2.34e-06 |
| GO:0006397 | mRNA processing | 10 | 2.89e-06 |
| GO:0042221 | response to chemical | 29 | 3.4e-06 |
| GO:0008380 | RNA splicing | 9 | 5.87e-06 |
| GO:0051252 | regulation of RNA metabolic process | 21 | 8.69e-06 |
| GO:0031323 | regulation of cellular metabolic process | 29 | 1.29e-05 |
| GO:0044281 | small molecule metabolic process | 19 | 1.41e-05 |
| GO:0060255 | regulation of macromolecule metabolic process | 28 | 1.51e-05 |
| GO:0044767 | single-organism developmental process | 31 | 1.52e-05 |
| GO:0019219 | regulation of nucleobase-containing compound metabolic process | 22 | 2.16e-05 |
| GO:0080090 | regulation of primary metabolic process | 28 | 2.16e-05 |
| GO:0051171 | regulation of nitrogen compound metabolic process | 23 | 2.51e-05 |
| GO:0048856 | anatomical structure development | 28 | 3.69e-05 |
| GO:0016070 | RNA metabolic process | 20 | 3.86e-05 |
| GO:0044710 | single-organism metabolic process | 27 | 3.86e-05 |
| GO:0006556 | S-adenosylmethionine biosynthetic process | 3 | 3.89e-05 |
| GO:0019222 | regulation of metabolic process | 30 | 4.05e-05 |
| GO:0065007 | biological regulation | 41 | 4.4e-05 |
| GO:0048519 | negative regulation of biological process | 26 | 4.92e-05 |
| GO:0050794 | regulation of cellular process | 38 | 7.24e-05 |
| GO:0044267 | cellular protein metabolic process | 22 | 7.34e-05 |
| GO:0051716 | cellular response to stimulus | 30 | 8.03e-05 |
| GO:0048523 | negative regulation of cellular process | 24 | 0.000104 |
| GO:0034654 | nucleobase-containing compound biosynthetic process | 18 | 0.000117 |
| GO:0010468 | regulation of gene expression | 21 | 0.000126 |
| GO:0010033 | response to organic substance | 23 | 0.000134 |
| GO:2000112 | regulation of cellular macromolecule biosynthetic process | 20 | 0.000157 |
| GO:0070887 | cellular response to chemical stimulus | 19 | 0.000164 |
| GO:0050789 | regulation of biological process | 38 | 0.000191 |
| GO:0007275 | multicellular organismal development | 26 | 0.00031 |
| GO:0048731 | system development | 24 | 0.000343 |
| GO:0019538 | protein metabolic process | 23 | 0.000393 |
| GO:0044272 | sulfur compound biosynthetic process | 5 | 0.000456 |
| GO:1901566 | organonitrogen compound biosynthetic process | 12 | 0.00052 |
| GO:0034645 | cellular macromolecule biosynthetic process | 19 | 0.000618 |
| GO:0048522 | positive regulation of cellular process | 24 | 0.000655 |
| GO:0071310 | cellular response to organic substance | 16 | 0.000737 |
| GO:1901699 | cellular response to nitrogen compound | 10 | 0.000862 |
| GO:0006355 | regulation of transcription, DNA-templated | 17 | 0.00102 |
| GO:0045934 | negative regulation of nucleobase-containing compound metabolic process | 11 | 0.0014 |
| GO:1901698 | response to nitrogen compound | 14 | 0.00152 |
| GO:0032501 | multicellular organismal process | 28 | 0.00209 |
| GO:0001889 | liver development | 6 | 0.00211 |
| GO:0030334 | regulation of cell migration | 9 | 0.00211 |
| GO:0061008 | hepaticobiliary system development | 6 | 0.00211 |
| GO:0051253 | negative regulation of RNA metabolic process | 10 | 0.00219 |
| GO:0042398 | cellular modified amino acid biosynthetic process | 4 | 0.00224 |
| GO:0006403 | RNA localization | 5 | 0.0023 |
| GO:0010608 | posttranscriptional regulation of gene expression | 7 | 0.0025 |
| GO:0042981 | regulation of apoptotic process | 13 | 0.0025 |
| GO:0009719 | response to endogenous stimulus | 17 | 0.00251 |
| GO:0009056 | catabolic process | 14 | 0.00253 |
| GO:0071417 | cellular response to organonitrogen compound | 9 | 0.00259 |
| GO:0048513 | organ development | 18 | 0.0026 |
| GO:0010629 | negative regulation of gene expression | 11 | 0.00291 |
| GO:0033528 | S-methylmethionine cycle | 2 | 0.00326 |
| GO:0042450 | arginine biosynthetic process via ornithine | 2 | 0.00326 |
| GO:0042493 | response to drug | 11 | 0.00326 |
| GO:0019752 | carboxylic acid metabolic process | 11 | 0.00329 |
| GO:0010243 | response to organonitrogen compound | 13 | 0.00338 |
| GO:1901701 | cellular response to oxygen-containing compound | 11 | 0.00364 |
| GO:2000113 | negative regulation of cellular macromolecule biosynthetic process | 10 | 0.00367 |
| GO:0072521 | purine-containing compound metabolic process | 7 | 0.00393 |
| GO:0043412 | macromolecule modification | 16 | 0.00406 |
| GO:0048518 | positive regulation of biological process | 24 | 0.00406 |
| GO:0010605 | negative regulation of macromolecule metabolic process | 14 | 0.00408 |
| GO:0080134 | regulation of response to stress | 10 | 0.00442 |
| GO:0014070 | response to organic cyclic compound | 14 | 0.0045 |
| GO:0055086 | nucleobase-containing small molecule metabolic process | 8 | 0.005 |
| GO:0009605 | response to external stimulus | 15 | 0.0051 |
| GO:0046683 | response to organophosphorus | 6 | 0.00524 |
| GO:0044707 | single-multicellular organism process | 26 | 0.00548 |
| GO:0044248 | cellular catabolic process | 12 | 0.00562 |
| GO:1901575 | organic substance catabolic process | 12 | 0.00567 |
| GO:0006950 | response to stress | 19 | 0.00599 |
| GO:0055114 | oxidation-reduction process | 11 | 0.00649 |
| GO:0035556 | intracellular signal transduction | 12 | 0.00651 |
| GO:1903311 | regulation of mRNA metabolic process | 4 | 0.00665 |
| GO:0006464 | cellular protein modification process | 15 | 0.00674 |
| GO:0032879 | regulation of localization | 17 | 0.00674 |
| GO:1903312 | negative regulation of mRNA metabolic process | 3 | 0.0069 |
| GO:1990267 | response to transition metal nanoparticle | 6 | 0.00723 |
| GO:0006796 | phosphate-containing compound metabolic process | 14 | 0.0073 |
| GO:0006351 | transcription, DNA-templated | 13 | 0.0085 |
| GO:0006810 | transport | 21 | 0.00895 |
| GO:0007399 | nervous system development | 15 | 0.00983 |
| GO:1901700 | response to oxygen-containing compound | 15 | 0.00988 |
| GO:0014074 | response to purine-containing compound | 6 | 0.0103 |
| GO:0071345 | cellular response to cytokine stimulus | 7 | 0.0105 |
| GO:0006730 | one-carbon metabolic process | 3 | 0.0106 |
| GO:0043488 | regulation of mRNA stability | 3 | 0.0106 |
| GO:0009725 | response to hormone | 13 | 0.011 |
| GO:0010038 | response to metal ion | 8 | 0.0115 |
| GO:0071495 | cellular response to endogenous stimulus | 11 | 0.0115 |
| GO:0009066 | aspartate family amino acid metabolic process | 3 | 0.012 |
| GO:0043604 | amide biosynthetic process | 7 | 0.0121 |
| GO:0045787 | positive regulation of cell cycle | 5 | 0.0123 |
| GO:0071786 | endoplasmic reticulum tubular network organization | 2 | 0.0125 |
| GO:0031324 | negative regulation of cellular metabolic process | 13 | 0.0134 |
| GO:0034097 | response to cytokine | 8 | 0.0135 |
| GO:1903034 | regulation of response to wounding | 6 | 0.0135 |
| GO:0048583 | regulation of response to stimulus | 16 | 0.0151 |
| GO:0051260 | protein homooligomerization | 6 | 0.0167 |
| GO:0071375 | cellular response to peptide hormone stimulus | 6 | 0.0177 |
| GO:0043434 | response to peptide hormone | 8 | 0.0183 |
| GO:0010035 | response to inorganic substance | 9 | 0.0191 |
| GO:0032069 | regulation of nuclease activity | 2 | 0.0191 |
| GO:0050658 | RNA transport | 4 | 0.0191 |
| GO:0023051 | regulation of signaling | 15 | 0.0206 |
| GO:0045892 | negative regulation of transcription, DNA-templated | 8 | 0.0211 |
| GO:0051726 | regulation of cell cycle | 8 | 0.0211 |
| GO:0010646 | regulation of cell communication | 15 | 0.0227 |
| GO:0046128 | purine ribonucleoside metabolic process | 5 | 0.0236 |
| GO:1901605 | alpha-amino acid metabolic process | 5 | 0.0244 |
| GO:0051179 | localization | 22 | 0.0272 |
| GO:0044711 | single-organism biosynthetic process | 10 | 0.0286 |
| GO:0065003 | macromolecular complex assembly | 10 | 0.0314 |
| GO:0071840 | cellular component organization or biogenesis | 20 | 0.0319 |
| GO:0051259 | protein oligomerization | 7 | 0.032 |
| GO:0000050 | urea cycle | 2 | 0.0351 |
| GO:0071316 | cellular response to nicotine | 2 | 0.0351 |
| GO:1901135 | carbohydrate derivative metabolic process | 8 | 0.0368 |
| GO:0006417 | regulation of translation | 5 | 0.0369 |
| GO:0032414 | positive regulation of ion transmembrane transporter activity | 3 | 0.0386 |
| GO:0006461 | protein complex assembly | 9 | 0.0403 |
| GO:0070271 | protein complex biogenesis | 9 | 0.0403 |
| GO:0071407 | cellular response to organic cyclic compound | 7 | 0.0426 |
Table 7. STRING classification of BHMT interaction targets according to molecular function (GO).
| pathway ID | pathway description | count in protein set | false discovery rate |
|---|---|---|---|
| GO:1901363 | heterocyclic compound binding | 47 | 1.69e-15 |
| GO:0097159 | organic cyclic compound binding | 47 | 1.71e-15 |
| GO:0003674 | molecular_function | 69 | 4.1e-14 |
| GO:0005488 | binding | 59 | 8.46e-12 |
| GO:0003723 | RNA binding | 22 | 9.75e-12 |
| GO:0043167 | ion binding | 44 | 1.15e-10 |
| GO:0003676 | nucleic acid binding | 28 | 2.69e-10 |
| GO:0000166 | nucleotide binding | 29 | 3.54e-10 |
| GO:0036094 | small molecule binding | 31 | 3.54e-10 |
| GO:0003697 | single-stranded DNA binding | 7 | 3.31e-08 |
| GO:0043168 | anion binding | 28 | 7.59e-08 |
| GO:0008134 | transcription factor binding | 10 | 5.78e-07 |
| GO:0005515 | protein binding | 32 | 1.27e-06 |
| GO:0032550 | purine ribonucleoside binding | 20 | 8.44e-06 |
| GO:0035639 | purine ribonucleoside triphosphate binding | 20 | 8.44e-06 |
| GO:0097367 | carbohydrate derivative binding | 22 | 8.44e-06 |
| GO:0003824 | catalytic activity | 34 | 1.04e-05 |
| GO:0032555 | purine ribonucleotide binding | 20 | 1.04e-05 |
| GO:0043566 | structure-specific DNA binding | 8 | 1.64e-05 |
| GO:0005524 | ATP binding | 17 | 2.62e-05 |
| GO:0044822 | poly(A) RNA binding | 11 | 4.59e-05 |
| GO:0003677 | DNA binding | 15 | 5.7e-05 |
| GO:0019899 | enzyme binding | 14 | 7.11e-05 |
| GO:0043169 | cation binding | 25 | 0.000118 |
| GO:0046872 | metal ion binding | 24 | 0.000199 |
| GO:0008289 | lipid binding | 10 | 0.00102 |
| GO:0016491 | oxidoreductase activity | 11 | 0.00126 |
| GO:0016829 | lyase activity | 6 | 0.00147 |
| GO:0005198 | structural molecule activity | 9 | 0.00152 |
| GO:0043021 | ribonucleoprotein complex binding | 4 | 0.00188 |
| GO:0004478 | methionine adenosyltransferase activity | 2 | 0.00229 |
| GO:0044877 | macromolecular complex binding | 12 | 0.00229 |
| GO:0047150 | betaine-homocysteine S-methyltransferase activity | 2 | 0.00229 |
| GO:0008898 | S-adenosylmethionine-homocysteine S-methyltransferase activity | 2 | 0.00667 |
| GO:0051082 | unfolded protein binding | 3 | 0.00877 |
| GO:0097100 | supercoiled DNA binding | 2 | 0.0124 |
| GO:0003729 | mRNA binding | 4 | 0.0132 |
| GO:0016740 | transferase activity | 14 | 0.0174 |
| GO:0042162 | telomeric DNA binding | 2 | 0.0193 |
| GO:0016860 | intramolecular oxidoreductase activity | 3 | 0.0266 |
| GO:0008301 | DNA binding, bending | 2 | 0.0379 |
| GO:0016840 | carbon-nitrogen lyase activity | 2 | 0.0379 |
| GO:0043565 | sequence-specific DNA binding | 7 | 0.0385 |
| GO:0019901 | protein kinase binding | 6 | 0.0415 |
| GO:0051059 | NF-kappaB binding | 2 | 0.0476 |
| GO:0004672 | protein kinase activity | 7 | 0.0491 |
| GO:0004674 | protein serine/threonine kinase activity | 6 | 0.0495 |
| GO:0019843 | rRNA binding | 3 | 0.0497 |
Table 8. STRING classification of BHMT interaction targets according to the cellular component (GO).
| Cellular component (GO) | |||
|---|---|---|---|
| pathway ID | pathway description | count in protein set | false discovery rate |
| GO:0044424 | intracellular part | 76 | 2.91e-20 |
| GO:0005622 | intracellular | 76 | 5.88e-20 |
| GO:0005737 | cytoplasm | 69 | 1.93e-17 |
| GO:0044464 | cell part | 76 | 1.93e-17 |
| GO:0005623 | cell | 76 | 1.94e-17 |
| GO:0005634 | nucleus | 46 | 5.75e-15 |
| GO:0005575 | cellular_component | 74 | 2.38e-14 |
| GO:0043226 | organelle | 63 | 2.38e-14 |
| GO:0044446 | intracellular organelle part | 50 | 3.06e-14 |
| GO:0032991 | macromolecular complex | 41 | 2.36e-13 |
| GO:0043229 | intracellular organelle | 60 | 4.26e-13 |
| GO:0043227 | membrane-bounded organelle | 58 | 1.01e-12 |
| GO:0043231 | intracellular membrane-bounded organelle | 55 | 1.42e-11 |
| GO:0044428 | nuclear part | 26 | 1.4e-09 |
| GO:0070013 | intracellular organelle lumen | 26 | 2.16e-09 |
| GO:0044444 | cytoplasmic part | 46 | 2.18e-09 |
| GO:0030529 | ribonucleoprotein complex | 15 | 4.57e-09 |
| GO:0043232 | intracellular non-membrane-bounded organelle | 29 | 4.57e-09 |
| GO:0031981 | nuclear lumen | 22 | 3.42e-08 |
| GO:0048471 | perinuclear region of cytoplasm | 13 | 4.19e-06 |
| GO:0070062 | extracellular exosome | 18 | 7.02e-06 |
| GO:0005829 | cytosol | 20 | 9.86e-06 |
| GO:0031988 | membrane-bounded vesicle | 22 | 1.03e-05 |
| GO:0043234 | protein complex | 26 | 1.51e-05 |
| GO:0044421 | extracellular region part | 22 | 1.51e-05 |
| GO:0031982 | vesicle | 22 | 2.21e-05 |
| GO:0016020 | membrane | 41 | 2.31e-05 |
| GO:0005681 | spliceosomal complex | 6 | 3.33e-05 |
| GO:0005654 | nucleoplasm | 15 | 3.77e-05 |
| GO:0005576 | extracellular region | 23 | 0.00014 |
| GO:0005739 | mitochondrion | 15 | 0.000765 |
| GO:0000793 | condensed chromosome | 5 | 0.000945 |
| GO:0048269 | methionine adenosyltransferase complex | 2 | 0.000945 |
| GO:0098588 | bounding membrane of organelle | 17 | 0.000945 |
| GO:0031090 | organelle membrane | 20 | 0.000973 |
| GO:0005793 | endoplasmic reticulum-Golgi intermediate compartment | 4 | 0.00136 |
| GO:0012505 | endomembrane system | 21 | 0.00281 |
| GO:0005730 | nucleolus | 8 | 0.00313 |
| GO:0005783 | endoplasmic reticulum | 13 | 0.00434 |
| GO:1990124 | messenger ribonucleoprotein complex | 2 | 0.00474 |
| GO:0005694 | chromosome | 7 | 0.00912 |
| GO:0043209 | myelin sheath | 5 | 0.00912 |
| GO:0005856 | cytoskeleton | 12 | 0.0138 |
| GO:0042470 | melanosome | 4 | 0.0138 |
| GO:0016607 | nuclear speck | 4 | 0.0146 |
| GO:0034663 | endoplasmic reticulum chaperone complex | 2 | 0.0146 |
| GO:0042175 | nuclear outer membrane-endoplasmic reticulum membrane network | 9 | 0.0183 |
| GO:0005886 | plasma membrane | 22 | 0.0188 |
| GO:0044451 | nucleoplasm part | 6 | 0.0225 |
| GO:0000777 | condensed chromosome kinetochore | 3 | 0.0226 |
| GO:0070852 | cell body fiber | 2 | 0.0226 |
| GO:0071944 | cell periphery | 22 | 0.0237 |
| GO:0044427 | chromosomal part | 6 | 0.0261 |
| GO:0044432 | endoplasmic reticulum part | 9 | 0.0272 |
| GO:0000779 | condensed chromosome, centromeric region | 3 | 0.0328 |
| GO:0042995 | cell projection | 14 | 0.0332 |
| GO:0044430 | cytoskeletal part | 9 | 0.0447 |
| GO:0044431 | Golgi apparatus part | 7 | 0.0499 |
Discussion
The association of hyperhomocysteinemia (HHcy) with a large variety of diseases has increased the interest in the regulation of enzymes involved in Hcy metabolism and, among them BHMT. Knowledge about this protein and its regulation was hampered by a number difficulties since its discovery approximately 70 years ago (reviewed in [6]). Nevertheless, the last decades have seen a notable increase in data regarding the role of BHMT in disease. Several high throughput studies have provided information concerning PTMs occurring on BHMT or its putative interaction partners in human, rat and mouse [26–36, 49]. These targets are expected to be conserved among species given the high level of sequence identity (>90%) shown by BHMTs. However, the major drawback of these studies relies on the fact that only a few of them have gone further to confirm the interactions detected using additional techniques.
BHMT interaction targets listed in the IntAct and BioGRID databases, as well as in the literature include approximately 22 interaction partners (Table 9) [12, 33–36, 50–57]. However, only seven of these targets have been also identified in our study. Moreover, our results rise doubts about the validity of several BHMT interaction partners included in this list, as tubulin, 10-formyltetrahydrofolate dehydrogenase (Aldh1l1) and carbamoyl phosphate synthetase 1 show unspecific binding to chitin and chitin-intein columns, and no interaction with chitin-intein-BHMT beads. Therefore, among the previously reported BHMT interaction targets only 14-3-3 protein epsilon (Ywhae), tissue-type transglutaminase [33, 51], HMGB1 [36], and BHMT2 [34, 35] bind to BHMT columns in our study. These interactions exhibit different characteristics. For example, the Ywhae-BHMT interaction is lost in the presence of low salt concentrations, whereas the BHMT2-BHMT interaction remains stable. Furthermore, the Ywhae-BHMT interaction is detected only in one of our AP-MS experiments, suggesting that the interaction might be very weak or take place only under specific conditions.
Table 9. Interactions reported for BHMT in human, rat or mouse.
| target | Uniprot code | method | organism | reference |
|---|---|---|---|---|
| ApoB mRNA editing | Screening of liver cDNA expression library | rat | [12] | |
| Myotubularin-related protein 6 (MTMR6) | Q9Y217 | Affinity purification and MSa | human | [35] |
| High mobility group protein B1 (HMGB1) | P63159 | Ischemia/reperfusion, liver IPb, 2Dc, MSa | rat | [36] |
| Tubulin | P68370 | Liver purification, SDS-PAGE and MSa | rat | [50] |
| Tissue-type transglutaminase | Q9WVJ6 | In vitro modification and MSa | mouse, guinea pig, rat | [33, 51] |
| S-protein of HBV | YTHd (liver library) | human | [52] | |
| Glucocortocoid receptor (Nr3c1) | P06536 | Liver immunoaffinity chromatography, 2Dc, MSa | rat | [53] |
| 10-formyltetrahydrofolate dehydrogenase + carbamoyl phosphate synthetase 1 |
P28037 P07756 |
Liver affinity purification and N-terminal sequencing | rat | [54] |
| Bardet-Biedl syndrome 1 protein (BBS1) | Q8NFJ9 | YTHd (fetal kidney library) | human | [55] |
| Bardet-Biedl syndrome 2 protein (BBS2) | Q9BXC9 | YTHd (fetal kidney library) | human | [55] |
| Bardet-Biedl syndrome 4 protein (BBS4) | Q96RK4 | YTHd (fetal kidney library) | human | [55] |
| Regulator complex protein LAMTOR3/ MAPKSP1 | Q9UHA4 | YTHd (adult liver library) | human | [56] |
| Alpha-1,2-mannosyltransferase ALG9 | Q9H6U8 | YTHd (adult liver library) | human | [56] |
| X antigen binding protein 1 of HBV/LAMTOR5 | O43504 | YTHd (cDNA liver library) | human | [57] |
| S-methylmethionine homocysteine S-methyltransferase BHMT2 | Q9H2M3 | Affinity purification and MSa | human | [34, 35] |
| E3 ubiquitin-protein ligase ZNRF1 | Q8ND25 | Affinity purification and MSa | human | [34] |
| Melanoregulain (MREG) | Q8N565 | Affinity purification and MSa | human | [34] |
| Aldehyde dehydrogenase family 16 member A1 (Aldh16a1) | Q3T1L0 | Blue native gels | rat | IntAct |
| 14-3-3 protein epsilon (Ywhae) | P62259 | cosedimentation | mouse | IntAct |
| 6-phosphoglucono lactone (Pgls) | Q9CQ60 | cosedimentation | mouse | IntAct |
| 3 beta-hydroxysteroid dehydrogenase type 7 (Hsd3b7) | Q9EQC1 | cosedimentation | mouse | IntAct |
aMS, mass spectrometry
bIP, immunoprecipitation
c2D, two-dimensional electrophoresis
dYTH, yeast two-hybrid
Regarding tissue-type transglutaminase, its interaction with BHMT was expected, since previous studies showed the ability of this enzyme to modify BHMT on a single peptide [33, 51]. This peptide contains four glutamine residues that can be transglutaminated by their crosslinking with lysine residues of other proteins or with free amines. Different degrees of modification can be detected in this peptide, but in all the cases transglutamination reduces BHMT activity [51].
The BHMT interaction with HMGB1 requires translocation of the latter from the nucleus to the cytoplasm, as demonstrated by coimmunoprecipitation from selective hepatic ischemia/reperfusion samples [36]. However, a small amount of HMGB1 seems to exist in the cytoplasm of control liver samples, as shown in the corresponding coimmunoprecipitates. Our AP-MS study confirms the existence of the HMGB1-BHMT interaction in normal liver, but no coimmunoprecipitation is detected in validation experiments. This opposite behavior could be explained by differences in the cytosolic samples used for coimmunoprecipitation experiments by both groups and may regard on disparities in the content or the presence/loss of specific PTMs in HMGB1. Precisely, Zhang et al. used control liver lobes obtained during a selective ischemia/reperfusion procedure to prepare their cytosolic samples [36], whereas our validation experiments were carried out with cytosol from cotransfected cell lines.
The BHMT-BHMT2 interaction was previously detected in two AP-MS high-throughput studies carried out with human samples [34, 35], and we found this interaction both in our AP-MS and YTH experiments. Thus, the validity of this interaction was confirmed. Moreover, our data indicate that this interaction is strong and/or favored in the presence of salt, since excision of the intein tag is required for BHMT2 elution from the chitin-intein-BHMT column. This fact could be expected from the high percentage of identity between both proteins (73%) and their similar structural features, with the exception of the C-terminal α-helix [58, 59]. Lack of this α-helix results in a reduced stability of the BHMT2 oligomer [24, 59], and hence under certain circumstances a heterotetrameric BHMT-BHMT2 association could be an advantage. Both proteins, BHMT and BHMT2 belong to the methionine cycle and, in their tetrameric form, catalyze the methylation of Hcy for the synthesis of methionine using different methyl donors [60]. While BHMT utilizes betaine for the synthesis of one molecule of methionine, BHMT2 uses S-methylmethionine to produce two molecules of this amino acid [6]. Therefore, a BHMT-BHMT2 heterotetramer may provide additional stability to BHMT2 that putatively results in an increased production of methionine.
Data of our AP-MS study further expand this BHMT interaction network including 128 new putative interaction partners, some of which have been validated by coimmunoprecipitation. Interestingly, two of the validated interaction targets are the catalytic subunits of methionine adenosyltransferases MATα1 and MATα2, which also belong to the methionine cycle. The function of these proteins also depends on their oligomerization that occurs into homodimers and homotetramers for MATα1 or homotetramers and heterotrimers for MATα2 [38, 61–63]. The resulting isoenzymes require a constant methionine supply for the synthesis of the main cellular methyl donor, S-adenosylmethionine [64]. If methionine levels are reduced, the need of this essential amino acid could be supported by Hcy recycling through methylation [6, 64]. It is under these circumstances when the interaction between BHMT and MATs could improve S-adenosylmethionine synthesis to sustain the large variety of reactions that depend on this key metabolite.
Another validated BHMT interaction target is Prkaca, the cAMP-dependent protein kinase catalytic subunit alpha, which phosphorylates a large number of substrates and is involved in key regulatory mechanisms [65]. Several high-throughput studies have analyzed the human, mouse and rat phosphoproteome and the results obtained indicate that BHMTs of these organisms can be phosphorylated on several residues [26, 49, 66–68]. Among them, some serine residues are predicted as putative targets for PKA phosphorylation by KinasePhos (S330 and S368) and NetPhos 3.1 (S68, S222, S245 and S405). Nevertheless, effects derived from BHMT phosphorylation have not been further explored, despite their putative involvement in the control of enzyme activity and/or association events. Additionally, phosphorylation could be implicated in the nucleocytoplasmic shuttling of BHMT, an event that to date has been only linked to changes in the GSH/GSSG ratio that occur in acute liver injury [11]. Combination of different PTMs, their sequential or independent incorporation may regulate binding to importin or exportin carriers and, in turn, the changes in subcellular distribution.
Additional BHMT interaction targets identified and validated in our study are ALDOB and HPD. The former is a glycolytic enzyme that synthesizes glyceraldehyde 3-phosphate from fructose 1,6-bisphosphate [69], whereas the latter is a key enzyme in phenylalanine and tyrosine degradation that converts 4-hydroxyphenylpyruvate in homogentisate [70]. Although no obvious link between these enzymes and BHMT is known, it is interesting to recall that fumaryl acetoacetate, a downstream metabolite of homogentisate, is an inhibitor of MAT [71]. Hence, interaction of HPD and BHMT may result in a crosstalk between both pathways in order to control methionine levels, which may otherwise increase in parallel with fumaryl acetoacetate concentrations as observed in tyrosinemia type I [72]. Indirect links between ALDOB and BHMT could derive from the following facts: i) NADP+ production in the polyol pathway controls S-adenosylmethionine synthesis through MAT II hetero-oligomerization, in turn, reducing methionine pools; ii) elimination of fructose, the final product of the polyol pathway, involves ALDOB; iii) among the downstream metabolites generated during fructose metabolism is acyl-glycerol, which joins apolipoproteins to form lipoproteins; and iv) apoB mRNA levels correlate with BHMT protein levels and increase when the latter is induced [12, 73]. Nevertheless, this putative crossregulation needs to be further explored.
A recent integration of over 9000 MS experiments in order to build a global map of human protein complexes, the hu.MAP [74], has shown BHMT only in two complexes. Complex number 25 comprises BHMT and BHMT2, whereas complex number 2283 contains BHMT, BHMT2 and tubulin-specific chaperone E (TBCE). The scores calculated for the complexes TBCE-BHMT2 (0.9388) and TBCE-BHMT (0.0953) yet suggest that binding to the chaperone occurs indirectly through BHMT2. These results are in accordance with our present study, where the BHMT-BHMT2 interaction is detected by AP-MS and YTH. Moreover, no BHMT-tubulin interaction is identified, further confirming the lack of specific binding observed in our AP-MS experiments, despite the previous proposal of BHMT coassembly with tubulin dimers into microtubules [50]. These differences may rely on the use of normal or taxol-treated rat liver samples and from the different techniques utilized in both studies, AP-MS or cosedimentation.
Network analysis shows three highly connected subnetworks within the whole dataset identified by AP-MS and YTH (Fig 11A). One of these groups comprises targets of the methionine cycle, a second is established around ACTB on one side and the ribosomal Fau protein on the other, and a third is centered around heterogeneous nuclear ribonucleoproteins (Hnrnp). Direct interactions of BHMT are only shown for partners within the methionine cycle and L-serine dehydratase/L-threonine deaminase (Sds; P09367), the latter starting the array of connections linking this pathway and other putative BHMT targets. While interactions within the methionine cycle may facilitate metabolite channeling through enzymes of this route, the BHMT-Sds interaction may result in a crosstalk between methionine synthesis and gluconeogenesis, putatively controlling the use of the amino acid for the latter when its levels are low. Only four KEGG pathways were enriched in this network analysis and all are related to metabolic processes, mainly amino acid metabolic routes (Fig 11B). Results of the cellular component show distribution of the interaction targets among the cytoplasm and other subcellular locations, where the presence of BHMT has not been verified or just recently detected, i.e. the nucleus [11]. Therefore, the classical view of BHMT as a cytoplasmic protein should no longer impede the analysis of its putative interactions out of this compartment that, in fact, should be pursued.
The interactions described in the present work may be involved directly or indirectly in HHcy, a condition related to a large variety of diseases that affect tissues with high (e.g. the liver) to undetectable (e.g. brain) BHMT levels [11], and for which impaired hepatic Hcy metabolism is the main contributor. Therefore, increases in total plasma Hcy levels may not always correlate with changes in expression, protein or activity levels of BHMT in the affected tissue, but rather reflect hepatic alterations due to different types of injury (i.e. alcohol-induced cirrhosis and drug ingestion), stress (i.e. oxidative stress) or deficiencies in essential nutrients (i.e. B-vitamins). Changes in Hcy metabolism of non-genetic origin commonly result from decreased expression of key enzymes of this pathway, including BHMT as observed in hepatoma, cirrhosis or acute liver injury [6, 37, 75]. Moreover, this reduced expression correlates with a decrease in cytoplasmic protein levels, putatively changing the hepatic BHMT interaction network. In this line, interactions with MATs or BHMT2 may be favored in the context of HHcy in an attempt to decrease cellular Hcy levels through remethylation, and in order to sustain S-adenosylmethionine production both in the cytoplasm and the nucleus [11, 37]. In parallel, Hcy excess can be converted by methionyl-tRNA synthetase into Hcy thiolactone which reacts with lysine residues rendering protein homocysteinylation, a PTM that has been associated with protein damage and dysfunction [76, 77]. Therefore, putative homocysteinylation of BHMT and/or the interaction targets identified in the present work may preclude their binding to BHMT and, in turn the crosstalk with other pathways. Additionally, HHcy due to liver injury or stress concurs with inflammation, a context in which transglutaminases are activated, thus promoting crosslinking and production of high-Mr complexes that may include i.e. the proinflammatory protein HMGB1 [78], in turn translocated to the cytoplasm [36]. BHMT is also a substrate of transglutaminase [33, 51], but whether this modification takes place in HHcy remains unknown. We can however speculate that in HHcy a competition for lysine residues may be established between transglutamination and homocysteinylation resulting in either high-Mr complexes or aggregates that cause protein dysfunction. Furthermore, HHcy may also result from the increased Zn2+ loss observed in diabetes and alcoholism, as this cation is essential for BHMT activity [25, 79]. Removal of the Zn2+ atom leads to an oxidized state of BHMT unable to catalyze Hcy remethylation and structural changes that seem restricted to the active site [23]. However, we cannot exclude that other subtle changes take place in the protein structure, putatively affecting protein-protein interaction surfaces such as those involved in ALDOB binding, therefore promoting/precluding the crosstalk between remethylation and glycolysis. In addition, the relevance of the BHMT-Prkaca interaction in HHcy is supported by results of alamandine treatment to revert vascular dysfunction [80]. This drug reduces HHcy, whereas inhibition of the PKA signaling pathway decreases its effectivity. Thus, it can be suggested that BHMT phosphorylation by this kinase may be needed for enzyme activation, in turn favoring an increase in Hcy remethylation.
Altogether, we have expanded the network of validated BHMT interaction targets in normal rat liver to include not only enzymes of the methionine cycle, but also of other metabolic pathways and putative regulators (Fig 11C). Crossregulatory events linking these pathways may contribute to understand the metabolic behavior observed in the large variety of pathologies where HHcy is detected.
Supporting information
(XLSX)
(PDF)
Acknowledgments
The authors wish to thank Edel Reytor and Ainhoa Revilla for cloning of the pHA-MAT2A plasmid and Dolores Pérez-Sala for the critical reading of the manuscript.
Data Availability
All data are contained within the paper and Supporting Information files.
Funding Statement
This work was supported by grants of the Ministerio de Economía, Industria y Competitividad (BFU2005-00050, BFU2008-00666, BFU2009-08977 to MAP; BFU2008-04285 to FP). The CNIC is supported by the Ministerio de Economía, Industria y Competitividad (MEIC) and the Pro CNIC Foundation, and is a Severo Ochoa Center of Excellence (SEV-2015-0505). The funders had no role in study design, data collection and analysis, decision to publish or preparation of the manuscript.
References
- 1.Refsum H, Ueland PM, Nygard O, Vollset SE. Homocysteine and cardiovascular disease. Annu Rev Med. 1998;49: 31–62. doi: 10.1146/annurev.med.49.1.31 . [DOI] [PubMed] [Google Scholar]
- 2.Ueland PM, Refsum H. Plasma homocysteine, a risk factor for vascular disease: plasma levels in health, disease, and drug therapy. J Lab Clin Med. 1989;114(5): 473–501. . [PubMed] [Google Scholar]
- 3.Rosen S, Olin P. Hearing loss and coronary heart disease. Bull N Y Acad Med. 1965;41(10): 1052–1068. . [PMC free article] [PubMed] [Google Scholar]
- 4.Martinez-Vega R, Garrido F, Partearroyo T, Cediel R, Zeisel SH, Martinez-Alvarez C, et al. Folic acid deficiency induces premature hearing loss through mechanisms involving cochlear oxidative stress and impairment of homocysteine metabolism. FASEB J. 2015;29(2): 418–432. Epub 2014/11/12. doi: 10.1096/fj.14-259283. ; PubMed Central PMCID: PMC4314232. [DOI] [PMC free article] [PubMed] [Google Scholar]
- 5.Zeisel SH, Wurtman RJ. Dietary intake of methionine: Influence of brain S-adenosylmethionine In: Usdin E, Borchardt RT, Creveling CR, editors. Transmethylation. New York: Elsevier; 1979. p. 59–68. [Google Scholar]
- 6.Pajares MA, Perez-Sala D. Betaine homocysteine S-methyltransferase: just a regulator of homocysteine metabolism? Cell Mol Life Sci. 2006;63(23): 2792–803. doi: 10.1007/s00018-006-6249-6 . [DOI] [PMC free article] [PubMed] [Google Scholar]
- 7.Garrow TA. Purification, kinetic properties, and cDNA cloning of mammalian betaine-homocysteine methyltransferase. J Biol Chem. 1996;271(37): 22831–22838. . [DOI] [PubMed] [Google Scholar]
- 8.Craig SA. Betaine in human nutrition. Am J Clin Nutr. 2004;80(3): 539–549. doi: 10.1093/ajcn/80.3.539 . [DOI] [PubMed] [Google Scholar]
- 9.Zeisel SH, Story DL, Wurtman RJ, Brunengraber H. Uptake of free choline by isolated perfused rat liver. Proc Natl Acad Sci USA. 1980;77(8): 4417–4419. . [DOI] [PMC free article] [PubMed] [Google Scholar]
- 10.Noga AA, Stead LM, Zhao Y, Brosnan ME, Brosnan JT, Vance DE. Plasma homocysteine is regulated by phospholipid methylation. J Biol Chem. 2003;278(8): 5952–5955. doi: 10.1074/jbc.M212194200 . [DOI] [PubMed] [Google Scholar]
- 11.Perez-Miguelsanz J, Vallecillo N, Garrido F, Reytor E, Perez-Sala D, Pajares MA. Betaine homocysteine S-methyltransferase emerges as a new player of the nuclear methionine cycle. Biochim Biophys Acta. 2017;1864(7): 1165–1182. doi: 10.1016/j.bbamcr.2017.03.004. . [DOI] [PubMed] [Google Scholar]
- 12.Sowden MP, Collins HL, Smith HC, Garrow TA, Sparks JD, Sparks CE. Apolipoprotein B mRNA and lipoprotein secretion are increased in McArdle RH-7777 cells by expression of betaine-homocysteine S-methyltransferase. Biochem J. 1999;341 (Pt 3): 639–645. . [PMC free article] [PubMed] [Google Scholar]
- 13.McKeever MP, Weir DG, Molloy A, Scott JM. Betaine-homocysteine methyltransferase: organ distribution in man, pig and rat and subcellular distribution in the rat. Clin Sci (Lond). 1991;81(4): 551–556. . [DOI] [PubMed] [Google Scholar]
- 14.Yamashita T, Hashimoto S, Kaneko S, Nagai S, Toyoda N, Suzuki T, et al. Comprehensive gene expression profile of a normal human liver. Biochem Biophys Res Commun. 2000;269(1): 110–116. doi: 10.1006/bbrc.2000.2272 . [DOI] [PubMed] [Google Scholar]
- 15.Delgado-Reyes CV, Wallig MA, Garrow TA. Immunohistochemical detection of betaine-homocysteine S-methyltransferase in human, pig, and rat liver and kidney. Arch Biochem Biophys. 2001;393(1): 184–186. doi: 10.1006/abbi.2001.2474 . [DOI] [PubMed] [Google Scholar]
- 16.Sunden SL, Renduchintala MS, Park EI, Miklasz SD, Garrow TA. Betaine-homocysteine methyltransferase expression in porcine and human tissues and chromosomal localization of the human gene. Arch Biochem Biophys. 1997;345(1): 171–174. doi: 10.1006/abbi.1997.0246 . [DOI] [PubMed] [Google Scholar]
- 17.Wijekoon EP, Brosnan ME, Brosnan JT. Homocysteine metabolism in diabetes. Biochem Soc Trans. 2007;35(Pt 5): 1175–1179. Epub 2007/10/25. doi: 10.1042/BST0351175. . [DOI] [PubMed] [Google Scholar]
- 18.Cheng P, Gong J, Wang T, Chen J, Liu GS, Zhang R. Gene expression in rats with Barrett's esophagus and esophageal adenocarcinoma induced by gastroduodenoesophageal reflux. World J Gastroenterol. 2005;11(33): 5117–5122. doi: 10.3748/wjg.v11.i33.5117 . [DOI] [PMC free article] [PubMed] [Google Scholar]
- 19.Rao PV, Garrow TA, John F, Garland D, Millian NS, Zigler JS Jr. Betaine-homocysteine methyltransferase is a developmentally regulated enzyme crystallin in rhesus monkey lens. J Biol Chem. 1998;273(46): 30669–30674. . [DOI] [PubMed] [Google Scholar]
- 20.Arrondo JLR, Pacios MG, Pajares M. Structural studies of betaine homocysteine methyltransferase (BHMT) and a dimeric mutant by IR spectroscopy. Biophys J. 2006;90: 73a. [Google Scholar]
- 21.García-Pacios M, Pajares MA, Pastrana-Ríos B, Arrondo JLR. Structural studies of betaine homocysteine methyl transferase (BHMT) and a dimeric mutant by conventional and 2DCOS moving lapse IR spectroscopy. Biophys J. 2013;104(suppl1): 73A. [Google Scholar]
- 22.Gonzalez B, Pajares MA, Martinez-Ripoll M, Blundell TL, Sanz-Aparicio J. Crystal structure of rat liver betaine homocysteine s-methyltransferase reveals new oligomerization features and conformational changes upon substrate binding. J Mol Biol. 2004;338(4): 771–782. doi: 10.1016/j.jmb.2004.03.005 . [DOI] [PubMed] [Google Scholar]
- 23.Evans JC, Huddler DP, Jiracek J, Castro C, Millian NS, Garrow TA, et al. Betaine-homocysteine methyltransferase: zinc in a distorted barrel. Structure. 2002;10(9): 1159–1171. . [DOI] [PubMed] [Google Scholar]
- 24.Garrido F, Gasset M, Sanz-Aparicio J, Alfonso C, Pajares MA. Rat liver betaine-homocysteine S-methyltransferase equilibrium unfolding: insights into intermediate structure through tryptophan substitutions. Biochem J. 2005;391(Pt 3): 589–599. doi: 10.1042/BJ20050505 . [DOI] [PMC free article] [PubMed] [Google Scholar]
- 25.Gonzalez B, Campillo N, Garrido F, Gasset M, Sanz-Aparicio J, Pajares MA. Active-site-mutagenesis study of rat liver betaine-homocysteine S-methyltransferase. Biochem J. 2003;370(Pt 3): 945–952. doi: 10.1042/BJ20021510 . [DOI] [PMC free article] [PubMed] [Google Scholar]
- 26.Villen J, Beausoleil SA, Gerber SA, Gygi SP. Large-scale phosphorylation analysis of mouse liver. Proc Natl Acad Sci USA. 2007;104(5): 1488–1493. doi: 10.1073/pnas.0609836104 . [DOI] [PMC free article] [PubMed] [Google Scholar]
- 27.Huttlin EL, Jedrychowski MP, Elias JE, Goswami T, Rad R, Beausoleil SA, et al. A tissue-specific atlas of mouse protein phosphorylation and expression. Cell. 2010;143(7): 1174–1189. doi: 10.1016/j.cell.2010.12.001 . [DOI] [PMC free article] [PubMed] [Google Scholar]
- 28.Wagner SA, Beli P, Weinert BT, Scholz C, Kelstrup CD, Young C, et al. Proteomic analyses reveal divergent ubiquitylation site patterns in murine tissues. Mol Cell Proteomics. 2012;11(12): 1578–1585. doi: 10.1074/mcp.M112.017905 . [DOI] [PMC free article] [PubMed] [Google Scholar]
- 29.Lundby A, Lage K, Weinert BT, Bekker-Jensen DB, Secher A, Skovgaard T, et al. Proteomic analysis of lysine acetylation sites in rat tissues reveals organ specificity and subcellular patterns. Cell Rep. 2012;2(2): 419–431. Epub 2012/08/21. doi: 10.1016/j.celrep.2012.07.006. ; PubMed Central PMCID: PMCPMC4103158. [DOI] [PMC free article] [PubMed] [Google Scholar]
- 30.Weinert BT, Scholz C, Wagner SA, Iesmantavicius V, Su D, Daniel JA, et al. Lysine succinylation is a frequently occurring modification in prokaryotes and eukaryotes and extensively overlaps with acetylation. Cell Rep. 2013;4(4): 842–851. Epub 2013/08/21. doi: 10.1016/j.celrep.2013.07.024. . [DOI] [PubMed] [Google Scholar]
- 31.Newton BW, Russell WK, Russell DH, Ramaiah SK, Jayaraman A. Liver proteome analysis in a rodent model of alcoholic steatosis. J Proteome Res. 2009;8(4): 1663–1671. doi: 10.1021/pr800905w . [DOI] [PMC free article] [PubMed] [Google Scholar]
- 32.Lopez-Sanchez LM, Corrales FJ, Barcos M, Espejo I, Munoz-Castaneda JR, Rodriguez-Ariza A. Inhibition of nitric oxide synthesis during induced cholestasis ameliorates hepatocellular injury by facilitating S-nitrosothiol homeostasis. Lab Invest. 2010;90: 116–127. doi: 10.1038/labinvest.2009.104 . [DOI] [PubMed] [Google Scholar]
- 33.Ichikawa A, Ishizaki J, Morita M, Tanaka K, Ikura K. Identification of new amine acceptor protein substrate candidates of transglutaminase in rat liver extract: use of 5-(biotinamido) pentylamine as a probe. Biosci Biotechnol Biochem. 2008;72(4): 1056–1062. Epub 2008/04/09. doi: 10.1271/bbb.70796. . [DOI] [PubMed] [Google Scholar]
- 34.Huttlin EL, Ting L, Bruckner RJ, Gebreab F, Gygi MP, Szpyt J, et al. The BioPlex Network: A Systematic Exploration of the Human Interactome. Cell. 2015;162(2): 425–440. Epub 2015/07/18. doi: 10.1016/j.cell.2015.06.043. ; PubMed Central PMCID: PMCPMC4617211. [DOI] [PMC free article] [PubMed] [Google Scholar]
- 35.Huttlin EL, Bruckner RJ, Paulo JA, Cannon JR, Ting L, Baltier K, et al. Architecture of the human interactome defines protein communities and disease networks. Nature. 2017;545(7655): 505–509. Epub 2017/05/18. doi: 10.1038/nature22366. ; PubMed Central PMCID: PMCPMC5531611. [DOI] [PMC free article] [PubMed] [Google Scholar]
- 36.Zhang T, Wei W, Dirsch O, Kruger T, Kan C, Xie C, et al. Identification of Proteins Interacting with Cytoplasmic High-Mobility Group Box 1 during the Hepatocellular Response to Ischemia Reperfusion Injury. Int J Mol Sci. 2017;18(1): 167 doi: 10.3390/ijms18010167. ; PubMed Central PMCID: PMCPMC5297800. [DOI] [PMC free article] [PubMed] [Google Scholar]
- 37.Delgado M, Garrido F, Perez-Miguelsanz J, Pacheco M, Partearroyo T, Perez-Sala D, et al. Acute Liver Injury Induces Nucleocytoplasmic Redistribution of Hepatic Methionine Metabolism Enzymes. Antioxid Redox Signal. 2014;20(16): 2541–2554. doi: 10.1089/ars.2013.5342 . [DOI] [PMC free article] [PubMed] [Google Scholar]
- 38.Gonzalez B, Garrido F, Ortega R, Martinez-Julvez M, Revilla-Guarinos A, Perez-Pertejo Y, et al. NADP+ binding to the regulatory subunit of methionine adenosyltransferase II increases intersubunit binding affinity in the hetero-trimer. PloS one. 2012;7(11): e50329 doi: 10.1371/journal.pone.0050329 . [DOI] [PMC free article] [PubMed] [Google Scholar]
- 39.Bonzon-Kulichenko E, Perez-Hernandez D, Nunez E, Martinez-Acedo P, Navarro P, Trevisan-Herraz M, et al. A robust method for quantitative high-throughput analysis of proteomes by 18O labeling. Mol Cell Proteomics. 2011;10(1): M110 003335 Epub 2010/09/03. doi: 10.1074/mcp.M110.003335. ; PubMed Central PMCID: PMCPMC3013457. [DOI] [PMC free article] [PubMed] [Google Scholar]
- 40.Lopez-Ferrer D, Martinez-Bartolome S, Villar M, Campillos M, Martin-Maroto F, Vazquez J. Statistical model for large-scale peptide identification in databases from tandem mass spectra using SEQUEST. Anal Chem. 2004;76(23): 6853–6860. Epub 2004/12/02. doi: 10.1021/ac049305c. . [DOI] [PubMed] [Google Scholar]
- 41.Jorge I, Casas EM, Villar M, Ortega-Perez I, Lopez-Ferrer D, Martinez-Ruiz A, et al. High-sensitivity analysis of specific peptides in complex samples by selected MS/MS ion monitoring and linear ion trap mass spectrometry: application to biological studies. J Mass Spectrom. 2007;42(11): 1391–1403. Epub 2007/10/26. doi: 10.1002/jms.1314. . [DOI] [PubMed] [Google Scholar]
- 42.Perez-Hernandez D, Gutierrez-Vazquez C, Jorge I, Lopez-Martin S, Ursa A, Sanchez-Madrid F, et al. The intracellular interactome of tetraspanin-enriched microdomains reveals their function as sorting machineries toward exosomes. J Biol Chem. 2013;288(17): 11649–11661. doi: 10.1074/jbc.M112.445304. ; PubMed Central PMCID: PMCPMC3636856. [DOI] [PMC free article] [PubMed] [Google Scholar]
- 43.Martinez-Bartolome S, Navarro P, Martin-Maroto F, Lopez-Ferrer D, Ramos-Fernandez A, Villar M, et al. Properties of average score distributions of SEQUEST: the probability ratio method. Mol Cell Proteomics. 2008;7(6): 1135–1145. Epub 2008/02/28. doi: 10.1074/mcp.M700239-MCP200. . [DOI] [PubMed] [Google Scholar]
- 44.Navarro P, Vazquez J. A refined method to calculate false discovery rates for peptide identification using decoy databases. J Proteome Res. 2009;8(4): 1792–1796. Epub 2009/08/29. doi: 10.1021/pr800362h. . [DOI] [PubMed] [Google Scholar]
- 45.Perez C, Perez-Zuniga FJ, Garrido F, Reytor E, Portillo F, Pajares MA. The Oncogene PDRG1 Is an Interaction Target of Methionine Adenosyltransferases. PloS one. 2016;11(8): e0161672 doi: 10.1371/journal.pone.0161672. . [DOI] [PMC free article] [PubMed] [Google Scholar]
- 46.Szklarczyk D, Franceschini A, Wyder S, Forslund K, Heller D, Huerta-Cepas J, et al. STRING v10: protein-protein interaction networks, integrated over the tree of life. Nucleic Acids Res. 2015;43(Database issue): D447–452. Epub 2014/10/30. doi: 10.1093/nar/gku1003. ; PubMed Central PMCID: PMCPMC4383874. [DOI] [PMC free article] [PubMed] [Google Scholar]
- 47.Szklarczyk D, Morris JH, Cook H, Kuhn M, Wyder S, Simonovic M, et al. The STRING database in 2017: quality-controlled protein-protein association networks, made broadly accessible. Nucleic Acids Res. 2017;45(D1): D362–D368. Epub 2016/12/08. doi: 10.1093/nar/gkw937. ; PubMed Central PMCID: PMCPMC5210637. [DOI] [PMC free article] [PubMed] [Google Scholar]
- 48.Antonov AV. BioProfiling.de: analytical web portal for high-throughput cell biology. Nucleic Acids Res. 2011;39(Web Server issue): W323–327. Epub 2011/05/26. doi: 10.1093/nar/gkr372. ; PubMed Central PMCID: PMCPMC3125774. [DOI] [PMC free article] [PubMed] [Google Scholar]
- 49.Lundby A, Secher A, Lage K, Nordsborg NB, Dmytriyev A, Lundby C, et al. Quantitative maps of protein phosphorylation sites across 14 different rat organs and tissues. Nature Commun. 2012;3: 876 Epub 2012/06/08. doi: 10.1038/ncomms1871. ; PubMed Central PMCID: PMCPMC3621391. [DOI] [PMC free article] [PubMed] [Google Scholar]
- 50.Sandu C, Nick P, Hess D, Schiltz E, Garrow TA, Brandsch R. Association of betaine-homocysteine S-methyltransferase with microtubules. Biol Chem. 2000;381(7): 619–622. doi: 10.1515/BC.2000.080 . [DOI] [PubMed] [Google Scholar]
- 51.Ichikawa A, Ohashi Y, Terada S, Natsuka S, Ikura K. In vitro modification of betaine-homocysteine S-methyltransferase by tissue-type transglutaminase. Int J Biochem Cell Biol. 2004;36(10): 1981–1992. doi: 10.1016/j.biocel.2004.02.014 . [DOI] [PubMed] [Google Scholar]
- 52.Bai GQ, Cheng J, Zhang SL, Huang YP, Wang L, Liu Y, et al. Screening of hepatocyte proteins binding to complete S protein of hepatitis B virus by yeast-two hybrid system. World J Gastroenterol. 2005;11(25): 3899–3904. doi: 10.3748/wjg.v11.i25.3899 . [DOI] [PMC free article] [PubMed] [Google Scholar]
- 53.Hedman E, Widen C, Asadi A, Dinnetz I, Schroder WP, Gustafsson JA, et al. Proteomic identification of glucocorticoid receptor interacting proteins. Proteomics. 2006;6(10): 3114–3126. Epub 2006/04/19. doi: 10.1002/pmic.200500266. . [DOI] [PubMed] [Google Scholar]
- 54.Kim HS, Kim JM, Roh KB, Lee HH, Kim SJ, Shin YH, et al. Rat liver 10-formyltetrahydrofolate dehydrogenase, carbamoyl phosphate synthetase 1 and betaine homocysteine S-methytransferase were co-purified on Kunitz-type soybean trypsin inhibitor-coupled sepharose CL-4B. J Biochem Mol Biol. 2007;40(4): 604–609. . [DOI] [PubMed] [Google Scholar]
- 55.Oeffner F, Moch C, Neundorf A, Hofmann J, Koch M, Grzeschik KH. Novel interaction partners of Bardet-Biedl syndrome proteins. Cell Motil Cytoskeleton. 2008;65(2): 143–155. Epub 2007/11/15. doi: 10.1002/cm.20250. . [DOI] [PubMed] [Google Scholar]
- 56.Wang J, Huo K, Ma L, Tang L, Li D, Huang X, et al. Toward an understanding of the protein interaction network of the human liver. Mol Syst Biol. 2011;7: 536 Epub 2011/10/13. doi: 10.1038/msb.2011.67. ; PubMed Central PMCID: PMCPMC3261708. [DOI] [PMC free article] [PubMed] [Google Scholar]
- 57.Fan W, Cheng J, Zhang S, Liu X. Cloning and functions of the HBxAg-binding protein XBP1. Mol Med Rep. 2013;7(2): 618–622. Epub 2012/12/18. doi: 10.3892/mmr.2012.1232. . [DOI] [PubMed] [Google Scholar]
- 58.Li F, Feng Q, Lee C, Wang S, Pelleymounter LL, Moon I, et al. Human betaine-homocysteine methyltransferase (BHMT) and BHMT2: common gene sequence variation and functional characterization. Mol Genet Metab. 2008;94(3): 326–335. doi: 10.1016/j.ymgme.2008.03.013 . [DOI] [PMC free article] [PubMed] [Google Scholar]
- 59.Szegedi SS, Garrow TA. Oligomerization is required for betaine-homocysteine S-methyltransferase function. Arch Biochem Biophys. 2004;426(1): 32–42. doi: 10.1016/j.abb.2004.03.040 . [DOI] [PubMed] [Google Scholar]
- 60.Szegedi SS, Castro CC, Koutmos M, Garrow TA. Betaine-homocysteine S-methyltransferase-2 is an S-methylmethionine-homocysteine methyltransferase. J Biol Chem. 2008;283(14): 8939–8945. doi: 10.1074/jbc.M710449200 . [DOI] [PMC free article] [PubMed] [Google Scholar]
- 61.Pajares MA, Alvarez L, Perez-Sala D. How are mammalian methionine adenosyltransferases regulated in the liver? A focus on redox stress. FEBS Lett. 2013;587(12): 1711–1716. doi: 10.1016/j.febslet.2013.04.034 . [DOI] [PubMed] [Google Scholar]
- 62.Mingorance J, Alvarez L, Pajares MA, Mato JM. Recombinant rat liver S-adenosyl-L-methionine synthetase tetramers and dimers are in equilibrium. Int J Biochem Cell Biol. 1997;29(3): 485–491. Epub 1997/03/01. . [DOI] [PubMed] [Google Scholar]
- 63.Sanchez-Perez GF, Gasset M, Calvete JJ, Pajares MA. Role of an intrasubunit disulfide in the association state of the cytosolic homo-oligomer methionine adenosyltransferase. J Biol Chem. 2003;278(9): 7285–7293. Epub 2002/12/24. doi: 10.1074/jbc.M210177200. . [DOI] [PubMed] [Google Scholar]
- 64.Pajares MA, Markham GD. Methionine adenosyltransferase (s-adenosylmethionine synthetase). Adv Enzymol Relat Areas Mol Biol. 2011;78: 449–521. . [DOI] [PubMed] [Google Scholar]
- 65.Tasken K, Aandahl EM. Localized effects of cAMP mediated by distinct routes of protein kinase A. Physiol Rev. 2004;84(1): 137–167. Epub 2004/01/13. doi: 10.1152/physrev.00021.2003. . [DOI] [PubMed] [Google Scholar]
- 66.Wilson-Grady JT, Haas W, Gygi SP. Quantitative comparison of the fasted and re-fed mouse liver phosphoproteomes using lower pH reductive dimethylation. Methods. 2013;61(3): 277–286. Epub 2013/04/10. doi: 10.1016/j.ymeth.2013.03.031. . [DOI] [PubMed] [Google Scholar]
- 67.Bian Y, Song C, Cheng K, Dong M, Wang F, Huang J, et al. An enzyme assisted RP-RPLC approach for in-depth analysis of human liver phosphoproteome. J Proteomics. 2014;96: 253–262. Epub 2013/11/28. doi: 10.1016/j.jprot.2013.11.014. . [DOI] [PubMed] [Google Scholar]
- 68.Grimsrud PA, Carson JJ, Hebert AS, Hubler SL, Niemi NM, Bailey DJ, et al. A quantitative map of the liver mitochondrial phosphoproteome reveals posttranslational control of ketogenesis. Cell Metab. 2012;16(5): 672–683. Epub 2012/11/13. doi: 10.1016/j.cmet.2012.10.004. ; PubMed Central PMCID: PMCPMC3506251. [DOI] [PMC free article] [PubMed] [Google Scholar]
- 69.Bouteldja N, Timson DJ. The biochemical basis of hereditary fructose intolerance. J Inherit Metab Dis. 2010;33(2): 105–112. Epub 2010/02/18. doi: 10.1007/s10545-010-9053-2. . [DOI] [PubMed] [Google Scholar]
- 70.Gertsman I, Gangoiti JA, Nyhan WL, Barshop BA. Perturbations of tyrosine metabolism promote the indolepyruvate pathway via tryptophan in host and microbiome. Mol Genet Metab. 2015;114(3): 431–437. Epub 2015/02/15. doi: 10.1016/j.ymgme.2015.01.005. . [DOI] [PubMed] [Google Scholar]
- 71.Berger R, van Faassen H, Smith GP. Biochemical studies on the enzymatic deficiencies in hereditary tyrosinemia. Clin Chim Acta. 1983;134(1–2): 129–141. Epub 1983/10/31. . [DOI] [PubMed] [Google Scholar]
- 72.Michals K, Matolon R, Wong PW. Dietary treatment of tyrosinemia type I: importance of methionine restriction. J Am Diet Assoc. 1978;73(5): 507–514. Epub 1978/11/01. . [PubMed] [Google Scholar]
- 73.Sparks JD, Collins HL, Chirieac DV, Cianci J, Jokinen J, Sowden MP, et al. Hepatic very-low-density lipoprotein and apolipoprotein B production are increased following in vivo induction of betaine-homocysteine S-methyltransferase. Biochem J. 2006;395(2): 363–371. doi: 10.1042/BJ20051966 . [DOI] [PMC free article] [PubMed] [Google Scholar]
- 74.Drew K, Lee C, Huizar RL, Tu F, Borgeson B, McWhite CD, et al. Integration of over 9,000 mass spectrometry experiments builds a global map of human protein complexes. Mol Syst Biol. 2017;13(6): 932 Epub 2017/06/10. doi: 10.15252/msb.20167490. ; PubMed Central PMCID: PMCPMC5488662. [DOI] [PMC free article] [PubMed] [Google Scholar]
- 75.Avila MA, Berasain C, Torres L, Martin-Duce A, Corrales FJ, Yang H, et al. Reduced mRNA abundance of the main enzymes involved in methionine metabolism in human liver cirrhosis and hepatocellular carcinoma. J Hepatol. 2000;33(6): 907–914. . [DOI] [PubMed] [Google Scholar]
- 76.Jakubowski H, Glowacki R. Chemical biology of homocysteine thiolactone and related metabolites. Adv Clin Chem. 2011;55: 81–103. . [DOI] [PubMed] [Google Scholar]
- 77.Sharma GS, Kumar T, Dar TA, Singh LR. Protein N-homocysteinylation: From cellular toxicity to neurodegeneration. Biochim Biophys Acta. 2015;1850(11): 2239–2245. Epub 2015/09/01. doi: 10.1016/j.bbagen.2015.08.013. . [DOI] [PubMed] [Google Scholar]
- 78.Willis WL, Wang L, Wada TT, Gardner M, Abdouni O, Hampton J, et al. The proinflammatory protein HMGB1 is a substrate of transglutaminase-2 and forms high-molecular weight complexes with autoantigens. J Biol Chem. 2018;293(22): 8394–8409. Epub 2018/04/06. doi: 10.1074/jbc.RA117.001078. . [DOI] [PMC free article] [PubMed] [Google Scholar]
- 79.Breksa AP 3rd, Garrow TA. Recombinant human liver betaine-homocysteine S-methyltransferase: identification of three cysteine residues critical for zinc binding. Biochemistry. 1999;38(42): 13991–13998. . [DOI] [PubMed] [Google Scholar]
- 80.Qaradakhi T, Matsoukas MT, Hayes A, Rybalka E, Caprnda M, Rimarova K, et al. Alamandine reverses hyperhomocysteinemia-induced vascular dysfunction via PKA-dependent mechanisms. Cardiovasc Ther. 2017;35(6). Epub 2017/09/14. doi: 10.1111/1755-5922.12306. . [DOI] [PubMed] [Google Scholar]
Associated Data
This section collects any data citations, data availability statements, or supplementary materials included in this article.
Supplementary Materials
(XLSX)
(PDF)
Data Availability Statement
All data are contained within the paper and Supporting Information files.