Age and wing development at fledging balances mortality in and out of the nest in a compromise between parents and offspring.
Abstract
Should they stay or should they leave? The age at which young transition between life stages, such as living in a nest versus leaving it, differs among species and the reasons why are unclear. We show that offspring of songbird species that leave the nest at a younger age have less developed wings that cause poorer flight performance and greater mortality after fledging. Experimentally delayed fledging verified that older age and better developed wings provide benefits of reduced juvenile mortality. Young are differentially constrained in the age that they can stay in the nest and enjoy these fitness benefits because of differences among species in opposing predation costs while in the nest. This tension between mortality in versus outside of the nest influences offspring traits and performance and creates an unrecognized conflict between parents and offspring that determines the optimal age to fledge.
INTRODUCTION
Juvenile mortality is a strong influence on fitness and demography, and it can vary markedly among species (1–4). For example, some species of songbirds lose only 12% of their young to mortality in the first 3 weeks after they leave the nest, or fledge (5). However, other species of songbirds lose as many as 70% of their young, with particularly high mortality in the first few days after leaving the nest largely from predation (6–8). Similarly high and variable mortality in the first days of juvenile life is common in other taxa (2). A potentially important determinant of juvenile mortality may be locomotor performance and its influence on the ability to escape predators (9–14). Yet, the mortality consequences of locomotor performance are rarely documented in the wild (15), especially across species. Moreover, given the possible consequences for juvenile mortality, the evolutionary reasons why species differ in locomotor performance of their young are poorly understood and largely untested.
A potential evolutionary cause of variation among species in locomotor performance of young is variation in natural selection exerted by predation risk. Predation risk of young in an early life stage can influence the age at which they transition to the next life stage and has been hypothesized to affect locomotor performance and juvenile mortality rates (4). For example, higher predation risk during the premetamorphic stage is associated with earlier age of metamorphosis, with consequences for locomotor traits and size at metamorphosis in diverse taxa (16, 17). Songbirds exhibit similar impacts of predation risk on the age that young transition from nestlings in the nest to fledglings outside the nest. Predation is the primary source of mortality of songbird offspring in the nest, and species differ in their rates of nest predation because of differences in types and locations of nests (18, 19). Nest predation is a time-dependent source of mortality such that the cumulative probability of being eaten increases with each day that young remain in the nest (19). Hence, nestlings of songbird species that experience higher daily rates of predation have evolved younger ages of fledging from the nest (20) among 19 species (Fig. 1) in mixed riparian forest in Arizona, USA (Fig. 2A) and in many other species across the world (20, 21). In contrast, selection pressures for younger fledging ages are relaxed in species with low nest predation risk, such as cavity-nesting birds, which allows evolution of older ages of fledging (Fig. 2A). Age of fledging is important because it can affect wing development (4, 21), which may affect flight performance and the ability to evade predators to thereby explain variation in fledgling mortality (4, 22). Age, however, is not the sole determinant of wing development when comparing species. Offspring of species experiencing higher rates of nest predation also evolved faster growth of wings (Fig. 2B), which may compensate for earlier age of fledging. Yet, the effects of fledging age and wing growth rates on interspecific variation in flight performance and subsequent mortality are untested, just as the effect of age of transition on locomotor performance and juvenile mortality in the next life stage are unstudied across metamorphic species (16, 17).
Fig. 1. Phylogenetic relationships of study species included in the various tests.
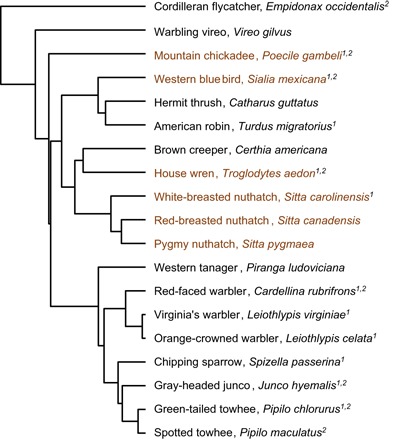
All species were included in measurements of nest predation, fledging age, and wing growth rates. Species demarcated by 1 were included in flight performance measurements, and those with a 2 were included in fledgling mortality measurements. Species with brown labeling are cavity-nesting species with low nest predation rates.
Fig. 2. Effects of nest predation rates on evolution of traits among songbird species.
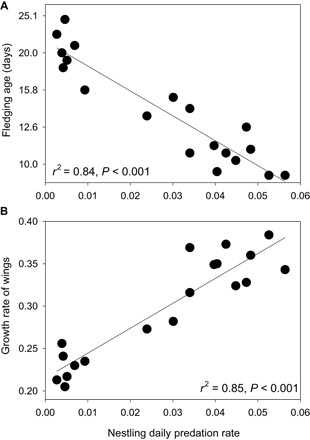
(A) Fledging age on a log10 scale and (B) growth rate of wings were strongly correlated with the rate that nests were depredated per day across 19 songbird species studied in Arizona, USA (see Fig. 1 for species). Statistics are from phylogenetic generalized least-squares (PGLS) analyses (20).
RESULTS AND DISCUSSION
Locomotor performance
We assessed flight performance on fledge day among 11 songbird species (Fig. 1) that differ in their nest predation rates and associated fledging ages and wing growth rates (Fig. 2). We used high-speed videography of birds released from the hand on fledge day to measure their ability to fly (20). We found that flight performance was poorer in species that experienced higher nest predation rates (Fig. 3A) and fledged at younger ages (Fig. 3B). Differences among species in body mass did not explain additional variation in flight performance (P = 0.81, n = 11 species). Instead, relative wing development (that is, offspring wing size as a proportion of adult size) at fledging, which resulted from the interaction of fledging age (rp2 = 0.79, P < 0.001) and growth rate of wings (rp2 = 0.25, P = 0.048, n = 19 species), was the strongest predictor of flight performance at fledging (Fig. 3C).
Fig. 3. Flight performance on the day that young fledge (leave the nest) relative to daily nest predation and phenotypic traits.
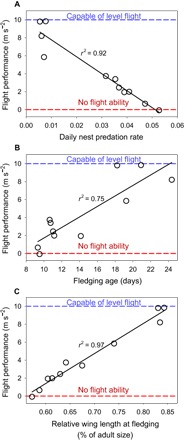
(A to C) Flight performance (A) decreases with increasing nest predation risk per day and increases with (B) fledging age (days) and (C) relative wing size at fledging across 11 songbird species (Fig. 1) studied in Arizona, USA. Statistics are from PGLS analyses (20).
Ultimately, species with higher nest predation rates and younger fledging ages left the nest with less developed wings that limited their ability to produce lift and could only support 0 to 50% of their body weight in the air. As a result, species that experienced the highest rates of nest predation and youngest fledging ages could generally fly <0.5 m on the day they fledged. In contrast, species with low nest predation rates that depart at older ages exhibited sustained flight (100% of weight supported) on fledge day (Fig. 3). Wing development is important for flight, and even flight-incapable young exhibit the ability to climb substrates using developing wings, providing a means of escaping predation (22). Thus, natural selection imposed by nest predation on age of fledging and wing growth rate explain significant variation in relative wing development and locomotor performance at fledging across songbird species.
Locomotor performance and juvenile mortality
We tested whether differences in wing development and locomotor capacity explained differences in juvenile mortality. We studied juvenile mortality among eight of the coexisting species of songbirds (Fig. 1) that are exposed to the same suite of predators and represented a gradient of fledging ages, from 9 to 21 days (table S1). We simultaneously examined whether relative mass at fledging (proportion of adults) influenced mortality. Relative mass of juveniles can reflect physiological condition, which is thought to influence juvenile mortality among diverse taxa [for example, see previous studies (23–25)], including songbird fledglings (8, 26). Relative wing length and relative mass increased with fledging age among the eight species (Fig. 4A). However, increases in relative mass reached an asymptote at adult size in species with older fledging ages, whereas relative wing length showed a continuous linear increase with fledging age across species (Fig. 4A). Fledgling mortality, measured using small (≤3.8% of body mass) radio transmitters (20), decreased across species as both relative mass and relative wing length increased, although the correlation was stronger for relative wing length (Fig. 4B).
Fig. 4. Differences among eight species (Fig. 1) in relative size at fledging and the relationships to fledgling mortality (20).
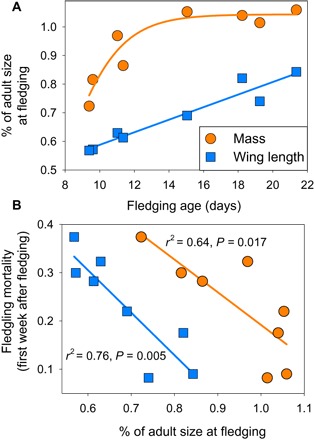
(A) Wing length as a proportion of adult size increases linearly with fledging age, while body mass asymptotes at adult size in species with older fledging ages. (B) Relative wing length at fledging as a proportion of adult size is more strongly correlated than relative mass with fledgling mortality.
Delayed fledging experiment
We tested causality of the relative mass and wing development on juvenile mortality by conducting an experiment. We built small enclosures around nests of gray-headed juncos (Junco hyemalis) to delay fledging age for 3 days and allow a test of the effect of older fledging age on survival. Juncos nest on the ground and leave the nest at a relatively young age (11.4 ± 0.11 days) with poorly developed wings (60.3 ± 0.28% of adult size). The enclosure was 2 m in diameter and 2 m high but open at the top to allow parents to enter and feed the young (Fig. 5). Our enclosure was set up in stages starting 1 to 3 days before fledging to allow parents to habituate. Young fledged naturally from the nest but were prevented from leaving the immediate area around the nest and being exposed to predators until 3 days later, when we released them from the enclosure.
Fig. 5. Gray-headed junco parent perched above enclosure.
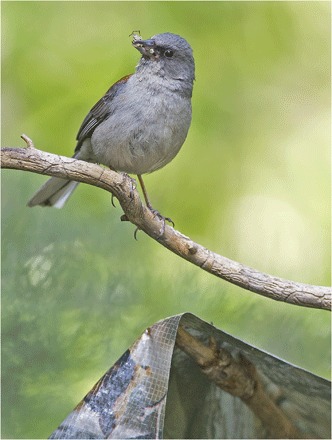
Parents perched above the enclosure opening to examine the offspring and situation below before entering to feed the young inside (photo by T.E.M.).
Fledgling mass asymptotes near fledging such that relative mass did not differ significantly between control young that fledged at normal ages compared with enclosed young that were released 3 days later (Fig. 6A). In contrast, relative wing size increased substantially in young with delayed fledging age (Fig. 6, A and B). The top model from analyses of fledgling mortality included differences between treatments (control versus enclosure) plus relative wing length as a covariate (20). The model weight of 0.997 indicated virtually no explanatory power of alternatives. The next best model included mass but had a ΔAICc of 15.7 and essentially no model weight. Ultimately, mortality decreased across individual junco fledglings with increased wing lengths (Fig. 6C) within and between treatments.
Fig. 6. Wing length and mass with respect to fledgling mortality rates.
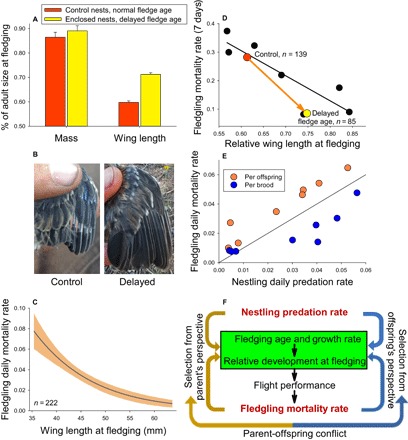
(A) Mass and wing length as a proportion of adult size in control versus experimentally enclosed nests for gray-headed junco. Control nests fledged at normal age (11 to 12 days), whereas enclosed nests prevented young from leaving for 3 days after fledging naturally to create a delayed fledge age. (B) Photos of typical wings of junco young from control versus experimentally delayed nests on fledging day versus release day, respectively. (C) Daily mortality rate (±1 SE) decreased among fledglings with increasing wing length at fledging in juncos. (D) Mortality rate of junco fledglings for the first week after fledging in nests where fledge age was experimentally delayed had substantially lower mortality rate than fledglings from control (normal fledge age) nests and comparable to other species based on wing length. (E) Daily mortality rate of fledglings and nestlings when based on estimates per offspring versus per brood across eight species. The line represents equal fledgling and nestling mortality rates. (F) Nest predation influences evolution of fledging age and growth rates of offspring with consequences for relative development when young fledge, which thereby influences locomotor performance and fledgling mortality. Fledgling mortality, in turn, feeds back to further influence evolution of the age of fledging and traits that affect performance and mortality, but parents and offspring conflict on the optimal fledging age.
Fledgling mortality was significantly reduced for enclosed compared with control young (Fig. 6D), associated with the longer wings of delayed young (Fig. 6A). We conducted this delayed fledging experiment in 3 years that differed substantially in climate and environmental harshness and obtained similar treatment effects in every year. These results explain why mass was not important in modeling results, given that fledgling mortality decreased strongly in delayed young (Fig. 6D) but mass did not differ (Fig. 6A). Instead, the results reveal that flight ability is key for survival in fledglings of species that fledge at young ages, at least in this ecological system. Our field observations supported this conclusion. Flight performance of juncos at normal fledging age (Fig. 3) demonstrated that they could only support 22% of their body weight, and wing flapping only produced short hops and an ability to fly <0.5 m. In contrast, enclosed young that were released 3 days after normal fledging age were able to fly up to 30 m. This improved flight ability was associated with reduced rates of mortality, providing illuminating insight that variation in locomotor performance among species translates into fitness consequences in nature.
Given improved survival of junco fledglings with delayed fledging age and better developed wings (Fig. 6D), why have they not evolved a later age of fledging? The decrease in mortality with greater wing development within juncos (Fig. 6C) demonstrates strong natural selection for better developed wings, obtained from staying in the nest longer (Fig. 6A). Similarly, across species, later age of fledging yields better developed wings (Fig. 4A) that reduced the probability of fledgling mortality (Fig. 6D), such that natural selection again favors older ages of fledging to improve flight performance and reduce risk of fledgling mortality. The problem they face in evolving later age of fledging and better developed wings is the increased nest predation costs that accrue from staying in the nest, which exerts counterselection on fledging age (Fig. 2A) and associated performance (Fig. 3).
Parent-offspring conflict
Fledging age is also influenced by an unrecognized parent-offspring conflict (27). Natural selection should favor fledging at an age where mortality in the nest equals mortality after leaving the nest (see line in Fig. 6E). Yet, daily mortality probability per offspring is slightly higher for fledglings than for nestlings (orange symbols in Fig. 6E are above the line of equal mortality rates). These results indicate that nestlings are leaving earlier than is optimal based on selection at the individual level for offspring; leaving later increases risk of nest predation but allows increased wing development and reduced fledgling mortality to bring the rates onto the line equaling nestling predation rates (Fig. 6E). However, fitness for parents differs from offspring because parental fitness is influenced by survival of any offspring in the brood, and this can favor earlier nest departure. The daily probability of mortality of the brood, where all offspring of the brood die, was lower for fledglings than nestlings (blue symbols in Fig. 6E are below the line). This occurs because the entire sedentary brood is almost always eaten when a predator discovers a nest, whereas fledglings are dispersed in space and mobile [reviewed in the study of Martin (4)] such that predation is usually not of the entire brood. For example, only 9% of junco broods had the entire brood of fledglings lost to mortality, whereas 38% of entire broods of nestlings discovered by a predator were depredated in the nest. Loss of the entire brood yields no fitness benefits for parents, whereas survival of even one fledgling increases the probability of fitness benefits to parents. Thus, parents gain greater chances of fitness benefits by getting young out of the nest earlier, even at the cost of less optimally developed juveniles. Earlier fledging increases mortality of fledglings but decreases nest predation risk to bring the brood mortality rates onto the line of equal nestling and fledgling mortality rates (Fig. 6E). Parents can influence the decision to leave the nest by holding food away from the nest and encouraging young to leave the nest to obtain the food (21). However, parents are not in total control because begging young can also manipulate parents (28). Thus, offspring fledge at an age that is later than optimal from the parents’ perspective and earlier than optimal from an offspring’s perspective, yielding a compromise between parents and offspring that balances risk of mortality in versus out of the nest.
CONCLUSIONS
Ultimately, predation during an early life stage has been recognized to influence age of transition to the next life stage, with consequences for development of locomotor traits at transition among taxa (4, 16, 17, 21). We show that these effects have marked consequences for performance and mortality in the next life stage. In short, our results show that predation pressure upon juveniles in and out of the nest explains all components of the classic Morphology-Performance-Fitness paradigm (29). At the same time, the effect of development at transition on mortality in the next stage can feed back to further influence evolution of age of transition and phenotypic traits affecting mortality (Fig. 6F). Moreover, in taxa with parental care, like birds, a conflict between parents and offspring can further influence the age of transition (Fig. 6F). Juvenile mortality is an important influence on fitness and demography, but selection on traits to potentially mitigate mortality in one life stage can be constrained by selection acting on previous life stages. Consideration of the tension in mortality between life stages is critical for understanding evolution of transition age and locomotor traits and their consequences for the extensive variation in juvenile mortality across species.
MATERIALS AND METHODS
Study area
We studied 19 passerine species (Fig. 1) in north-central Arizona, USA (34°N) at about 2350-m elevation in mixed deciduous and coniferous forest (21, 30), although a subset of these species were studied for differing components of the work. Nest predation was studied for 31 years (1987–2017), and nestling growth was measured from 1999–2016. Flight performance was studied for 4 years (2013–2016), while fledgling mortality and enclosure experiments were studied for 3 years (2015–2017).
Nest predation, nestling growth, and development time measurements
Nest predation
Large numbers of nests were monitored following long-term protocols for species examined here (21, 30). Nests were generally checked every other day, but varying from 1 to 4 days to determine status and predation events. Nests were checked daily or twice daily near hatching and fledging to obtain exact nestling period durations and age of young at fledging. Fledging age was quantified as the number of days between the last egg hatched and the age of the last nestling to leave the nest (21). Nest predation was assumed when all nestlings disappeared more than 2 days before average fledging age, and parents could not be found feeding fledglings (21, 30).
Nestling growth and development time measurements
Nestlings were weighed using GemPro 250 portable electronic scales (MyWeigh) with an accuracy of ±0.001 g. Wing chord length was measured using Mitutoyo digital calipers with a precision of 0.01 mm. Nestlings were weighed and measured every day for the first 3 days starting on hatch day and then every other day, or simply every other day beginning on hatch or the day after hatch. We sought to measure wings and mass on fledge day, measuring each day near fledge age. If the young had fledged earlier in the morning before we got to a nest, we spent time finding and catching the young for measurements. We calculated relative wing development and relative mass as size at fledging as a proportion of adult size.
Flight performance measurements
We used drop tests to measure nestling capacity to generate weight support using wing flapping among 11 species (Fig. 1). The experiment consisted of holding a nestling in one hand, the animal’s ventral side down, wings closed, and holding a golf ball in the other hand. Both hands were elevated 1.5 m above a soft foam cushion. The animal and ball were dropped by opening each hand. These drop tests were recorded to digital video using a GoPro 3 or GoPro 4 camera set to narrow view, sampling at 120 frames s−1, and placed perpendicular to the drop trajectory at a distance of 2 ± 0.5 m. We were able to record under bright sunlight conditions, which permitted the cameras to record at sufficient shutter rates to avoid blurring of images of the animal’s head and body, as well as the golf ball.
We digitized the center of the head of the bird and the center of the ball using custom script (DLTdv5) (31) in MATLAB (v2015a, The MathWorks Inc.). To minimize unwanted effects of radial and tangential distortions imposed by the GoPro lenses, we limited our digitizing to the middle 75% of the fields of view. We used recently developed de-distortion software (Argus v1.0; Camera Calibrator app, Computer Vision Toolbox 8.0 in MATLAB) (32) to confirm that our results were not affected by lens distortion. After digitizing, we used IGOR Pro v6 to filter the data using smoothing splines (factor of 0.00005) and differentiate position with respect to frame number. This provided a velocity not scaled to metric coordinates (that is, Δpixels/Δframe) (vo). To calculate average nonscaled acceleration (ao) (Δpixels/Δframe/Δframe), we used a linear regression of vo with respect to frame number. To obtain the animal’s drop acceleration (aanimal) in SI units (meter per square second), we linearly transformed aanimal and the aball so that the aball = 9.805 m s−2, gravitational acceleration. Finally, we assessed flight ability as the capacity to support body weight by producing lift as 9.805 m s−2 − aanimal.
Drop tests were performed on one individual per nest beginning at pin break and continuing daily until fledging. We calculated average acceleration (n ≥ 3 tests) using the three highest values of aanimal for a given species obtained 0 to 2 days before fledging. Our results for drop tests represented average production of aerodynamic force to counteract gravity; regressing vo with respect to frame number averaged effects of instantaneous variation in this force.
Fledgling mortality measurements
We outfitted nestlings with very small (0.39 g) radio transmitters for eight songbird species (Fig. 1) in each of three study years. We used a leg-harness attachment method modified with elastic thread to allow expansion as young grow (33). We placed the radios on young in the nest 1 to 3 days before normal fledge age. We then sought to locate each young every day for 7 days following fledging. We focused on the 7 days following fledging because most mortality occurred within the first few days after young left the nest (4, 6, 7). The eight species were chosen to represent a gradient in fledge age (table S1). Larger species for which transmitters represented the smallest mass additions did not experience lower mortality; fledgling mortality did not vary with mass of species (R2 = 0.03, P = 0.69, n = 8 species), indicating that transmitter mass did not cause fledgling mortality.
Enclosure experiment
We enclosed nests of gray-headed juncos (J. hyemalis) to delay fledging age by 3 days and allow a test of the effect of older fledging age on survival. We used five gray 2.5-cm-diameter pvc (polyvinyl chloride) pipes that were 2.5 m in length and tied together at the top and spread out at the bottom to create a teepee-shaped frame with a 2-m-diameter base. We raised a lightweight tarp with camouflaged color around this frame which eventually enclosed the nest, with the bottom of the tarp buried with dirt to prevent fledglings from escaping. We first set up the frame and placed the tarp on the ground to allow parents time to habituate to the change. Then, over 3 days, we slowly raised the tarp around the frame to a final height of 2 m with a small opening at the top. We fixed natural branches at the top of the opening to allow parents to perch and examine the contained young below (Fig. 5). We found that parents entered much more readily with these branches than without. Parents were able to fly down and straight up to the perches at the opening 2 m high, whereas fledglings could not. Young fledged naturally from the nest but were retained in the enclosure around the nest until 3 days later, when we released them from the enclosure and followed their daily survival.
Statistical analyses
Growth rate estimation
We estimated growth rates of wing chord length using the logistic growth curve, where this approach estimates three parameters that are readily biologically interpretable based on the equation
where W(t) denotes wing chord length of a nestling at time t, A is the asymptotic length that nestlings approach, ti is the inflection point of the curve, and k is the instantaneous rate of growth at the inflection point (20, 30). The growth rate constant, k, is a standardized measure of peak growth rate that is independent of absolute time and is widely used (20, 30). Growth rates of wing chords were estimated on the basis of all years of growth data through 2016.
Nest predation rates
Daily nest predation rates of birds during the nestling period were estimated using the logistic exposure method (34) using R v3.1.2 for Windows (R Development Core Team). Nest predation was typically estimated at the level of the entire brood in the nest, as a function of the number of days a nest was observed being exposed to risk relative to the number of nests that were depredated. As such, predation was recorded when the entire brood was eaten (19). This approach has been used because the entire brood is almost always eaten when discovered by a predator. However, partial brood predation occurs on occasion. As a result, we also estimated nest predation at the level of individual nestlings on the basis of calculating exposure time and loss of individuals in each nest during the nestling period.
Fledgling mortality rates
We used multistate extensions of Cormack-Jolly-Seber models for live encounter data for open populations to estimate fledgling mortality of seven species in the MARK program (35, 36). The small radio transmitters used in this study had a limited range, and young sometimes could not be found in the mountainous terrain. These young were often found dead or alive on a later day, but not always. As a result, undetected individuals were assigned an unknown status. We included this unknown status as a third state in addition to live and dead and estimated survival using transition probabilities (Ψ) in a multistate model (37). We also estimated fledgling survival for gray-headed juncos using the multistate approach above but included treatment (control and enclosure), mass, and wing length as covariates to examine their influence on variation in fledgling survival. We used Akaike’s information criteria, with adjustment for small sample sizes (AICc) for model selection (36).
Finally, like nestling predation, we also calculated fledgling daily mortality at the level of the brood. We used a known-fate model implemented in MARK (35, 36) to estimate daily mortality for broods across all eight species. In this analysis, mortality of the brood was defined as “dead” when all fledglings of the brood died.
Correction for phylogenetic effects
We corrected for phylogenetic effects in all analyses using PGLS analyses with the Caper (38) package in R v3.0.3 for Windows (R Development Core Team). Phylogenetic trees were obtained from www.birdtree.org (39) and imported into Mesquite (40), where a majority-rule consensus tree was constructed on the basis of 500 trees (Fig. 1). This consensus tree was then used in phylogenetically controlled analyses that incorporated Pagel’s λ to transform branch lengths and reduce overcorrection for phylogenetic effects (21). All PGLS analyses across species yielded a λ that did not differ from 0 but differed from 1.0, indicating minimal phylogenetic effects on results. Nonetheless, we reported PGLS results in all cases to ensure that phylogeny did not bias results.
Supplementary Material
Acknowledgments
We thank E. Greene, A. Mitchell, J. Mouton, J.C. Oteyza, and N. Wright for helpful comments. Funding: This work was supported by the NSF (DEB-1241041, CMMI-1234737, IOS-1349178, IOS-1656120,and DEB-1651283) and was conducted under auspices of University of Montana Institutional Animal Care and Use Committee #059-10TMMCWRU. Any use of trade, firm, or product names is for descriptive purposes only and does not imply endorsement by the U.S. Government. Competing interests: The authors declare that they have no competing interests. Author contributions: T.E.M. conceived the overarching study questions and designs in consultation with B.T. and K.P.D. T.E.M. wrote the initial draft of the manuscript, and all authors contributed to revisions. All authors contributed to data collection. B.T. and K.P.D. provided flight performance estimates. T.E.M., M.M.R., and S.B.C. designed the enclosure and collected the data for the delayed fledgling experiment. M.M.R. conducted the fledgling mortality analyses. T.E.M. conducted all other analyses of relationships presented in the manuscript. Data and materials availability: Data are available in Dryad: doi:10.5061/dryad.kv206p0; data files: Juvenile mortality performance data.
SUPPLEMENTARY MATERIALS
Supplementary material for this article is available at http://advances.sciencemag.org/cgi/content/full/4/6/eaar1988/DC1
table S1. Average fledging ages and numbers of fledglings followed with radio transmitters to determine fledgling mortality rates for eight songbird species.
REFERENCES AND NOTES
- 1.Promislow D. E. L., Harvey P. H., Living fast and dying young: A comparative analysis of life-history variation among mammals. J. Zool. 220, 417–437 (1990). [Google Scholar]
- 2.Gosselin L. A., Qian P.-Y., Juvenile mortality in benthic marine invertebrates. Mar. Ecol. Prog. Ser. 146, 265–282 (1997). [Google Scholar]
- 3.Eckert G. J., Estimates of adult and juvenile mortality for labrid fishes at One Tree Reef, Great Barrier Reef. Mar. Biol. 95, 167–171 (1987). [Google Scholar]
- 4.Martin T. E., A conceptual framework for clutch-size evolution in songbirds. Am. Nat. 183, 313–324 (2014). [DOI] [PubMed] [Google Scholar]
- 5.Smith S. M., Seasonal changes in the survival of the Black-capped Chickadee. Condor 69, 344–359 (1967). [Google Scholar]
- 6.Sullivan K. A., Predation and starvation: Age-specific mortality in juvenile juncos (Junco phaenotus). J. Anim. Ecol. 58, 275–286 (1989). [Google Scholar]
- 7.Yackel-Adams A. A., Skagen S. K., Savidge J. A., Modeling post-fledging survival of Lark Buntings in response to ecological and biological factors. Ecology 87, 178–188 (2006). [DOI] [PubMed] [Google Scholar]
- 8.Suedkamp Wells K. M., Ryan M. R., Millspaugh J. J., Thompson F. R. III, Hubbard M. W., Survival of postfledging grassland birds in Missouri. Condor 109, 781–794 (2007). [Google Scholar]
- 9.Jayne B. C., Bennett A. F., Selection on locomotor performance capacity in a natural population of garter snakes. Evolution 44, 1204–1229 (1990). [DOI] [PubMed] [Google Scholar]
- 10.Carrier D. R., Ontogenetic limits on locomotor performance. Physiol. Zool. 69, 467–488 (1996). [Google Scholar]
- 11.Munch S. B., Conover D. O., Rapid growth results in increased susceptibility to predation in Menidia menidia. Evolution 57, 2119–2127 (2003). [DOI] [PubMed] [Google Scholar]
- 12.Miles D. B., The race goes to the swift: Fitness consequences of variation in sprint performance in juvenile lizards. Evol. Ecol. Res. 6, 63–75 (2004). [Google Scholar]
- 13.Langerhans R. B., Layman C. A., Shokrollahi A., DeWitt T. J., Predator-driven phenotypic diversification in Gambusia affinis. Evolution 58, 2305–2318 (2004). [DOI] [PubMed] [Google Scholar]
- 14.Heers A. M., Dial K. P., Wings versus legs in the avian bauplan: Development and evolution of alternative locomotor strategies. Evolution 69, 305–320 (2015). [DOI] [PubMed] [Google Scholar]
- 15.Irschick D. J., Measuring performance in nature: Implications for studies of fitness within populations. Integr. Comp. Biol. 43, 396–407 (2003). [DOI] [PubMed] [Google Scholar]
- 16.Benard M. F., Predator-induced phenotypic plasticity in organisms with complex life histories. Annu. Rev. Ecol. Evol. Syst. 35, 651–673 (2004). [Google Scholar]
- 17.Relyea R. A., Getting out alive: How predators affect the decision to metamorphose. Oecologia 152, 389–400 (2007). [DOI] [PubMed] [Google Scholar]
- 18.Nice M. M., Nesting success in altricial birds. Auk 74, 305–321 (1957). [Google Scholar]
- 19.Martin T. E., Avian life history evolution in relation to nest sites, nest predation and food. Ecol. Monogr. 65, 101–127 (1995). [Google Scholar]
- 20.Remeŝ V., Martin T. E., Environmental influences on the evolution of growth and developmental rates in passerines. Evolution 56, 2505–2518 (2002). [DOI] [PubMed] [Google Scholar]
- 21.Martin T. E., Age-related mortality explains life history strategies of tropical and temperate songbirds. Science 349, 966–970 (2015). [DOI] [PubMed] [Google Scholar]
- 22.Dial K. P., Randall R. J., Dial T. R., What use is half a wing in the ecology and evolution of birds? Bioscience 56, 437–445 (2006). [Google Scholar]
- 23.Bachman G. C., The effect of body condition on the trade-off between vigilance and foraging in Belding’s ground squirrels. Anim. Behav. 46, 233–244 (1993). [Google Scholar]
- 24.Hall Ailsa J., McConnell Bernie J., Barker Richard J., Factors affecting first-year survival in grey seals and their implications for life history strategy. J. Anim. Ecol. 70, 138–149 (2001). [Google Scholar]
- 25.Coulson T., Albon S., Guinness F., Pemberton J., Clutton-Brock T., Population substructure, local density, and calf winter survival in red deer (Cervus elaphus). Ecology 78, 852–863 (1997). [Google Scholar]
- 26.Remeš V., Matysioková B., Survival to independence in relation to pre-fledging development and latitude in songbirds across the globe. J. Avian Biol. 47, 610–618 (2016). [Google Scholar]
- 27.Trivers R. L., Parent-offspring conflict. Am. Zool. 14, 249–264 (1974). [Google Scholar]
- 28.Johnstone R. A., Begging signals and parent-offspring conflict: Do parents always win? Proc. R. Soc. London B 263, 1677–1681 (1996). [Google Scholar]
- 29.Arnold S. J., Morphology, performance and fitness. Am. Zool. 23, 347–361 (1983). [Google Scholar]
- 30.Martin T. E., Oteyza J. C., Mitchell A. E., Potticary A. L., Lloyd P., Postnatal growth rates covary weakly with embryonic development rates and do not explain adult mortality probability among songbirds on four continents. Am. Nat. 185, 380–389 (2015). [DOI] [PubMed] [Google Scholar]
- 31.Hedrick T. L., Software techniques for two- and three-dimensional kinematic measurements of biological and biomimetic systems. Bioinspir. Biomim. 3, 034001 (2008). [DOI] [PubMed] [Google Scholar]
- 32.Jackson B. E., Evangelista D. J., Ray D. D., Hedrick T. L., 3D for the people: Multi-camera motion capture in the field with consumer-grade cameras and open source software. Biol. Open 5, 1334–1342 (2016). [DOI] [PMC free article] [PubMed] [Google Scholar]
- 33.Dreitz V. J., Baeten L. A., Davis T., Riordan M. M., Testing radiotransmitter attachment techniques on northern bobwhite and chukar chicks. Wildl. Soc. Bull. 35, 475–480 (2011). [Google Scholar]
- 34.Shaffer T. L., A unified approach to analyzing nest success. Auk 121, 526–540 (2004). [Google Scholar]
- 35.White G. C., Burnham K. P., Program MARK: Survival estimation from populations of marked animals. Bird Study 46, S120–S139 (1999). [Google Scholar]
- 36.K. P. Burnham, D. R. Anderson, Model Selection and Multimodel Inference: A Practical Information-Theoretic Approach (Springer-Verlag, 2002). [Google Scholar]
- 37.Riordan M. M., Lukacs P. M., Huyvaert K. P., Dreitz V. J., Sex ratios of Mountain Plovers from egg production to fledging. Avian Cons. Ecol. 10, 3 (2015). [Google Scholar]
- 38.D. Orme, The caper package: Comparative analysis of phylogenetics and evolution in R (2013); http://cran.r-project.org/web/packages/caper/vignettes/caper.pdf [accessed 20 August 2017].
- 39.Jetz W., Thomas G. H., Joy J. B., Hartmann K., Mooers A. O., The global diversity of birds in space and time. Nature 491, 444–448 (2012). [DOI] [PubMed] [Google Scholar]
- 40.W. P. Maddison, D. R. Maddison, Mesquite: A modular system for evolutionary analysis. Version 2.75 (2011); http://mesquiteproject.org.
Associated Data
This section collects any data citations, data availability statements, or supplementary materials included in this article.
Supplementary Materials
Supplementary material for this article is available at http://advances.sciencemag.org/cgi/content/full/4/6/eaar1988/DC1
table S1. Average fledging ages and numbers of fledglings followed with radio transmitters to determine fledgling mortality rates for eight songbird species.


