

Abstract
Toxicological responses to stressors are more complex than the simple one biological perturbation to one adverse outcome model portrayed by individual adverse outcome pathways (AOPs). Consequently, the AOP framework was designed to facilitate de facto development of AOP networks that can aid understanding and prediction of pleiotropic and interactive effects more common to environmentally realistic, complex exposure scenarios. The present paper introduces nascent concepts related to the qualitative analysis of AOP networks. First, graph theory-based approaches for identifying important topological features are illustrated using two example AOP networks derived from existing AOP descriptions. Second, considerations for identifying the most significant path(s) through an AOP network from either a biological or risk assessment perspective are described. Finally, approaches for identifying interactions among AOPs that may result in additive, synergistic, or antagonistic responses, or previously undefined emergent patterns of response, are introduced. Along with a companion article (Knapen et al. part I), these concepts set the stage for development of tools and case studies that will facilitate more rigorous analysis of AOP networks, and the utility of AOP network-based predictions, for use in research and regulatory decision-making. Collectively, this work addresses one of the major themes identified through a SETAC Horizon Scanning effort focused on advancing the AOP framework.
Keywords: Adverse outcome pathway, risk assessment, predictive toxicology, mixture toxicology, AOP network, network topology, interactions
Graphical abstract
1. Introduction
The adverse outcome pathway (AOP) framework uses a modular structure to organize information concerning the linkage between a molecular-level perturbation of a biological system and the adverse outcome(s) that perturbation may cause. The modular structure is composed of two basic units, key events (KEs) and key event relationships (KERs) (Villeneuve et al. 2014a). These units are linked together in defined sequences (i.e., AOPs) that describe a series of measureable biological changes (KEs) reflecting progression from a specific molecular initiating event (MIE) to a defined adverse outcome, and the scientific evidence that supports the relationships (KERs) between those changes. Each AOP can be viewed as one biologically plausible, and scientifically defensible, chain of events that can lead from a defined biological perturbation to an adverse outcome. However, as more AOPs are described, systems or assemblages of interconnected AOPs that share one or more KEs emerge. These assemblages are termed AOP networks (Knapen et al. 2018).
As part of a Society of Environmental Toxicology and Chemistry (SETAC) sponsored workshop focused on advancing the AOP framework, development and application of AOP networks was identified as one of the major themes that emerged from review of over 300 questions submitted by the scientific, risk assessment and regulatory communities (LaLone et al. 2017). In part I of this set of papers, Knapen et al. (2018) highlight the distinction between network guided AOP development on the one hand, which follows the principles outlined for development of individual AOP descriptions, and deriving AOP networks from available information in the AOP knowledgebase on the other hand (Society for Advancement of AOPs [SAAOP] 2017). Data layers, analogous to those employed in geographic information systems, were proposed as a way to capture and represent biological complexity underlying AOPs and influencing their dynamics (e.g., feedback/feedforward loops; modulating factors), without overly complicating the basic AOP framework. Filters and information layers derived from structured fields in the AOP knowledgebase were proposed as useful techniques for customizing the global AOP network. Finally, filtering and layering concepts were applied in a number of case studies to demonstrate how AOP networks can be built to provide answers to different types of questions (Knapen et al. 2018).
The present manuscript builds on the concepts described by Knapen et al. (2018) and focuses more sharply on the issue of AOP network application in risk assessment, research, and decision-making. In particular, it seeks to address how the network structure itself may be analyzed to derive information that can guide research and regulatory decision-making. First, we consider the similarities and distinctions between AOP networks and other types of complex networks that are commonly analyzed using techniques from graph theory (Trudeau 2013) and network science (Lewis 2009). The application of a number of topology-based (Supporting Information, Box 1) network analyses, and how they can guide understanding of potential interactions among AOPs, as well as assay development and/or design of alternative testing strategies (e.g., IATA; Worth and Patlewicz 2016) is illustrated using two example AOP networks. We then discuss how different strategies may be used to identify the most important paths, called critical paths, (Supporting Information, Box 1) through AOP networks. Finally, we explore how AOP networks can provide first order, qualitative, insights into the potential interactions among AOPs, as well as the underlying ontological challenge that must be addressed to facilitate those analyses. More quantitative applications of AOP networks entailing incorporation of stressor-specific data and detailed consideration of response-response relationships defining transition from one KE to the next in an AOP network are not addressed here. Together with the concepts and case studies presented by Knapen et al. (2018), these examples address prominent questions and themes (LaLone et al. 2017) concerning AOP networks and their general application.
2. AOPs as Networks
The term network broadly refers to any type of interconnected group. Many different types of networks can be represented graphically as systems of nodes (generally represented as dots or shapes) and edges (generally represented as lines) (Table 1; Newman 2003; Lewis 2009; Trudeau 2013). The modular structure of the AOP framework (i.e., KEs and KERs that can be re-used in different AOPs) was developed with the construction of networks in mind (Villeneuve et al. 2014a; Organisation for Economic Co-operation and Development [OECD] 2016a). In the case of AOP networks, KEs are represented as nodes and KERs as directed edges (arrows).
Table 1.
Examples of networks that are commonly represented graphically as systems of nodes and edges.
| Network Type | Nodes | Edges |
|---|---|---|
| Transportation | Stations | Routes between stations |
| Computer | Computers and servers | Data transmission |
| Social | People | Relationships |
| Molecular Biology | Genes, proteins | Interactions |
| Ecological/Food Web | Species | Energy Flow |
| AOP | Key Events | Key Event Relationships |
There are common sets of principles and tools based in the mathematical study of graphs (graph theory; Pavlopoulas et al. 2011) and network science (Newman 2003; Caldarelli and Catanzaro 2012) that may be productively applied to analyze networks, including AOP networks. In fact, many network science-based tools have already become familiar to biologists and toxicologists, where networks and network science have increasingly been used to represent and analyze molecular interactions or statistical associations between transcripts, genes, proteins, metabolites, and their regulatory factors. However, there are some important distinctions between AOP networks and other types of biological networks that should be kept in mind (Table 2). First, in an AOP network, each node (KE) represents a measurable change (e.g., an increase or decrease) in the abundance of an object or state of a process compared to a reference, such as a control. As a result, a decrease in a hormone concentration, enzyme activity, heart rate, etc. is represented as a separate KE from an increase in that hormone, enzyme activity, or heart rate. This has implications for how AOP networks are constructed and analyzed and how data may be layered on top of them. Second, most biological networks describe interactions at a single level of biological organization. AOP networks, by definition, span multiple levels of biological organization. Finally, AOPs and AOP networks are focused on predictive utility over biological fidelity. AOPs and AOP networks are intended to help accurately predict how a system will respond to perturbation – even if that involves some degree of abstraction, simplification, or implicit embedding of more extensive biological understanding or structures within the KEs and KERs represented. The objects (e.g., genes, proteins, cells, organs) included in an AOP description and measured as KEs may often be the minimum set needed to support extrapolation or inference along the AOP. Detailed mechanistic understanding is only needed to the extent it supports confidence in application. If the weight of correlative evidence is sufficient, an AOP can be collapsed to relatively few KEs. As a result, there is considerable subjectivity associated with the number of KE nodes that may be used to describe the path from an MIE to AO.
Table 2.
Distinctive attributes of AOP networks compared to other types of biological networks (e.g., gene, protein, metabolite interaction networks; cell signaling networks).
| Attribute | “Typical” biological networksa | AOP Networks |
|---|---|---|
| Nodes | Discrete objects (e.g., a transcript, a protein, a cell, a species) | A measureable change in state (i.e., an increase or decrease) of an object or process (e.g., enzyme activity, circulation, behavior) compared to a reference state (e.g., a control) |
| Edges | Represent interactions at the same level of biological organization. | Often involve transition from one biological level of organization to another. |
| Intended Fidelity | Representational focus – intended to accurately reflect the true/real structure of the system. | Dynamical focus – intended to accurately represent and predict how a system will respond to perturbation – even if that involves some degree of abstraction, simplification, or implicit embedding more detailed underlying systems understanding. |
Typical of many biological networks; exceptions can be expected.
In order to help illustrate the analyses and applications detailed in this paper, two AOP networks were derived from existing AOP descriptions within the AOP knowledgebase (SAAOP 2017; Supplementary Text SI.1). For the first example, AOP 25 (aromatase inhibition leading to reproductive dysfunction; Villeneuve 2017) was used as a seed AOP and an AOP network was derived to include all AOPs that shared at least one KE with AOP 25 (Figure 1; here-after referred to as CYP19-AOP network). Note, that for the purposes of constructing the CYP19-AOP network, KEs representing an opposite action (increase or decrease) on the same biological object or process were included. The second network (Figure 2; hereafter referred to as T4-AOP network) was generated by searching the AOP-Wiki (SAAOP 2017) for the term T4 (thyroxine, one of the thyroid hormones). The list of AOPs to include was compiled from the resulting AOP full text search results and an AOP network constructed from the list of KERs associated with those AOPs (Supplementary Text SI.1). While many of the topological analyses, identification of critical paths, and consideration of interactions associated with these networks can be accomplished rather intuitively by visual inspection, these relatively simple examples help to demonstrate how various computational approaches could aid the analysis of more complex AOP networks. They also help to highlight some of the challenges and limitations associated with analysis of AOP networks.
Figure 1.
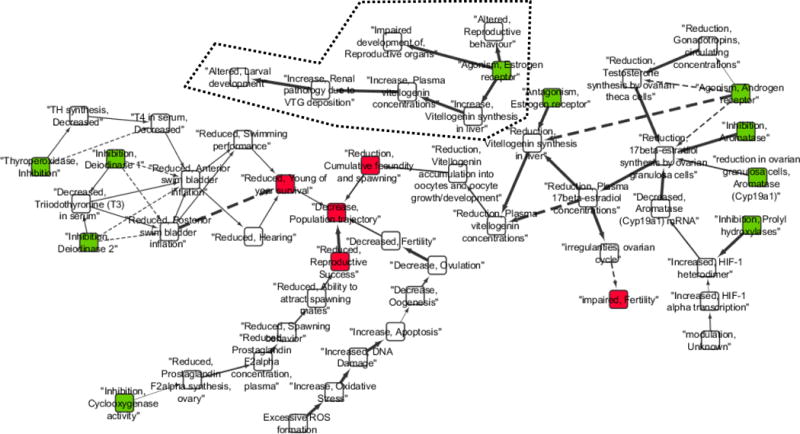
Example adverse outcome pathway (AOP) network 1 (CYP19-AOP network). Network of all adverse outcome pathways (AOPs) in the AOP-Wiki [4] that share at least one key event (KE) with those in AOP 25 [18]. Rounded rectangles indicate KEs. Arrows indicate key event relationships (KERs) with the arrow emanating out of the upstream KE and into the downstream KE. Molecular initiating events are colored green. Adverse outcomes are colored red. Solid lines indicate relationships between KEs that are adjacent in the sequence described in the AOP, while dashed lines indicate non-adjacent relationships. Arrow thickness indicates strength of evidence as defined in the AOP-wiki for each KER, where were weak = thinnest arrows, strong = thickest arrows, moderate = mid-sized arrows. A dotted line outlines a disconnected portion of the network. Unless noted otherwise, all KE titles and relationship information are directly as defined in the AOP-Wiki (Society for Advancement of AOPs 2017; AOPs 25, 7, 23, 122, 123, 30, 29, 100, 155, 156, 157, 158, 159, 216; Supplementary Information Table S.1). KERs shared by more than one AOP are shown as non-redundant (i.e., represented by a single arrow).
Figure 2.
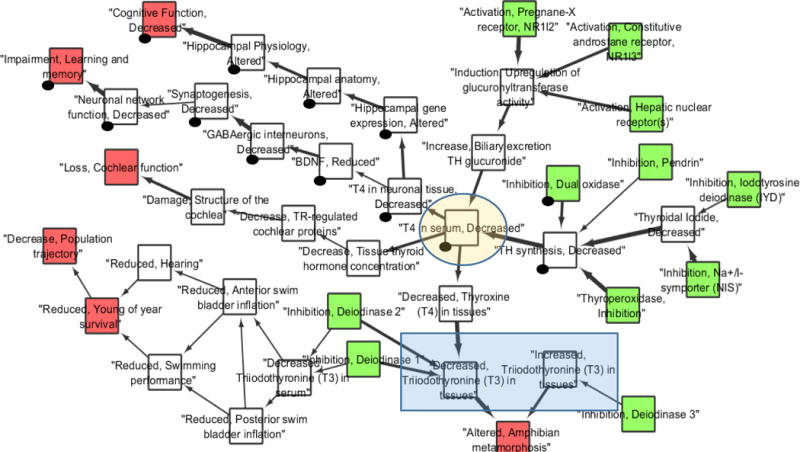
Example adverse outcome pathway (AOP) network 2 (T4-AOP network). Network of fourteen adverse outcome pathways (AOPs) related to disruption of thyroid hormone signaling (Society for Advancement of AOPs 2017; AOPs 8, 42, 54, 155, 156, 157, 158, 175, 188, 189, 190, 191, 192, 193; Supplementary Information Table S.2). Squares indicate key events (KE). Arrows indicate key event relationships (KERs) with the arrow emanating out of the upstream KE and into the downstream KE. Key event relationships linking non-adjacent KEs were filtered out of this network and, KERs shared by more than one AOP are shown as non-redundant (i.e., represented by a single arrow). Additionally, in order to improve overall connectivity, the network was curated slightly with regard to titles and relationship information defined in the AOP-Wiki (see supplementary information Table S.3 for details). [A] Network overview. Molecular initiating events are colored green. Adverse outcomes are colored red. Arrow thickness indicates strength of evidence as defined in the AOP-wiki for each KER, where were weak = thinnest arrows, strong = thickest arrows, moderate = mid-sized arrows. A shaded circle highlights a KE that serves as the knot of a bow-tie motif within the network. A sequence of black dots highlights two examples of AOPs not described in the AOP-Wiki that “emerge” through network connectivity. A blue shaded rectangle highlights two KEs that represent the same object, but different actions (SODAs) within the AOP network.
Indeed, there are significant limitations that need to be kept in mind whenever applying and interpreting AOP networks. First and foremost, among those is recognition that AOP networks are limited by the scope of knowledge and relationships currently captured in the AOP knowledgebase. The connections reflected in an AOP network are only those for which AOP descriptions have been developed. One cannot necessarily infer that a highly connected KE in an AOP network is more biologically important than a less connected KE. It may simply reflect that fact that more extensive AOP development was centered around a particular KE than others. Similarly, there is no objective way to define how many KEs to include in a given AOP description (Villeneuve et al. 2014b). The level of abstraction or biological resolution to include in the AOP description is determined by the individual AOP developer, the scope of available data, and perception of the detail required to support application. Thus, in applying the approaches discussed below, it is important to remember that AOPs are not necessarily comprehensive representations of the biological system(s) that may be impacted by a given stressor or combination of stressors. Likewise, with the exception of AOPs that have gone through a formal OECD review process, or have been published in a peer-reviewed journal prior to, or in conjunction with, entry into the AOP-Wiki there is no explicit quality assurance for AOPs in the AOP-Wiki. Rather, the AOP-Wiki relies on feedback from the scientific community for quality control (Hecker et al. 2018). Thus interpretations based on AOP networks need to be made with caution and in consideration of the quality and completeness of the underlying information.
3. AOP Network Analytics: Network Topology
An AOP network effectively describes/represents a set of scientifically credible possibilities concerning (1) the diversity of biological perturbations that may cause a defined biological effect (e.g., an AO), and/or (2) the diversity of effects that may result from a stressor-induced biological change (e.g., a MIE). It also lays out the conditions under which one possibility or another can be expected, noting that the various possibilities are not necessarily mutually exclusive. While the detailed description of the underlying support for those possibilities is found in the descriptions of the individual AOPs, KEs, and KERs (OECD 2016a; SAAOP 2017), a lot of information can be derived through examination and analysis of the overall structure of the network (i.e., the network topology). Conceptually, some of this information can already be gleaned from visual examination of the network graph and it is recognized that often an appropriate visualization and layout of a network is a critical step in understanding (Newman 2003). However, as the networks become larger and more complex, it will be increasingly necessary to use various graph theory-based tools and computational algorithms to identify important and informative topological features. For computational purposes, AOP networks can be represented in a variety of forms such as adjacency matrices or from-to matrices (See Supplementary Files). These can be readily processed using various software developed for network analyses (e.g., Cytoscape, the graph, RBGL, and Rgraphviz packages in Bioconductor, etc.). Custom tools specifically designed for analysis of AOP networks, such as the AOP-Xplorer (Burgoon 2017) are also under development.
3.1.Identifying points of convergence/divergence
Paths between KEs within the AOP network can be described as either convergent, divergent, or mixed (Knapen et al. 2018). Identifying convergent and divergent topologies are some of the most obviously useful analyses that one might apply to an AOP network. In a convergent topology (Supporting Information, Box 1), KEs from two or more AOPs are directed toward a common downstream KE (which could be the AO). Convergent motifs can help identify AOPs that may contribute in a joint manner toward the same outcome(s), suggesting potential additive or even synergistic effects if the upstream pathways are activated. In contrast, divergent structures branch off from a common KE toward a range of possible outcomes and can, for example, help define the pleiotropic effects a particular MIE or perturbation may have either within an individual organism, or across different biological contexts (e.g., taxa, life stages, sexes, etc.). KEs that represent points of convergence in an AOP network (coined convergent KEs, Knapen et al. 2018) could represent highly integrative endpoints that can detect the influences of a number of upstream perturbations. In contrast, a KE that serves as a point of divergence may be a measurement with particularly high predictive utility. Viewed from a drug development perspective, design of a drug that prevents a KE representing a point of convergence in an AOP network could potentially treat the effects of a range of upstream contributors to a disease state. Conversely, examining AOPs that diverge from a KE that could be elicited by a drug treatment could help to identify potential side-effects. Mixed structures may be characterized by points of convergence in the network that then diverge to a range of possible downstream outcomes. This can often result in a “bow-tie” motif that is characteristic of many biological signaling networks, where the “knot” in the bow-tie often represents an important integrative biological signal (Friedlander et al. 2015). In the T4-AOP network for example, the KE “T4 in serum, Decreased” (AOP-Wiki, Event 281; SAAOP 2017) represents the “knot” in a bow-tie motif (Figure 2). In the case of an AOP network, KEs at the center of a bow-tie structure may represent a particularly important measurement that is frequently made in toxicological studies, an important control point in the biological system, or a biological change of particular interest to one or more AOP developers and potentially to risk assessors.
Computationally, points of convergence or divergence in an AOP network can be identified and quantified by various node ranking and “centrality” measures (Supporting Information, Box 1; Huber et al. 2007; Pavlopoulos et al. 2011). For an AOP network, the “degree” (Table 3) of any KE is defined by the number of unique KERs it is linked to (Supplementary Tables S.4, S.5). For example, in the CYP19-AOP network the KE “Reduction, 17beta-estradiol synthesis by ovarian granulosa cells” (AOP-Wiki Event 3; SAAOP 2017) is linked to six unique KERs (Figure 3A; Supplementary Table S.4). Additionally, because all the KERs in an AOP network are directed, the degree of each KE node in an AOP network can be further broken down in terms of the number of upstream (degreein) or downstream (degreeout) KEs it is linked to via KERs. The KE “Reduction, 17beta-estradiol synthesis by ovarian granulosa cells”, is downstream of five KEs, but upstream of just one (Figure 3A; Supplementary Table S.4), therefore it would be a point of convergence in the AOP network. Key events linked to more upstream than downstream KEs (degreein>degreeout) can be broadly viewed as points of convergence in an AOP network, while those linked to more downstream than upstream KEs (degreeout > degreein) represent points of divergence.
Table 3.
Overview of graph theory-based network analyses and their potential application(s) to adverse outcome pathway (AOP) network analysis.
| Analysis/Metric | Description | Potential Use(s) |
|---|---|---|
| Node degree (degreein) (degreeout) | The number of KERs linked to a KE. For directed networks, including AOP networks, can be broken down into degreein and degreeout, where degreein indicates the number of connections to upstream KEs, and degreeout indicates the number of connections to downstream KEs. | Identify highly connected KEs within the overall AOP network. Identify points of convergence and/or divergence in the AOP network. |
| Betweenness centrality | Measure of the number of shortest paths between any KEs (j, k) in the AOP network that pass through the KE of interest (i) (Kitsak et al. 2007). Betweenness centrality is defined as: Where σst (v) is # of shortest paths from s to t through KE v and σst is # of shortest paths from s to t. |
Identify important points of convergence/divergence in AOP networks. KEs with high betweenness may represent measurements that are frequently made, critical control nodes within biological systems, or biological changes of particular interest to one or more groups involved in AOP development. |
| AOP Simple Path Occurrence | A variation on betweenness centrality that only considers the shortest path between MIEs and AOs, not between all pairs of KEs in the network. AOP Simple Path Occurrence is defined as: Where σma (v) is the number of shortest paths from m to a through node v. M is the set of molecular initiating events, and A is the set of adverse outcomes. Note, as for betweenness centrality (above), this calculation can also be normalized to the total number of shortest MIE to AO paths in network. Normalized AOP Simple Path Occurrence: |
Identify important points of convergence/divergence in AOP networks. Identify KEs with high predictive value in terms of connecting many upstream MIEs to downstream AOs. |
| Topological Sorting | A topological sort (or ordering) is a linear arrangement of the KEs of an AOP network such that for every KER {Kei, KEj}upstream KEi appears before downstream KEj in the arrangement (Skiena 1990; Weisstein 2017). This sorting can only be applied if there are no cycles in the network, such that KEi could appear both before and after another KEj. |
Topological sorting can be useful for identifying the relative proximity of a KE in the network to the MIE (origin) or AO (terminus) of the AOPs it intersects with. |
| Eccentricity | The maximum shortest path length between KEi and another KEj in the network. Note, eccentricity is distinct from “eccentricity centrality” which is the inverse. (Pavlopoulos et al. 2011; Cytoscape 2017; Netzwerkin 2017) |
Useful for identifying the most upstream and downstream KEs in the network. Can also help identify upstream KEs that are connected to AOPs for which larger numbers of KEs have been defined. |
| Contraction | Identifies and removes cycles from the network, generating a graph which can be analyzed using algorithms applicable only to acyclic graphs. | Identification of cycles in an AOP network that may represent important features such as positive or negative feedback loops or modulating factors intrinsic to the AOP network. |
| Connectivity | A metric that indicates the number of connected components relative to the overall size of the network, where E = the number of KERs and N= the number of KEs. |
The overall connectivity within an AOP network may indicate the relative potential for known complex interactions, and thus the potential uncertainty in predicting outcomes along those networks. |
| Matching Index | A measure of how similar two KEs are within an AOP network based on the number of common neighbors they share. When nc = neighbors common to KEi and KEj, and nt = total neighbors of KEi and KEj (Pavlopoulos et al. 2011). |
Can be used to cluster KEs that are connected to similar upstream and/or downstream biology within an AOP network and sort KEs based on similarities in toxicological function. |
Figure 3.
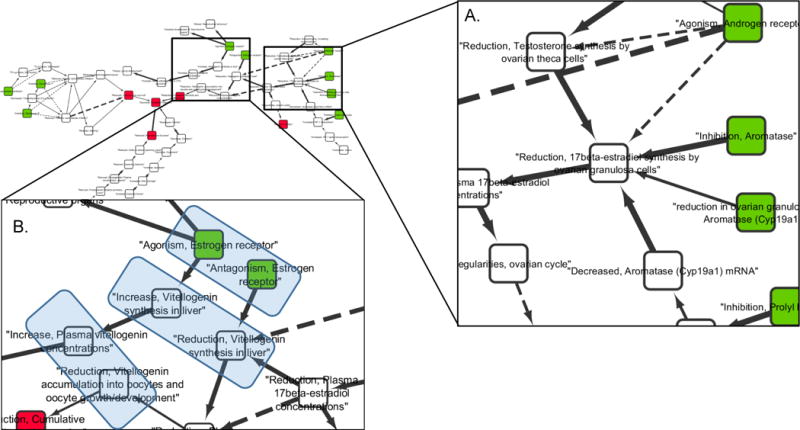
Adverse outcome pathway (AOP) network example 1 (CYP19-AOP network) with view zoomed in on key features. [A] Zoomed in view illustrating degree for the key event (KE) titled “Reduction, 17beta-estradiol synthesis by ovarian granulosa cells” (AOP-Wiki, Event 3; Society for Advancement of AOPs 2017). [B] Zoomed in view of several pairs of KEs, highlighted by blue boxes, that represent the same object, but different actions (SODAs) within the AOP network.
It can also be informative to consider how many paths through the network pass through any given KE. In graph theory this is referred to as “betweenness” (Table 3; Supplementary Figure S.5; Tables S.5, S.6). Traditionally betweenness calculations consider the number of shortest paths, between every pair of nodes in the entire network, that has to pass through the node in question. However, in the context of an AOP network, the paths between MIEs and AOs, rather than just any two KEs in the network, are of particular interest. Consequently, we derived a variation on the betweenness calculation that considers KEs specifically with regard to the number of paths between an MIE and AO that pass through them using custom R code (AOP Simple Path Occurrence; Table 3). Based on this calculation, we can see that for the T4-AOP network (Figure 2), “T4 in serum, Decreased” (AOP-Wiki Event 281; SAAOP 2017) has the greatest AOP Simple Path Occurrence (Supplementary Figure S.6), while in the main connected portion of the CYP19-AOP network (Figure 1), “Decreased, population trajectory” (AOP-Wiki Event 360; SAAOP 2017) has the greatest AOP Simple Path Occurrence (Supplementary Figure S.7). Key events with high AOP Simple Path Occurrence are likely to be “hubs” in the overall AOP network and thus may be particularly useful to measure or to manipulate experimentally.
3.2. Eccentricity and topological sorting
The intent of topological sorting (Table 3) is to order the nodes in a directed network such that earlier nodes in a sequence are listed or displayed before later nodes when arranged in a line. Individual AOPs are inherently sorted this way based on the sequence of cause-effect relationships they outline. Consequently, for a single AOP or a small AOP network the causal sequence of KEs is easy to discern based on the KERs (arrows). However, as the AOP networks grow in size, even when the MIEs and AOs are highlighted (e.g., color in Figures 1 and 2) it can become increasingly difficult to identify where various KEs lie in terms of relative position along the sequence(s) from MIE to AO. Likewise, it can be difficult to pick out which KEs even lie along the paths that can trigger a given AO. However, there are a number of computational approaches that can help reveal the ordering and relationships among KEs represented in the network.
Calculation of KE “eccentricity” (Table 3) is one approach that can be used to discriminate MIEs or the furthest upstream KEs from AOs or the furthest downstream KEs (Supplementary Figure S.8; Supplementary Tables S.8, S.9). Because AOP networks are directed networks, the farther downstream a KE is, the greater its eccentricity score will be (and the lower the inverse, eccentricity centrality will be), as it is increasingly difficult to draw a directional path from it to another KE in the network. However, because calculation of eccentricity is dependent on path length, a somewhat subjective result of the number of KEs an AOP developer includes in an AOP description, the results can be misleading if there are AOPs with a wide range of different lengths (numbers of KEs included) in the network. For example, in the T4-AOP network, even though “Inhibition, Deiodinase 3” (AOP-Wiki, Event 1153; SAAOP 2017) is an MIE, it has a lower eccentricity score than many other KEs in the network because one can only draw a path to two other KEs in the network before reaching a terminal AO (Supplementary Figure S.8).
Topological sorting (Skiena 1990; Weisstein 2017; Table 3) is an alternative approach for ordering KEs based on their causal and dependent relationships that is less impacted by subjectively defined path lengths (Figure 4; Supplementary Figures S.9, S.10). While topological sorting can yield a solution that is non-unique, the dependent order of KEs in the network is always maintained such that no causal (upstream) KEs are positioned before their dependent (downstream) KEs. Thus, for an AOP network that has been topologically sorted, if the analyst chooses a single KE, that KE can depend, at most, on the set of KEs that precede it in the sorting. It cannot be dependent on any KEs positioned further downstream.
Figure 4.
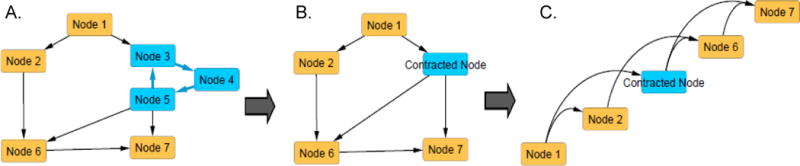
Generic example illustrating contraction and topological sorting of an network. [A] Generic directed network graph containing a cycle (key events [KEs] 3, 4, and 5). [B] Graph of the same network following contraction of KEs 3, 4, and 5 into a single contracted KE. Contraction results in a directed acyclic graph. [C] Graph of the contracted AOP network following topological sorting.
One important caveat to topological sorting is that it can only be applied to acyclic graphs (e.g., no cycles such as feed-forward loops). Cycles may occur in some AOP networks, even if there are no cycles in the individual AOPs from which the network was derived. The most common cause of cycles in an AOP network is when there is KEi that is upstream of KEj in one AOP, but downstream of KEj in another. This effectively introduces a two-way arrow into the network, even though each of the original AOPs were unidirectional. In order to perform topological sorting, the cycles must be removed and represented as a single node on the graph through a process termed “contraction” (Table 3; Figure 4). Given that contraction of two or more KEs involved in a cycle results in a single node in the graphical depiction of the network, protocols for assigning attributes (e.g., title, shape, color, etc.) to the resulting contracted KEs need to be defined so that they are apparent and interpretable. Nonetheless, the contraction process itself can be informative, as it provides a rapid, computational means to identify potential feedback or cross-talk processes that are intrinsic to an AOP network and may have important bearing on the ability to predict outcomes. It is notable that numerous questions submitted to the SETAC Horizon Scanning exercise were focused on methods to identify and describe feedback and feed-forward processes using the AOP framework (LaLone et al. 2017).
3.3.Connectivity
Evaluation of overall connectivity (Table 3) in AOP networks may also have some utility. Connectivity measures evaluate the relative extent to which there is a directed path from one KE to any other KE in the network. AOP networks with greater connectivity indicate greater potential for known complex interactions, and thus greater potential uncertainty in predicting outcomes along those networks. In contrast, lower connectivity may suggest that there are just a few points of interaction that may need to be considered when inferring effects along the AOP network.
3.4.Matching indices, clustering, and network motifs
Particularly as the number of AOPs in the AOP knowledgebase grows and the associated AOP network expands, analyses that computationally identify AOPs that share many of the same KEs may also be quite useful. Matching index (Pavlopoulos et al. 2011; Table 3) can be applied to sort KEs with regard to their similarity to one another. Likewise, a variety of common clustering approaches (e.g., neighbor joining) can be applied to adjacency matrices or other computational representations of AOP networks to identify KEs or AOPs that share many of the same links and cluster them away from those that are very independent (Pavlopoulos et al. 2011). Thus, for example, if one was observing effects associated with a particular KE or a common set of KEs, clustering could be applied to identify the group of AOPs one might want to consider in an assessment.
Finally, there are computational approaches that can be used to highlight the presence of recurring patterns, or network motifs, that appear in a network significantly more than in a randomized network (Milo et al. 2002). Common motifs found in other types of molecular biological networks include feedforward and feedback loops, diamond structures, and even more complex structures (Vazquez et al. 2004; Alon 2007). However, in many cases, features like feedback loops or signal transduction cascades are not directly represented as KEs in an AOP, but rather are embedded in the description of the biological plausibility and/or quantitative understanding of a KER. Thus, it is unclear what types of over-represented motifs may be discovered as AOP networks are analyzed. This should prove to be an interesting research area in upcoming years.
3.5.Key event adjacency and topology-based analyses
When describing AOPs in the AOP-Wiki, “non-adjacent KERs” (Supporting Information, Box 1), previously referred to as “indirect KERs” (OECD 2016a), are often created as a means to capture evidence that may skip over one or more of the KEs in the pathway. Creation of KER descriptions for KEs that are not next to one another in the sequence defined for an AOP helps to more fully capture the weight of evidence supporting an AOP while maintaining the modular structure of the knowledge-base and framework (OECD 2016a). However, these non-adjacent KERs create some challenges in using topology-based analyses. Specifically, inclusion of non-adjacent KERs in an AOP network can inflate node degree and betweenness centrality or deflate distance-based calculations like eccentricity (Table 3) by introducing artificially short paths into the network (see supplementary Tables S.4–S.9 for examples). One solution is to filter the network to only include adjacent KERs when calculating topology-based analyses. However, this can be challenging in the sense that adjacency is AOP-specific. Because there is subjectivity in the number of KEs included in an AOP description, a pair of KEs that are adjacent in one AOP may in be non-adjacent in another. In general, if a KER connects adjacent KEs in any AOP in the knowledgebase, it should be viewed as an “adjacent KER” for the purposes of network derivation. Comparing results for the filtered versus unfiltered network (excluding versus including non-adjacent KERs) may be informative for certain questions. For example, in cases where the number of KERs connected to a KE increases significantly when non-adjacent KERs are included, the results could be indicative of KEs for which greater amounts of empirical evidence are likely available (i.e., KEs that have been measured more frequently than other KEs in the network).
4. AOP Network Analytics: Critical Paths
By providing a framework for the description of the overall landscape of potential adverse outcomes resulting from particular biological perturbations, AOP network analyses can enable strategic identification of paths that have the greatest biological likelihood and/or relevance for risk assessment. This can in turn aid identifying endpoints with good predictive value that can serve as useful alternatives to the direct measurement of apical adverse outcomes (OECD 2016b). For the purposes of our discussion, the path through an AOP network that is considered to be most important to an assessment or research question, and/or most dominant or biologically significant, was termed the critical path (Supporting Information, Box 1). Here we distinguish “path” from “pathway” to recognize that the critical path from a KE to an AO within the AOP network may not necessarily follow the sequence laid out in an individual AOP in the knowledgebase, nor does it necessarily equate to a defined biological pathway, but rather may be a path that “emerges” only through the assembly and consideration of the interactions between multiple AOPs (Figure 5A). For example, in the AOP-Wiki no AOPs linking inhibition of dual oxidases to decreased cognitive function or impaired learning and memory in mammals have been described, to date. However, within the T4-AOP network (Figure 2), these emerge as potential paths through which an effect could occur.
Figure 5.
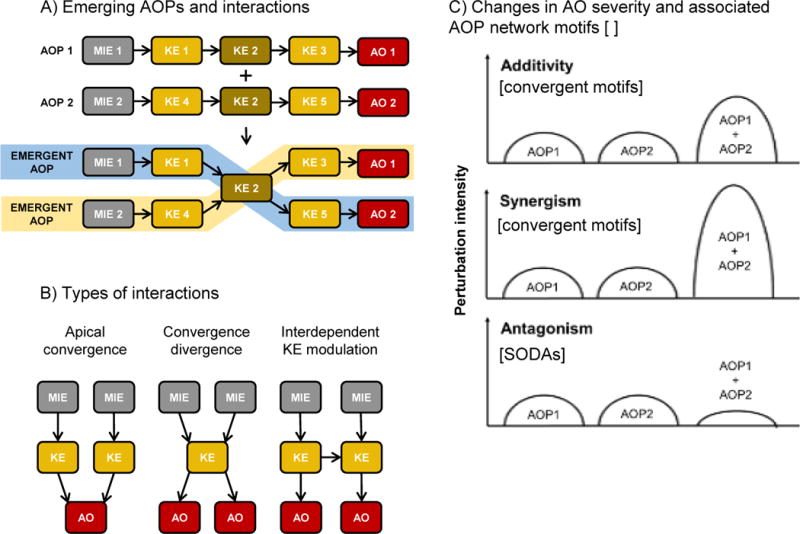
Generic illustration of various types of interactions relevant to the analysis of adverse outcome pathway (AOP) networks. [A] Graphical depiction of emergent AOPs that can arise when individual AOP descriptions are linked as an AOP network. [B] Illustration of some common types of interactions found in AOP networks. [C] Illustration of how AOP interactions may impact the intensity of perturbation of the key events downstream of the point of interaction, and AOP network motifs that would commonly be associated with those interactions. SODA = same object different action, where object and action are ontology terms that are used in defining a key event.
Perspectives on what constitutes the critical path of interest can vary widely based on the regulatory context and/or mandate under which a risk assessment might be done, the research question an investigator may be interested in, or the type of application for which an AOP network is used. As a result, there is no one-size-fits-all approach to critical path identification. However, some of the more common types of data or information that may drive a critical path analysis are outlined below.
4.1.Problem formulation defined critical paths
Problem formulation is the first step in environmental risk assessment where the scope and goals of the assessment are defined, a clear articulation of the question to be addressed is developed, and measurement endpoints defined (US EPA, 1992, 1998). In many cases, up front problem formulation (US EPA 1992, 2014) can significantly reduce the range of paths that one would consider within a given AOP network, thereby aiding identification of the critical paths. Many of the filters and layers discussed by Knapen et al. (2018) can be effectively applied to narrow the range of possibilities and derive an AOP network that is fit-for-purpose. This allows for derivation of an AOP network that retains relevant pathways to the scope, question, and measurement endpoints defined while eliminating less relevant or ancillary pathways from the network so as not to over-complicate the analysis. For example, if one were charged with conducting a risk assessment focused on cancer risk in humans, the network could be filtered to display only those paths that are relevant to humans (based on taxonomic applicability annotations associated with the KEs and KERs) and linked via one or more paths through the network to the outcome of increased tumor formation.
The relevance of the apical adverse outcome in different regulatory contexts can be a particularly important factor to consider. While, ostensibly, all AOPs will extend to an outcome that is accepted as adverse, that may not be true for all possible risk contexts and purposes. For example, an outcome like liver fibrosis may be of concern for a human health risk assessment, but would not necessarily be considered in an ecological risk assessment if a strong link to survival, growth, or reproduction was not established. Likewise, while a researcher may be interested in links between a MIE and behavioral effects that are plausibly related to impaired survival or reproduction, a risk assessor may be unable to consider such data unless strong empirical support establishing the relevance to a population level assessment can be established. In essence, up front problem formulation and scoping are needed to define the fit-for-purpose critical path(s) in an AOP network for a given application.
4.2.Weight of evidence defined critical paths
Critical paths may also be identified based on the weight of evidence supporting the KERs between the KEs. As AOPs are being described in the AOP-knowledgebase there are the weight of evidence or confidence calls made by the AOP developer(s) (Becker et al. 2015; OECD 2016a). These calls of high, medium, or low confidence in a KER and high, medium, or low understanding of the quantitative nature of the relationship between each pair of KEs may help identify the critical paths a risk assessor might be interested in. For example, in order to use an in vitro bioassay result as the basis for a hazard assessment in a regulatory setting, an authority may require that the confidence in that measurement as a scientifically credible and defensible predictor of likelihood to cause the adverse outcome(s) be relatively high (e.g., all the weight of evidence calls ranked high or at least moderate). The assessor could prioritize these paths for digging into the details of the evidence supporting the KERs and assuring those data are of adequate quality to support the extrapolation of the in vitro data to probable apical hazard(s), ignoring the paths for which only weak evidence has been assembled. In contrast, a researcher may be specifically interested in those parts of the AOP network where evidence is weakest. These may represent critical data gaps that could be important to address.
To aid this process, a KER confidence assessment filter or layer (Knapen et al. 2018) could be applied to an AOP network (forming a weighted network) prior to analysis, to ensure that only high-confidence paths are considered. For example, in AOP network 2 (Figure 2) the thickness of the KERs (arrows) reflect whether low, medium, or high confidence was assigned to each, where high confidence is represented by the thickest arrows. Based on visual inspection of the network, the paths linking sodium iodide symporter (NIS; AOP-Wiki, Event 424; SAAOP 2017) or thyroperoxidase (TPO) inhibition (AOP-Wiki, Event 279; SAAOP 2017) to decreased cognitive function (AOP-Wiki, Event 402; SAAOP 2017) or altered amphibian metamorphosis (AOP-Wiki, Event 1101; SAAOP 2017) have higher average KER confidence calls, compared to the path linking iodotyrosine deiodinase (IYD) inhibition (AOP-Wiki, Event 1152; SAAOP 2017) to the same AOs (Supplementary Figure S.11). Thus, an assessor may be comfortable using TPO and NIS assay data, but not IYD assay data, as a basis for hazard identification. Conceptually, this type of weight of evidence analysis could be done computationally, but decisions regarding how to weight adjacent and non-adjacent KERs along a path and how best to sum, average, or normalize weight of evidence along each path would need to be defined.
In a risk assessment, all available studies are reviewed and the quality of the data for each study is taken into consideration in an effort to identify critical effect and the best point of departure. When this process is translated to an AOP network, easily measured KEs that link to paths for which all downstream edges are high confidence and/or high quantitative understanding may lend themselves to prioritization of sentinel, measurable, or critical endpoints. Depending on the needs of the assessment, if additional confidence were needed, the downstream KEs along the path point to confirmatory endpoints to include in the assessment.
Similarly, for a given risk assessment, the assessor may have a defined set of available data. Those data may align with a range of different KEs in the AOP network, and some of those data may be more reliable (and thus weighted more heavily) than others. As it would generally be preferred to weight the risk assessment more heavily toward the outcomes that align with higher confidence data, analysis of the AOP network (for example matching indices or clustering) could guide determination of what paths are linked to high confidence data. That could define the critical path(s) to consider in the assessment. In principle, there is no reason that multiple criteria (i.e., confidence in the KERs, confidence in the data aligning with various KEs that lead to the critical effect, and taxonomic relevance to the problem formulation), could not be considered together, allowing for even further refinement and definition of the most critical path for an assessment.
4.3.Biologically-toxicologically defined critical paths
Most of the considerations for defining critical paths described above relate to the goals and objectives of certain steps in the risk assessment process (e.g., problem formulation; hazard identification). However, there are a number of considerations that are more intrinsic to the biology that may define or further refine critical paths. For example, for a stressor that can trigger multiple pathways (e.g., polypharmacology), the critical path may be defined based on the MIE triggered at the lowest dose (i.e., defined by the relative sensitivity of the different pathways). Pathways that are only triggered at concentrations 10 or 100 times greater, could plausibly be much less relevant to consider under most exposure scenarios. Generally speaking, pathways that are more readily perturbed by a given stressor (e.g., more sensitive) may frequently be more critical than less sensitive pathways. However, there can be exceptions.
Time to effect is another intrinsic biological consideration that could be used to define critical path. For multiple paths activated at approximately the same dose, the path that could produce a relevant adverse effect earliest in the time-course of exposure might be viewed as the most critical path. A simple example of this was noted by Villeneuve et al. (2014) where inhibition of glycogen synthase kinase was identified as an MIE that could plausibly lead to impaired swim bladder inflation and subsequent reductions in young of year survival in fish. While that AOP could be relevant in some exposure scenarios (e.g., exposures starting later in development), it was also acknowledged that assuming continuous exposure throughout development, impaired wnt signaling (a KE in the AOP) would be expected to cause lethal developmental abnormalities (represented as other branches in the AOP network) well before the swim bladder inflates. Thus, the swim bladder-mediated outcome was unlikely to be the critical path within that AOP network under most exposure conditions. Using a temporality layer (Knapen et al. 2018), a weighted network could be generated in which time-to-effect could be calculated for each path through the network and used to aid critical path identification (e.g., Supplementary Figure S.12). While time-to-effect information was not routinely captured in the AOP-Wiki up through 2017, updates to the guidance (OECD 2016) and sections in the AOP-Wiki now prompt AOP developers to supply that information where possible. Thus, development of a temporality layer should be increasingly feasible in years to come.
It is acknowledged that some additional intrinsic and extrinsic factors may impact which will be the critical path or can shift the network towards a different critical path. For example, one might generally consider an AOP leading to complete infertility to be more critical than one that increases susceptibility to infection. However, if under the exposure scenario being considered, an infection-driven AOP leading to acute mortality has been triggered, its intersection with the increased susceptibility pathway may make its immediate significance greater than that of long-term infertility. In other cases, intersecting AOPs in the network may enhance or strengthen the identification of a particular AO as the terminus of a critical path. For example, in the case of the polypharmacological responses to synthetic glucocorticoids, immunosuppression exacerbates the effect of other AOPs leading to decreased egg production (Margiotta-Casaluci et al. 2016; Knapen et al. 2018). Thus, information from the AOP network can actually be leveraged and utilized to support the appropriate consideration of different types of data (i.e., from endpoints or assays aligned with AOPs) based on the fact that additional critical KEs may emerge in a given system of interest depending upon the specific status (e.g., healthy vs diseased), environmental conditions, or polytoxicological impacts of a given stressor.
4.4.Empirical identification of critical paths
As AOP networks are developed and applied it will become increasingly feasible to identify the most critical paths in the AOP network based on experience. As an example, we can consider the case of a chemical tested in ToxCast® that has been shown to trigger a number of different biological changes mapping to KEs in an AOP network (e.g., similar case study 3 in Knapen et al. 2018). The AOP network lays out a range of possible effects. However, after testing the compound in vivo it may become evident that the actual profile of effects observed followed a particular path through the network. With experience testing more and more stressors, it may become apparent based on the accumulated data that among all the KEs investigated, certain sequences of KEs are observed more frequently than others (at least for stressors that fall within the domain tested). These essentially become empirically-identified critical paths. Once these are known, other possible outcomes documented via the AOP network can be probabilistically deemphasized allowing one to focus on the most likely outcome(s) based on previous experience, while still recognizing other possible outcomes that could occur. The most commonly dominant paths may become those for which development of quantitative understanding and computational tools needed to infer or predict effects along the pathway (i.e., development of qAOPs; e.g., (Conolly et al. 2017) may be higher priority. Additionally, in cases where the critical path(s) identified empirically represent a path that emerged from the network, rather than from the description of an individual AOP (Figure 5A; Figure 2), identification of the critical path could plausibly lead to development of new guideline toxicity tests or testing strategies, in that it might link together a series of endpoints and assays that had not been previously grouped together as a predictive unit or motif.
4.5.Limitations of critical path identification
While conceptually there are many benefits to the identification of critical paths, it remains to be seen whether dominant paths will really emerge through prospective AOP network-informed testing and/or retrospective AOP network-based meta-analyses. Accurate identification of critical paths will be limited by the scope of existing data. Furthermore, it is unclear whether critical paths will be conserved across species, even if the AOPs in question are relevant to their taxonomic domain, or whether certain paths will be more dominant in some species than others. As noted above (section 2) the AOP knowledgebase, and thus AOP networks, are not yet comprehensive. An undiscovered or unannotated AOP may end up being more critical within a given network than those identified through any of the methods described above. While there will always be a theoretical risk that the true critical path(s) may not be identified, that risk should decrease as more AOPs are described in the knowledgebase and more toxicity testing results are interpreted in an AOP network context.
Overall, the identification of critical paths within AOP networks is an emerging concept that will aid elucidation of the most fit-for-purposes assays for which there will be a good predictive value with respect to the potential adverse outcomes. By highlighting more directly the link between the measured KE and the AO, it is anticipated that this structure will ultimately enable better communication with regulators and other stakeholders and advance the use of AOPs for risk assessment.
5. AOP Network Analytics: Interactions Among AOPs
A third critical aim with regard to analysis of AOP networks is consideration of the potential interactions among AOPs. The concept of AOP interactions describes how one or more features of an AOP or its underlying biology affects another. The consequence of these interactions may be a biological outcome that is different from the one that would be observed had the interaction not occurred. As a result, the ability to understand the potential consequences of interactions among AOPs that may be activated within an organism is, arguably, one of the greatest challenges to the predictive utility of the AOP framework. It is also, perhaps the most important challenge to meet given the ubiquity of exposure to multiple stressors and the fact that individual stressors may have multiple modes-of-action.
Interactions among AOPs can take place at many different levels of biological organization. For example, at the cellular level there can be interactions among signaling pathways, receptor cross talk, assembly and regulation of transcription factor complexes, etc. Knowledge concerning many of these interactions has been collected and made accessible in several computational databases, such as the XTalkDB (Sam et al. 2017). Moreover, studies that describe how to leverage this knowledge to address specific biomedical challenges have been published (e.g., Jaeger et al. 2016). Another important example of pathway interactions involves crosstalk between nuclear receptors. Numerous examples in the context of endocrine disruption have recently been reviewed by Kiyama (2016). Even when there are no directly shared KEs, multiple pressures on a biological system can lead to systemic impacts such as mitochondrial energy depletion, limiting enzyme depletion, changes in intra or extracellular matrix organization, etc. (Koch and Funk, 2001). Likewise, as tissue or organ functions are impacted, effects in one organ can be expected to impact functions elsewhere in the body. Crosstalk between cell signaling pathways and between various organ systems has been extensively studied over decades. Thus, it is not our intent here to review all the possible biological interactions that may translate to interactions among AOPs. Instead we aim to introduce some of the ways AOP networks can be qualitatively analyzed to gain insight into interactions and their potential consequences. A more quantitative assessment of how AOP interactions may influence the probability or severity with which downstream KEs are observed was beyond the scope the present paper and being addressed by other authors (LaLone and Hecker, 2017).
5.1.Interactions and AOPs
Interactions within an AOP network can result in either an intensity or trajectory of biological change that is different from what would be expected based on consideration of any one constituent AOP (Figure 5). Potential shifts in intensity/severity are probably the most easily identified and intuitively interpreted of the AOP interactions. Typical examples of crosstalk-induced change include additive, synergistic and antagonistic responses (Vert and Chory 2011). These apply equally well to the potential qualitative consequences that one might expect as a result of interactions among AOPs.
From a risk assessment perspective, pathway interactions that result in additivity or synergism are of primary concern as the interactions among multiple AOPs have the potential to amplify risk. Fortunately, convergent topologies generally associated with probable increased severity of a given AO or KE are among the easiest to qualitatively detect and interpret using AOP network analytics approaches. The ability to visually or computationally identify points at which effects of separate stressors may converge (see section 3, Network Topology) to influence common downstream KEs can be a basis for considering those stressors jointly in a risk assessment. This is a significant potential application of AOP networks, as currently there are relatively few tools that risk assessors have available for identifying whether potential additive or synergistic effects should be considered.
Antagonistic interactions between AOPs that would be expected to result in diminished severity are a bit more challenging to detect based on AOP networks. This is because KEs are defined as a measureable change in a biological state, expressed as an increase or decrease compared to a control/reference. Because each KE in an AOP network represents a directional change of state (see section 2, AOPs as Networks), counter-acting effects on the same object or process will generally be defined as separate KEs (separate nodes) in the network, and are therefore not typically represented as convergent motifs/KEs. For example, in the CYP19-AOP network (Figure 1; Figure 3B), estrogen receptor agonism (AOP-Wiki, Event 111; SAAOP 2017) is represented as a distinct KE from antagonism of the estrogen receptor (AOP-Wiki, Event 112; SAAOP 2017). This makes sense from a descriptive point of view, as both KEs are functionally distinct and the downstream consequences of each are different. However, this is problematic if one wanted to understand the potential antagonistic interaction between AOPs containing these KEs because they don’t share any KEs in common. Rather in this case, these parallel, paths are only represented in the same AOP network diagram because the network developer identified that they represent opposite actions on the same object (the estrogen receptor) and manually added them (Figure 1). example can be found in the T4-AOP network (Figure 2) with regard to effects of deiodinase 3 (DIO3) inhibition (AOP-Wiki, Event 1153; SAAOP 2017) relative to inhibition of deioidinase 1 or 2 (DIO1, DIO2; AOP-Wiki, Events 1002, 1009; SAAOP 2017). In this case, the three AOPs appear to converge on the AO of altered amphibian metamorphosis (AOP-Wiki, Event 1101; SAAOP 2017), which, on the basis of topology alone, would suggest additivity or synergism. However, a closer look at the KEs reveals that the biological effect of DIO3 inhibition is opposite that of DIO1 or DIO2 inhibition, which would suggest an antagonistic interaction.
With this in mind, it is important that computational tools developed for AOP network extraction be able to identify KEs representing opposite effects on the same object (termed SODAs – same object, different action; blue rectangles in Figures 2 and 3B). Using natural language semantics for KE titles, SODAs can be difficult to identify. However, with updates to the AOP-Wiki that now represent KEs using structured three component ontology terms (Ives et al. 2017) it should be computationally straightforward to identify these features. The remaining questions are how to best represent them visually within the network, and how to handle them computationally when calculating network statistics or conducting quantitative analyses of AOP networks (not considered here). Regardless of final implementation, appropriate annotation of SODAs in an AOP network would have immediate use for identifying points of potential antagonistic interaction.
Perhaps the most challenging type of effects that may result from interactions among AOPs are those associated with emergent pathways (Figures 5A, 2). Emergent pathways don’t follow the trajectory of any of the individual AOPs described in the AOP-Wiki, but rather yield a new phenotypic sequence and/or outcome altogether. They may represent phenotypes or AOs that can only occur if two or more perturbations occur within the network. As such, they may be difficult to define from individual stressor experiments alone. However, a significant advantage of de facto network construction using the modular AOP framework is that these more complex, and more difficult to elucidate responses, may nonetheless get coded into an AOP network as KEs and KERs get linked to different AOPs. Emergent pathways that arise as AOP networks are constructed may provide a basis for understanding what might be otherwise unanticipated or “idiosyncratic” patterns of results. In this respect, one could envision scenarios in which an investigator might query the AOP knowledgebase with an observed pattern of effects (a set of KEs), and then expand an AOP network around those KEs to identify whether a plausible interactive mechanism, relevant to the exposure conditions of interest, exists. The “emergence” of novel pathways as more individual AOPs are described in the knowledgebase and linked through shared KEs thus represents a unique, and potentially powerful, attribute of the AOP networks and the AOP framework as a whole.
5.2.Important Considerations
As is generally the case with AOPs, the ability to understand potential interactions among AOPs and predict their consequences depends on how comprehensively the AOPs cover the relevant biology. When large data gaps exist between MIEs and KEs, when the KERs are weak, or when AOPs relevant to the modes of action of concern are sparse, it is difficult to obtain a comprehensive picture of potential interactions among AOPs or to use AOP networks to understand observed patterns of response. This should always be considered as a limiting factor when assessing the predictive utility of an AOP network.
On the other hand, when the pathway coverage is rich, the information can become overwhelming and may obscure rather than illuminate the critical path(s). This hearkens to the importance of scoping and problem formulation as well as being able to efficiently filter the overall AOP network represented in the AOP-Wiki to those AOPs most important to a given research or regulatory question (Knapen et al. 2018). Likewise, when AOP networks are large, topological and graph theory-based computational analyses may be critical for honing in on important network features.
Finally, consideration of interactions between AOPs that change the severity or intensity of effect on a given KE or AO lead into the quantitative analysis of AOPs. At the level described in this paper and the companion article by Knapen et al. (2018), we focus primarily on the qualitative analysis of AOP networks. However, it is recognized that quantitative understanding of AOPs is needed to accurately predict the probability or severity of the outcome one might expect for a given exposure scenario based on AOPs or an AOP network (Conolly et al. 2017). The development of quantitative analysis utilizing AOPs and AOP networks is considered elsewhere (Conolly et al. 2017; LaLone and Hecker, 2017).
6. Conclusions
The need to consider concurrent effects on multiple AOPs and their potential interactions was identified as a major theme through the SETAC Horizon Scanning exercise on “Advancing the utility of the AOP framework in research and regulation”. While this need was recognized from the inception of the AOP framework (Villeneuve et al. 2014a, 2014b), we’ve only recently begun approaching the critical mass of AOPs needed to start deriving AOP networks from the AOP-Wiki in order to analyze them and test their predictive utility. Filters and layers based on structured annotation of domains of applicability, weight of evidence, quantitative understanding of KERs, and other features provide the potential to derive and customize AOP networks best suited to one’s research question or problem formulation. Once derived, those AOP networks can be analyzed in a variety of ways to extract useful information. Various topological analyses can be applied to identify key features to target for assay or model development. Critical paths based on risk assessment goals, biological attributes, or empirical testing can be defined. Together these approaches, along with tools still under development, can help to identify and understand complex interactions that may occur when multiple AOPs are activated in different contexts. Broadly speaking, all these approaches are in their infancy with regard to understanding and illustrating their practical utility and limitations. The concepts described serve as a starting point to aid the ongoing development of the AOP-Wiki and associated software applications like the AOP-Xplorer (Burgoon 2017). Additionally, they inform design of applications case studies that will put these concepts to the test. Along with other manuscripts associated with the April 2017 SETAC Pellston workshop on Advancing the AOP Framework (LaLone and Hecker 2017), this paper serves the ongoing development of the AOP framework as a critical concept to support 21st century approaches to toxicological research and regulation.
Supplementary Material
Acknowledgments
The authors thank the SETAC Pellston Workshop co-chairs, C. LaLone and M. Hecker for their coordination, organization, and guidance of the workshop. We acknowledge the other workshop participants (see LaLone and Hecker 2017) for their stimulating discussions and feedback and the respondents to the Horizon Scanning efforts for the charge questions and themes that informed our discussion. We gratefully acknowledge the Society of Environmental Toxicology and Chemistry (SETAC) North America staff, in particular G. Schiefer, N. Mayo, and T. Schlekat who provided support to the workshop co-chairs, steering committee, and workshop participants before, during, and after the Pellston workshop. Funding for the workshop was provided by the Society of Environmental Toxicology and Chemistry, United States Environmental Protection Agency, American Cleaning Institute, Cefic-LRI (European Chemical Industry Council Long-Range Research Initiative), Chevron-Environmental, ECETOC (European Center for Ecotoxicology and Toxicology of Chemicals), European Commission Joint Research Centre, European Crop Protection, ExxonMobil, Humane Society International, The Humane Society of the United States, Human Toxicology Project Consortium, Syngenta, and Unilever. In addition, we thank the groups from academia, industry, and government who supported participants’ travel. Finally, we thank S. Edwards for review and input on the draft manuscript.
Footnotes
Disclaimer
Contents of this paper represent the personal opinions of the authors and neither constitute, nor necessarily reflect the policies or viewpoints or their employers or institutes.
Data Availability
All data reported in this paper are available via the supplementary data files or from SAAOP 2017.
Supplemental Data
Supplementary data, including supplementary text, tables, and figures are available on the Wiley Online Library at DOI: 10.1002/etc.xxxx
References
- Alon U. Network motifs: theory and experimental approaches. Nat Rev Genet. 2007;8:450–461. doi: 10.1038/nrg2102. [DOI] [PubMed] [Google Scholar]
- Becker RA, Ankley GT, Edwards SW, Kennedy SW, Linkov I, Meek B, Sachana M, Segner H, Van Der Burg B, Villeneuve DL, Watanabe H, Barton-Maclaren TS. Increasing scientific confidence in adverse outcome pathways: application of tailored Bradford-Hill considerations for evaluating weight of evidence. Regulat Toxicol Pharmacol. 2015;72:514–537. doi: 10.1016/j.yrtph.2015.04.004. [DOI] [PubMed] [Google Scholar]
- Burgoon L. Cytoscape App Store, AOPXplorer. 2017 [cited 2017 August 7]. Available from: http://apps.cytoscape.org/search?q=aopxplorer.
- Caldarelli G, Catanzaro M. Networks: A Very Short Introduction. Oxford University Press; Oxford, UK: 2012. [Google Scholar]
- Conolly RB, Ankley GT, Cheng W, Mayo ML, Miller DH, Perkins EJ, Villeneuve DL, Watanabe KH. Quantitative Adverse Outcome Pathways and Their Application to Predictive Toxicology. Environ Sci Technol. 2017;51:4661–4672. doi: 10.1021/acs.est.6b06230. [DOI] [PMC free article] [PubMed] [Google Scholar]
- Cytoscape. NetworkAnlayzer Online Help. [cited 2017 July 28]. Available from: http://med.bioinf.mpi-inf.mpg.de/netanalyzer/help/2.7/index.html.
- Friedlander T, Mayo AE, Tlusty T, Alon U. Evolution of bow-tie architectures in biology. PLoS Comput Biol. 2015;11:e1004055. doi: 10.1371/journal.pcbi.1004055. [DOI] [PMC free article] [PubMed] [Google Scholar]
- Hecker, et al. Adverse outcome pathways: moving from a scientific concept to a globally accepted framework. Environ Toxicol Chem. 2018 doi: 10.1002/etc.4385. [DOI] [PMC free article] [PubMed] [Google Scholar]
- Huber W, Carey VJ, Long L, Falcon S, Gentleman R. Graphs in molecular biology. BMC Bioinformatics. 2007;8(Suppl 6):S8. doi: 10.1186/1471-2105-8-S6-S8. [DOI] [PMC free article] [PubMed] [Google Scholar]
- Ives C, Campia I, Wang R-L, Wittwehr C, Edwards S. Creating a structured AOP knowledgebase via ontology-based annotations. Appl In Vitro Toxicol. 2017 doi: 10.1089/aivt.2017.0017. (in press) [DOI] [PMC free article] [PubMed] [Google Scholar]
- Jaeger S, Igea A, Arroyo R, Alcade V, Canovas B, Orozco M, Nebreda AR, Aloy P. Quantification of pathway cross-talk reveals novel synergistic drug combinations for breast cancer. Cancer Res. 2016;77:1–11. doi: 10.1158/0008-5472.CAN-16-0097. [DOI] [PubMed] [Google Scholar]
- Kitsak M, Havlin S, Paul G, Riccaboni M, Pammolli F, Stanley HE. Betweenness centrality of fractal and nonfractal scale-free model networks and tests on real networks. Phys Rev E Stat Nonlin Soft Matter Phys. 2007;75:056115. doi: 10.1103/PhysRevE.75.056115. [DOI] [PubMed] [Google Scholar]
- Kiyama R. Endocrine disruptor actions through receptor crosstalk. Environ Biotechnol. 2016;12:1–16. [Google Scholar]
- Knapen D, Angrish MM, Fortin MC, Katsiadaki I, Leonard M, Margiotta-Casaluci L, Munn S, O’Brien JM, Pollesch NL, Smith LC, Zhang X, Villeneuve DL. Adverse outcome pathway networks I: development and applications. Environ Toxicol Chem. 2018 doi: 10.1002/etc.4125. (this issue) [DOI] [PMC free article] [PubMed] [Google Scholar]
- Koch T, Funk RH. Cellular dysfunction in the pathogenesis of organ failure. New insights from molecular and cell biology. Der Anaesthesist. 2001;50:742–749. doi: 10.1007/s001010100201. [DOI] [PubMed] [Google Scholar]
- LaLone CA, Ankley GT, Belanger SE, Embry MR, Hodges G, Knapen D, Munn S, Perkins EJ, Rudd MA, Villeneuve DL, Whelan M, Willett C, Zhang X, Hecker M. Advancing the adverse outcome pathway framework-An international Horizon Scanning approach. Environ Toxicol Chem. 2017;36:1411–1421. doi: 10.1002/etc.3805. [DOI] [PMC free article] [PubMed] [Google Scholar]
- LaLone CA, Hecker M. Society of Environmental Toxicology and Chemistry (SETAC) Pellston workshop: advancing the adverse outcome pathway concept: an international Horizon-Scanning approach: Society for Advancement of AOPs. doi: 10.1002/etc.3805. [cited 2017 August 8]. Available from: http://www.saaop.org/workshops/pellston2017.html. [DOI] [PMC free article] [PubMed]
- Lewis TG. Network Science: Theory and Applications. Wiley; 2009. [Google Scholar]
- Margiotta-Casaluci L, Owen SF, Huerta B, Rodriguez-Mozaz S, Kugathas S, Barceló D, Rand-Weaver M, Sumpter JP. Internal exposure dynamics drive the adverse outcome pathways of synthetic glucocorticoids in fish. Sci Reports. 2016;6:srep21978. doi: 10.1038/srep21978. [DOI] [PMC free article] [PubMed] [Google Scholar]
- Milo R, Shen-Orr S, Itzkovitz S, Kashtan N, Chklovskii D, Alon U. Network motifs: simple building blocks of complex networks. Science. 2002;298 doi: 10.1126/science.298.5594.824. [DOI] [PubMed] [Google Scholar]
- Netzwerkerin. Eccentricity and Closeness. [cited 2017 July 28]. Available from: https://sites.google.com/site/netzwerkerin/home/closeness.
- Newman MEJ. The structure and function of complex networks. SIAM Review. 2003;45:167–256. [Google Scholar]
- Organisation for Economic Cooperation and Development (OECD) User’s Handbook supplement to the Guidance Document for developing and assessing Adverse Outcome Pathways. Vol. 1. OECD Publishing; Paris, France: 2016. https://one.oecd.org/document/ENV/JM/MONO(2016)12/en/pdf. [Google Scholar]
- Organisation for Economic Co-operation and Development (OECD) (ENV/JM/MONO(2016)67).Guidance document for the use of adverse outcome pathways in developing integrated approaches to testing and assessment (IATA), (Series on Testing and Assessment No. 260) 2016 [Google Scholar]
- Pavlopoulos GA, Secrier M, Moschopoulos CN, Soldatos TG, Kossida S, Aerts J, Schneider R, Bagos PG. Using graph theory to analyze biological networks. BioData Mining. 2011;4:10. doi: 10.1186/1756-0381-4-10. [DOI] [PMC free article] [PubMed] [Google Scholar]
- Sam SA, Teel J, Tegge AN, Bharadwaj A, Murali TM. XTalkDB: a database of signaling pathway crosstalk. Nucleic Acids Res. 2017;45:D432–D439. doi: 10.1093/nar/gkw1037. [DOI] [PMC free article] [PubMed] [Google Scholar]
- Skiena S. Topological Sorting, §5.4.3 In Implementing Discrete Mathematics: Combinatorics and Graph Theory with Mathematica. First. Basic Books; 1990. pp. 208–209. [Google Scholar]
- Society for Advancement of AOPs (SAAOP) AOP-Wiki. [cited 2017 August 8]. Available from: http://aopwiki.org.
- Trudeau RJ. Introduction to Graph Theory. Dover Publications; 2013. [Google Scholar]
- United States Environmental Protection Agency, Risk Assessment Forum. Framework for Ecological Risk Assessment. Washington, DC: 1992. (EPA/630/R-92/001). [Google Scholar]
- United States Environmental Protection Agency, Risk Assessment Forum. Guidelines for Ecological Risk Assessment. Washington, DC: 1998. (EPA/630/R-95/002F). [Google Scholar]
- United States Environmental Protection Agency, Risk Assessment Forum. Framework for human health risk assessment to inform decision making. Washington DC: 2014. (EPA/100/R-14/001). [Google Scholar]
- Vazquez A, Dobrin R, Sergi D, Eckmann JP, Oltvai ZN, Barabasi AL. The topological relationship between the large-scale attributes and local interaction patterns of complex networks. Proc Natl Acad Sci. 2004;101:17940–17945. doi: 10.1073/pnas.0406024101. [DOI] [PMC free article] [PubMed] [Google Scholar]
- Vert G, Chory J. Crosstalk in cellular signaling: background noise or the real thing? Dev Cell. 2011;21:985–991. doi: 10.1016/j.devcel.2011.11.006. [DOI] [PMC free article] [PubMed] [Google Scholar]
- Villeneuve D, Volz DC, Embry MR, Ankley GT, Belanger SE, Leonard M, Schirmer K, Tanguay R, Truong L, Wehmas L. Investigating alternatives to the fish early-life stage test: a strategy for discovering and annotating adverse outcome pathways for early fish development. Environmental toxicology and chemistry. 2014;33:158–169. doi: 10.1002/etc.2403. [DOI] [PMC free article] [PubMed] [Google Scholar]
- Villeneuve DL, Crump D, Garcia-Reyero N, Hecker M, Hutchinson TH, LaLone CA, Landesmann B, Lettieri T, Munn S, Nepelska M, Ottinger MA, Vergauwen L, Whelan M. Adverse outcome pathway (AOP) development I: strategies and principles. Toxicol Sci. 2014a;142:312–320. doi: 10.1093/toxsci/kfu199. [DOI] [PMC free article] [PubMed] [Google Scholar]
- Villeneuve DL, Crump D, Garcia-Reyero N, Hecker M, Hutchinson TH, LaLone CA, Landesmann B, Lettieri T, Munn S, Nepelska M, Ottinger MA, Vergauwen L, Whelan M. Adverse outcome pathway development II: best practices. Toxicol Sci. 2014b;142:321–330. doi: 10.1093/toxsci/kfu200. [DOI] [PMC free article] [PubMed] [Google Scholar]
- Villeneuve DL. AOP-Wiki. Society for Advancement of AOPs; 2017. [cited 2017 July 18]. Available from: https://aopwiki.org/aops/25. [Google Scholar]
- Weisstein Eric W. Topological Sort. From MathWorld–A Wolfram Web Resource. [cited 2017 August 8]. Available from: http://mathworld.wolfram.com/TopologicalSort.html.
- Wikipedia. Ontology (information science) [cited 2017 July 7]. Available from: https://en.wikipedia.org/wiki/Ontology_(information_science)
- Worth AP, Patlewicz G. Integrated approaches to testing and assessment. Adv Exp Med Biol. 2016;856:317–342. doi: 10.1007/978-3-319-33826-2_13. [DOI] [PubMed] [Google Scholar]
Associated Data
This section collects any data citations, data availability statements, or supplementary materials included in this article.