Abstract
Diagnosis of osteomyelitis presents a formidable challenge. Lack of pathognomonic clinical sign(s) and diagnostic tests that can diagnose osteomyelitis at an early stage contribute to this difficulty. If the diagnosis is not made early, the disease becomes very difficult to eradicate and can lead to limb threatening and potentially life-threatening complications. Staphylococcus aureus is the most common organism causing osteomyelitis. Raman Spectroscopy provides information about molecular vibration that could potentially be harnessed as a spectral signature for cellular changes in specific pathologic conditions. In this study we describe a technique using Raman spectroscopy that could potentially be used to diagnose staphylococcal osteomyelitis. Human bone samples were co-cultured with Staphylococcus aureus (S. aureus) and the effects of bacterial growth on bone quality were then monitored using Raman spectroscopy. A major drop in the bone mineral quality and crystallinity was observed in the infected bones compared to the controls. S. aureus infection was also found to alter the collagen cross-linking. Our study shows that specific spectral signatures are present for the cause as well as the effect of staphylococcal osteomyelitis, opening the possibility of developing a useful diagnostic modality for early and rapid diagnosis of this condition.
Introduction
Osteomyelitis is an inflammatory process accompanied by bone destruction caused by an infecting micro-organism1. It is often a challenging condition for the patient as well as the treating physician. For the patient it could mean severe and un-relenting pain, temporary, or at times, permanent loss of mobility, with or without systemic symptoms, such as fever and chills. For the physician, lack of pathognomonic signs, as well as, specific diagnostic tests that can detect the condition early can prove to be frustrating2.
Pathogenesis of osteomyelitis involves the agent (micro-organism), the host, and the environment3. The focus of this work is on the specific interaction between the bone and Staphylococcus aureus, which is the predominant organism causing osteomyelitis4–7. Staphylococcus aureus (S. aureus) secretes a myriad of extracellular substances and cell associated factors that contribute to its virulence.
Staphylococcus aureus also has the ability to invade mammalian cells and this may explain its capacity to colonize tissues and to persist after bacteremia8. It has been reported that S. aureus that has been internalized by cultured osteoblasts can survive within the cells9. This intracellular survival (at times in a metabolically altered state in which they appear as so-called small-colony variants) could explain the persistence of bone infections10. Isolation of the offending micro-organism by blood cultures or direct cultures remain the cornerstone for the management of osteomyelitis11,12, as targeted antibiotics can then be administered. Blood cultures are positive only in hematogenous acute osteomyelitis cases and direct cultures involve a surgical procedure with its attendant anesthetic and surgical risks. Thus, a non-invasive way of obtaining a specific diagnosis would be of immense value. In this study we have performed some preliminary in vitro experiments using Raman spectroscopy to explore this modality as a potential technique for rapid diagnosis of staphylococcal osteomyelitis.
Raman spectroscopy is based on inelastic scattering of monochromatic laser light providing useful vibrational information of chemical bonds and symmetry of molecules13. Over the last decade several investigators have reported the usefulness of Raman spectroscopy in the diagnosis of a variety of bone diseases in humans, that has been summarized chronologically as a table in the supplementary information14–22. These reports range from studies looking at mineralization and structural deterioration of bone in osteoporosis14,20, structural deterioration of collagen of nails in osteoporosios22, monitoring treatment of osteoporosis15,17, and monitoring a major adverse reaction to the treatment of osteoporosis such as osteonecrosis of jaw19. Other diseases affecting the structure of bone such as osteomalacia18, and osteogenesis imperfecta21,22 have also been studied using Raman spectroscopy. Of particular relevance to this study, is the work of Esmond-White et al.16, who showed that diabetic osteomyelitis patients requiring surgical intervention had abnormal calcium phosphate minerals including dicalcium phosphate dihydrate (brushite) and uncarbonated apatite. In this work normal human bone samples were collected from patients undergoing knee replacement surgery and S. aureus infection was introduced in-vitro into the samples. The bacterial growth and its effects on the bone quality were then systematically monitored using Raman spectroscopy over a period of three weeks.
Materials and Methods
Sample preparation
The study was approved by Sultan Qaboos University medical ethics committee. The methods were carried out in accordance with the relevant guidelines and regulations of the ethics committee. Bone samples were obtained in an aseptic manner from four patients undergoing total knee arthroplasty after obtaining informed consent. Each bone section was divided into four quadrants and five cancellous bone pieces measuring 2-3 mm in diameter were cut from each quadrant and kept moist in swabs soaked in sterile normal saline (0.9% NaCl solution, pH 7.4). Thus, a total of 80 samples from four patients were obtained. A bacterial inoculum of S. aureus was created from a fresh overnight culture which was subsequently diluted with 10 ml sterile saline water to a concentration within the range of 1 × 10⁶ to 1 × 10⁷ colony forming units (CFU)/ml, and the bone pieces were added to the mixture. Control bone samples were then collected in a sterile container containing 10 ml sterile normal saline water. Bone pieces (both inoculated and control samples) were then incubated for 21 days at 37 °C to facilitate bacterial growth. Samples from the control specimens were cultured every 48 hours to ensure that they remained sterile.
Raman measurement
Raman spectra were recorded using a confocal Raman microscope (XploRA from HORIBA Jobin Yvon, France) fitted with 25 mW 532 nm laser (laser spot size: 2 μm). A 1% transmittance filter was fixed at the probe laser station to avoid sample heating by the laser. An integration time of 20 s was fixed for all Raman measurements and spectra were collected with a 10 × objective lens over a spectral range of 200 to 2000 cm−1 using a TE cooled CCD camera (Syncerity, HORIBA, France) attached to a monochromator of the spectrometer with 1800 gr/mm grating providing spectral resolution better than 2 cm−1. The growth of S. aureus and its effect on bone quality was monitored for 21 days. For Raman measurements we have taken one bone piece at a time and collected signals from 5 different spots from the same sample.
Data analysis and representation
Raman spectra obtained from each sample were first baseline corrected by using LabSpec 6 software for background signal correction and averaged to obtain low noise signal. Then all the averaged Raman spectra were normalized with respect to the height of the CH2 wag Raman band at 1450 cm−1 for further analysis. Selection of this band (1450 cm−1) was done based on minimal changes observed in the data. For that we have carefully scanned all the spectra and found minimal spectral changes in the 1450 cm−1 peak and therefore fixed the normalization point around this peak. Although S. aureus has a Raman band at 1465 cm−1, the intensity and width of the CH2 wag Raman band at 1450 cm−1 are much higher than the Raman band from bacteria and hence no considerable influence of Raman signal from the bacteria could be observed.
The data obtained after normalization was then represented as follows:
where is the mean intensity/area of the peak of interest and is the standard deviation of measurement.
was calculated by equation (1):
| 1 |
where is the number of samples and is the intensity/area of the ith Raman peak.
Standard deviation of measurement () was then calculated using equation (2),
| 2 |
Data availability
The datasets generated during and/or analyzed during the current study are available from the corresponding author on reasonable request.
Results
Figure 1(a) shows a typical Raman spectrum of healthy human bone, along with the assignments of the Raman bands. Raman bands at 427, 577 and 958 cm−1 are characteristics of the vibrational modes of phosphate, while the Raman band associated to carbonate bone mineral is located at 1070 cm−1 24. Peaks at 851, 873 and 917 cm−1 are assigned to the collagen proline and hydroxyproline matrix and the peak at 1001 cm−1 is characteristic of phenylalanine. Protein related amide III Raman band is located between 1210 to 1320 cm−1, typically consisting of two major components at 1246 cm−1 and 1270 cm−1 assigned to the collagen β-sheet and α-helix secondary structures, respectively25,26. The peak at 1450 cm−1 is usually due to the CH2 deformation (wagging) of protein. The broad Raman band centered at 1656 cm−1 represents the amide I of collagen, which typically consist of several secondary structures27. The Raman spectrum of S. aureus bacterial suspension in water is shown in Fig. 1(b). The characteristic Raman band of the carotenoid pigment of S. aureus can be observed at 1526 cm−1 28.
Figure 1.
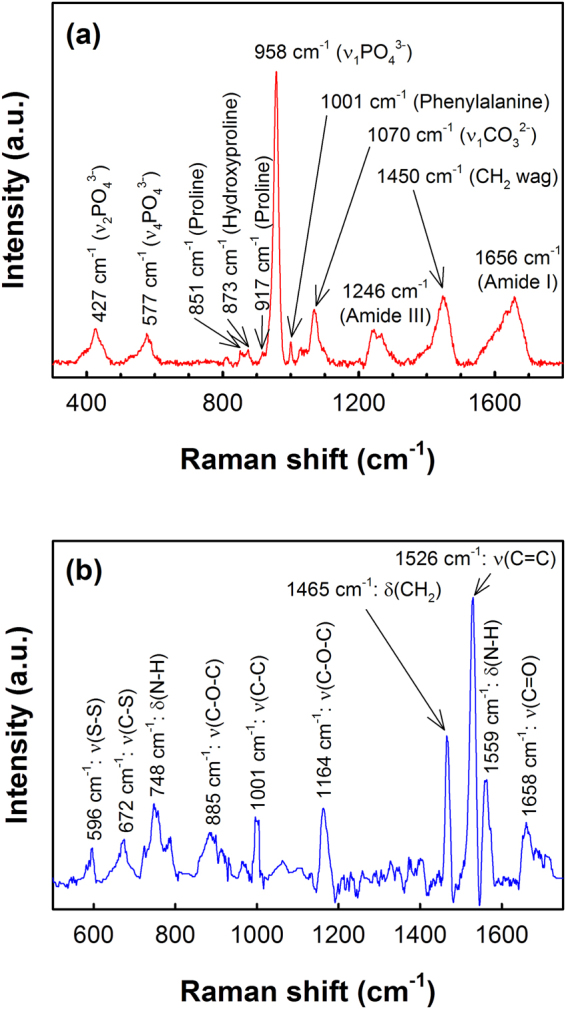
Typical Raman spectrum of (a) healthy human bone and (b) S. aureus bacteria obtained with 532 nm laser excitation. Spectra were background corrected for clarity of presentation. (ν: stretching mode, δ: deformation mode).
Alterations in collagen network
To investigate the spectral changes in the secondary structures of collagen upon bacterial infection, curve fitting procedure was carried out to partially resolve the amide I band, which showed four major secondary bands centered at 1610, 1630, 1656 and 1684 cm−1, as shown in Fig. 2(a).
Figure 2.
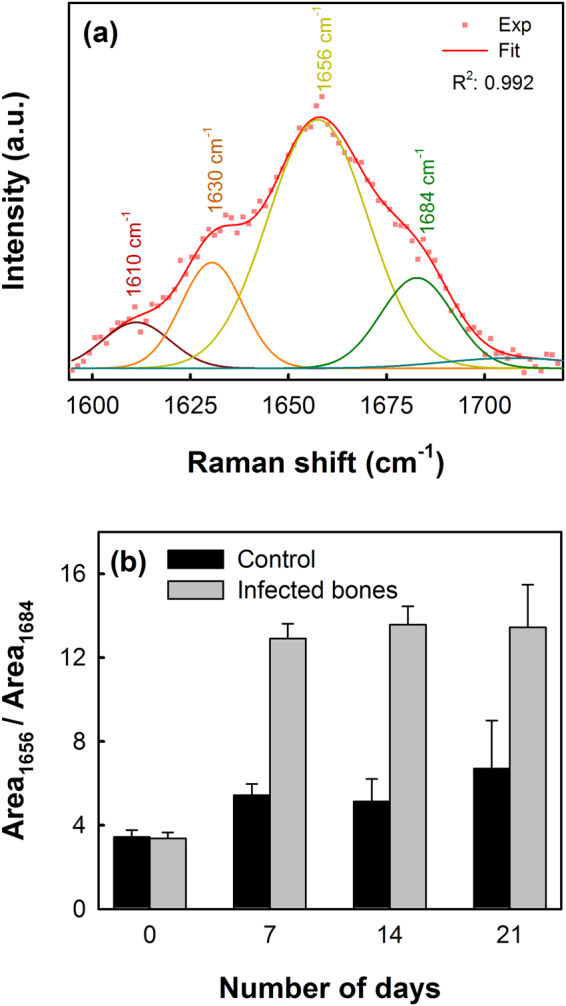
(a) Typical curve fitting of Amide I Raman band centered at 1656 cm−1 showing the center of the secondary structures of the amide I band and (b) collagen crosslinking ratio shown as the area ratio of Raman bands at 1656 cm−1 to 1684 cm−1 representing the non-reducible and reducible collagen types respectively.
The collagen quality parameter can be assessed from the ratio of area under the 1656 cm–1 to 1684 cm–1 secondary structures in the amide I spectral region, which refers to the non-reducible (trivalent) to reducible (divalent) collagen crosslinking ratio13,24. Figure 2(b) shows the non-reducible/reducible collagen crosslinking ratio of bone samples with and without (control) bacterial infections. A considerable increase in the collagen crosslinking ratio (from 3.38 ± 0.27 to 12.91 ± 0.71), compared to the control samples (from 3.41 ± 0.31 to 5.43 ± 0.47), was observed within the first week for the S. aureus infected bones, representing an increase in the amount of the trivalent non-reducible cross-links due to the transformation of the divalent reducible and/or subsequently from the decrease of the reducible collagen type or its reduced formation. Between the second and third week no substantial changes were observed in the crosslinking ratio. A student t-test carried out between the two set of data returned a p-value of 0.052.
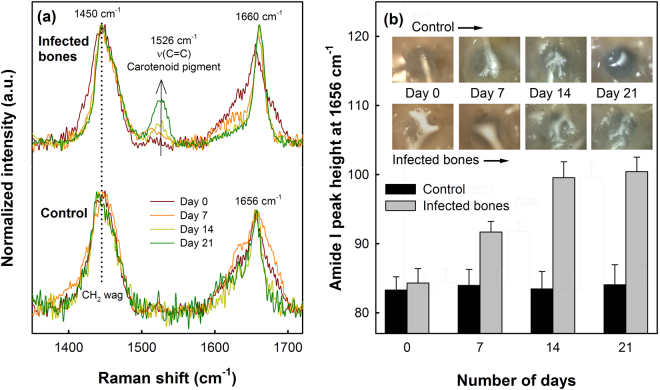
The intensity of the amide I band of infected bones at 1656 cm−1 was also compared to control samples for the evaluation of altered collagen quality, as shown in Fig. 3. In the case of the control sample, no significant variations in the Amide I Raman band were observed during the 21 days of incubation. However, the height of the Amide I band for the S. aureus infected bones was found to increase continuously over the period studied here. A shift of the amide I band from 1656 cm−1 to 1660 cm−1 in the case of the bacteria infected bones was also observed, along with the characteristic Raman band of carotenoid pigment from S. aureus bacteria at 1526 cm−1, which can be observed to increase continuously in the infected bones as the incubation period was increased indicating the bacterial cell growth. Whereas the carotenoid Raman band, as expected, was not detected in the control samples or in the absence of S. aureus bacteria. Although we obtained a low p-value (0.054) from t-test, visually no changes could be observed between the control and the infected bones during the incubation period as shown in the inset of Fig. 3(b).
Figure 3.
(a) Variations in amide I Raman bands of the control (down) and S. aureus infected bones (above) up to 21 days. For comparison, spectra were normalized to the CH2 wag band at 1450 cm−1. (b) Variations in the Amide I band intensity at 1656 cm−1 for the control and infected bones with respect to the number of incubation days. Inset shows the optical images (size: 500 μm × 500 μm) of control and infected bone surfaces showing no considerable visual changes in the samples during the incubation periods.
Mineral-to-Matrix ratio
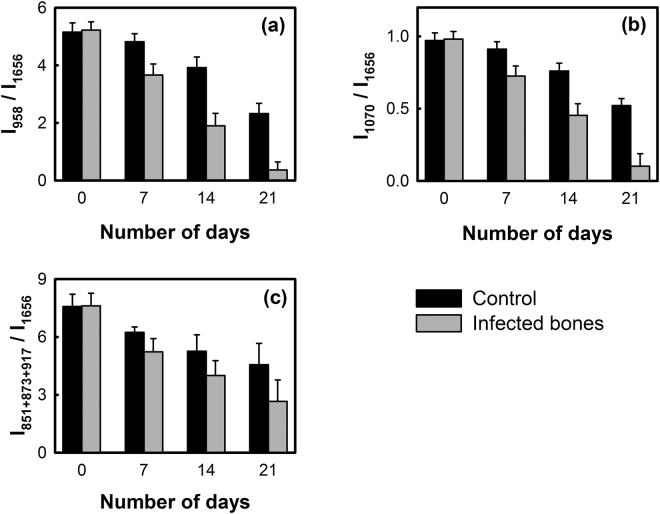
The parameter mineral-to-matrix ratio (MMR), which is a measure of the amount of mineralization in bone, provides information on bone tissue compositions29. MMR is typically calculated as the ratio of mineral specific Raman band intensities (phosphate and carbonate bands at 958 and 1070 cm−1, respectively) to the intensity of amide I band at 1656 cm−1 or as a ratio of phosphate band intensity to the total intensity of proline and hydroxyproline Raman bands at 851 cm−1, 873 cm−1 and 917 cm−1. MMR calculated using amide I band is not solely specific to the collagen matrix, while the latter, estimated from proline and hydroxyproline is specific to the changes in the collagen matrix.
Figure 4 shows the MMR of human bones with and without S. aureus infections estimated by using both amide I and proline/hydroxyproline bands. In case of the healthy bones (control samples), mean phosphate/amide I ratio (Fig. 4(a)) was found to decrease gradually with time from 5.15 ± 0.32 to 2.33 ± 0.35 during the 21 days of incubation period. However, a substantial decrease in the mean phosphate/amide I ratio was found in the case of S. aureus infected bones showing almost 93% reductions in phosphate/amide I ratio during the incubation period yielding a final ratio as low as 0.36 ± 0.28 (p-value: 0.063). Similarly, the carbonate/amide I (Fig. 4(b)) ratio also reduced by 90% (from 0.98 ± 0.04 to 0.10 ± 0.08) upon the incubation with S. aureus within 21 days, compared to 47% reduction (from 0.97 ± 0.05 to 0.52 ± 0.04) observed in the absence of any bacteria (p-value: 0.058).
Figure 4.
Mineral-to-matrix ratio (MMR) of control and infected bone samples estimated from the intensity ratio of (a) primary phosphate band at 958 cm−1, (b) carbonate band at 1070 cm−1 and (c) total intensities of proline and hydroxyproline bands at 851 cm−1, 873 cm−1 and 917 cm−1 to the intensity of amide I band at 1656 cm−1.
The MMR calculated by using proline/hydroxyproline Raman bands is shown in Fig. 4(c), which also indicated faster decay in the amount of mineralization in the case of the S. aureus infected bones compared to the healthy bones. In case of the healthy bones, almost 40% reduction in the mean MMR was observed (from 7.58 ± 0.63 to 4.56 ± 1.10) within 21 days, whereas in infected bones the ratio decreased to 2.64 ± 1.11 (p-value: 0.084) in 21 days which is almost 65% lower than the initial value.
Mineral quality and crystallinity
Mineral quality of infected bones was then studied by comparing the area of carbonate-to-phosphate band ratio, which provides information on the quality of minerals or chemical composition of bones that varies with bone architecture, age and mineral crystallinity30,31.
Figure 5 shows the carbonate-to-phosphate band ratio for the healthy and S. aureus infected bones. Within the first week of incubation, healthy or infected bone samples did not show any significant changes in the carbonate-to-phosphate ratio. However, as the incubation period was increased, the carbonate-to-phosphate ratio was observed to increase at a higher rate in the case of the infected bones compared to the healthy bones. At the end of the third week, almost 53% increase in the ratio (from 0.188 ± 0.011 to 0.287 ± 0.016) was recorded for the S. aureus infected bones, whereas the bones incubated in the absence of S. aureus showed only about 22% increase (from 0.191 ± 0.010 to 0.228 ± 0.014) after 21 days (p-value: 0.078).
Figure 5.
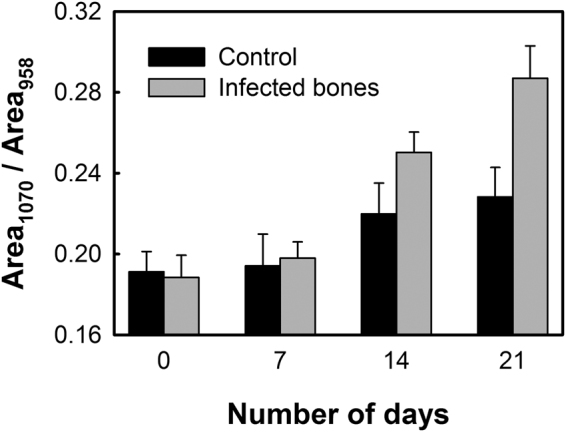
Carbonate-to-phosphate ratio of the control and infected bone samples estimated from the area ratio of the carbonate band at 1070 cm−1 to the phosphate band at 958 cm−1.
From Raman spectrum of bone, mineral crystallinity can be estimated by using the width of the primary phosphate band, which is mathematically described as the reciprocal of the full-width-half-maximum (FWHM) of the phosphate band located at 958 cm−1,32. A narrower FWHM of the phosphate band will, therefore, represent higher degree of mineral crystallinity, and vice versa. Figure 6 shows the variations of mineral crystallinity in the bones with and without the S. aureus infections, estimated from the FWHM of the phosphate band at 958 cm−1. In both the cases the mineral crystallinity was found to decrease, while compared to the healthy bones, the decay rate of crystallinity was much faster in the infected bones. After three weeks of incubation, the mineral crystallinity of the infected bones dropped to 26% of the initial value compared to the 9% drop observed in the case of the healthy bones indicating higher loss of mineral crystallinity upon bacterial infections (p-value: 0.073).
Figure 6.
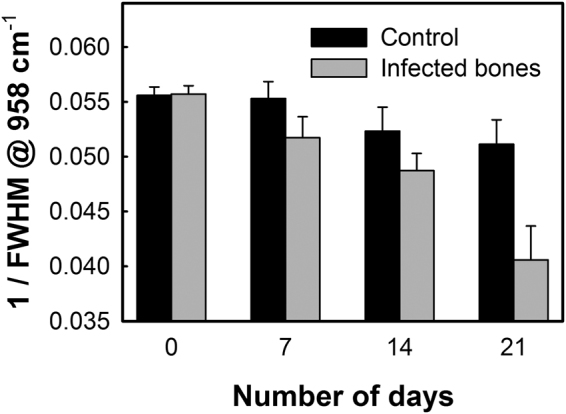
Mineral crystallinity in the control and infected bones estimated as the reciprocal of the full-width-half-maximum (FWHM) of the phosphate band at 958 cm−1.
Discussion
Osteomyelitis imposes a great challenge for the treating physician. Despite significant clinical and socioeconomic burden, existing resources to diagnose osteomyelitis at an early stage remain inadequate. The current practice depends on the clinical examination, laboratory results and radiological features which are regarded as non-conclusive in most cases33–35. In this study we have systematically investigated the changes that S. aureus bacterial infection (in-vitro) produces in human bone samples using Raman spectroscopy. Ability to make measurements in the back-scattering mode, without the need for the light to pass through the tissue is a major advantage as it allows in-vivo analysis of tissues. The purpose of this study was to investigate the bone quality upon S. aureus infection, which is the predominant microbe causing osteomyelitis.
The human bone samples co-cultured with S. aureus bacteria showed a significant loss in the bone quality and protein conformation over time, which were studied in-vitro and compared with control samples (without bacterial infections). The intermolecular crosslinking of bone collagen is a key element contributing to robust fibrillar scaffolds with important mechanical properties such as tensile strength and viscoelasticity36. The amide I Raman band is typically an indicator of protein conformation due to the role of the amide moiety in cross linking and bonding37. Alterations in collagen network due to the staphylococcal infection, leading to weaker bone strength, can be analyzed from the secondary structures of collagen obtained by partially resolving the broad amide I Raman band at 1656 cm−1, as shown in Fig. 2(a). The non-reducible to reducible collagen crosslinking ratio (Fig. 2(b)) show that the quantity of trivalent non-reducible collagen cross-links increases significantly in case of the S. aureus infected bones compared to the control samples. The type I collagen, which is synthesized by osteoblasts, undergoes extensive posttranslational modifications leading to a characteristic pattern of cross-links that defines the structural and mechanical properties of bones, and hence any disorder will result in dysfunction of bone tissue. Increasing of the non-reducible collagen crosslinking at a faster rate, therefore, implies that the collagen fibers get more strongly interconnected upon bacterial infection losing their elastic property38. Variations in the collagen quality were also evident from the increasing height of the amide I Raman band with increasing incubation time, observed in case of the S. aureus infected bone samples (Fig. 3). An increase in the amide I band height at 1656 cm−1 has been attributed to altered collagen quality induced by various factors such as aging9, dehydration10 and radiologic damages11. However, these factors can be ruled out from influencing our results, since all samples used in this study were collected from patients of similar ages, kept moist during incubation period with sterile saline water and no radiological conditions were applied in the study. The observed increase in the amide I peak height can be correlated to the increase in the non-reducible collagen types as observed earlier in Fig. 2(b). A shift of the amide I band from 1656 cm−1 to 1660 cm−1 in the case of the infected bones (Fig. 3(a)) also indicates raptured collagen crosslinking12.
The quality and strength of bone is not only dependent on collagen crosslinking, but also on the amount of mineralization, mineral quality and crystallinity. The amount of mineralization estimated as mineral-to-matrix ratio (MMR) clearly indicate that upon S. aureus invasion, the loss of relative mineral content in bones is higher compared to the healthy bones (Fig. 4). This affects the bone strength by making them weaker at a faster rate rendering them susceptible to fracture33,34. The characteristic carbonate band around 1070 cm−1 in the Raman spectrum (Fig. 1(a)) also indicates phosphate positions in the apatitic lattice that are prone to ionic substitution, known as “B-type” carbonate substitution24,39. It has been reported in mouse model study that stiffness and bending modulus of bone depend significantly on the degree of mineralization, mineral crystallinity, and B-type carbonate substitution40. We have found almost 22% increase in the carbonate-to-phosphate ratio (Fig. 5) of the control bone samples in 21 days, whereas the ratio was found to further increase by almost 53% in the case of the S. aureus infected bones. This suggests that the B-type carbonate substitution is enhanced upon bacterial infection leading to an increase in the brittleness of the bones41.
The ability of bone to perform its mechanical functions is also strongly dependent on its mineral crystallinity, which reflects the changes in the mineral crystal size and lattice perfections42,43. Variations in the mineral crystallinity, and thereby alterations in crystal dimensions affects bone mechanics by inducing micro-strains within and around the crystal lattice. In human cortical bone, it has been reported that the tissue-level strength and stiffness increase with increasing crystallinity while the ductility reduces44. In the case of the S. aureus infected bone samples, we found almost 26% reduction in the crystallinity within 21 days of infection which was more than twice of the control bone samples. Therefore, the increased B-type carbonate substitution ratio and reduced crystallinity found upon S. aureus infection strongly implies a severe loss in the bone mineral quality and mechanical strength, which can lead to possible bone death or make them prone to fracture. However, it is also important to mention here that especially for the samples infected with bacteria after prolonged incubation, that the resultant Raman signals are also influenced by increasing bacterial concentration on the sample surface. To conclude any bacteria induced changes in the bone samples, especially the infected bone samples after a period of incubation, multiple analysis from different region is necessary since interference from bacteria during the Raman measurements cannot be avoided. This will be more important in the case of in-vivo studies where spectral contributions from the bacteria during Raman measurements cannot be removed and hence this in-vitro study is closer to actual conditions that will be faced during real-time in-vivo measurements.
In summary, we have used Raman spectroscopy to investigate the adverse effect of S. aureus infection on human bone samples and showed possible use of the technique as an early diagnostic tool for staphylococcal osteomyelitis. The implications of early diagnosis, especially if achieved non-invasively would be immense. It would facilitate early specific treatment of the patient and help rule out other conditions such as avascular necrosis. In this work we have focused on the interactions between the bone and bacteria without seeking to understand the possible effects of immune response, which might alter the bacterial degradation profile. This can be further followed separately in an in-vivo study.
One of the main draw-backs of Raman spectroscopy, that so far has partly limited the translation into the clinic, is the relatively low efficiency of the inelastic light scattering compared to elastic scattering, fluorescence emission or absorption of infrared light45. The clinical implication of this limitation is that it makes in-vivo imaging of deeper structures such as bones difficult. We are currently exploring two different approaches to overcome this. One is Spatially Offset Raman spectroscopy (SORS) as described by Buckley et al.22 for sub-cutaneous bones like tibia, and the other is a fiber optic probe within a hypodermic needle as described by Petterson et al.46 for deeper bone analysis, such as hips.
A drawback of this study is that we did not monitor the progression of the osteomyelitis histologically. This would have allowed us to correlate the Raman spectroscopic changes with the histological changes. However, the contribution of the immune response would still be absent in an in-vitro study. We are therefore, carrying out an in-vivo study, which will include histological examination in order to correlate the histological changes with Raman spectroscopic findings.
From a clinical perspective, use of Raman spectroscopy is likely to add to the armamentarium available to the clinician especially in a condition such as osteomyelitis where early diagnosis and prompt treatment would prevent bone destruction and thereby save the patient from long term morbidity.
Electronic supplementary material
Acknowledgements
The authors would like to acknowledge Dr. Sultan Al-Maskari for providing the bone samples. TB and JD would like to thank The Research Council of Oman for partial financial support to carry out this research work through the Chair in Nanotechnology program.
Author Contributions
M.K. contributed in developing the concept, obtaining the ethics committee permission, interpretation of the results and preparation of the manuscript; T.B. contributed in data acquisition, analysis and interpretation of the results and drafted the manuscript; A.A.G. and S.T. were involved in the preparation of the bone samples and bacterial growths; J.D. contributed together with M.K. in developing the concept and critically revising the manuscript. All authors have read and approved the final submitted manuscript.
Competing Interests
The authors declare no competing interests.
Footnotes
Electronic supplementary material
Supplementary information accompanies this paper at 10.1038/s41598-018-27752-z.
Publisher's note: Springer Nature remains neutral with regard to jurisdictional claims in published maps and institutional affiliations.
References
- 1.Lew DP. allowed & Waldvogel, F. A. Osteomyelitis. New Engl. J. Med. 1997;336:999–1007. doi: 10.1056/NEJM199704033361406. [DOI] [PubMed] [Google Scholar]
- 2.Beck-Broichsitter BE, Smeets R, Heiland M. Current concepts in pathogenesis of acute and chronic osteomyelitis. Curr. Opin. Infect. Dis. 2015;28:240–245. doi: 10.1097/QCO.0000000000000155. [DOI] [PubMed] [Google Scholar]
- 3.Brady RA, Leid JG, Costerton JW, Shirtliff ME. Osteomyelitis: clinical overview and mechanisms of infection persistence. Clin. Microbiol. Newslett. 2006;28:65–72. doi: 10.1016/j.clinmicnews.2006.04.001. [DOI] [Google Scholar]
- 4.Widaa A, Claro T, Foster TJ, O’Brien FJ, Kerrigan SW. Staphylococcus aureus protein A plays a critical role in mediating bone destruction and bone loss in osteomyelitis. PLoS ONE. 2012;7:e40586. doi: 10.1371/journal.pone.0040586. [DOI] [PMC free article] [PubMed] [Google Scholar]
- 5.Shirtliff ME, Cripps MW, Mader JT. Retrospective review of 728 patients with long bone osteomyelitis in. The General Meeting of The American Society for Microbiology. 1999;99:188–189. [Google Scholar]
- 6.Wright JA, Nair SP. Interaction of staphylococci with bone. Int. J. Med. Microbiol. 2010;300:193–204. doi: 10.1016/j.ijmm.2009.10.003. [DOI] [PMC free article] [PubMed] [Google Scholar]
- 7.Vaudaux, P., François, P., Lew, D. P. & Waldvogel, F. A. Host factors predisposing to and influencing therapy of foreign body infections in Infections Associated with Indwelling Medical Devices (ed. Waldvogel, F. A. & Bisno, A. L.) 1–26 (American Society of Microbiology, 2000).
- 8.Sinha B, et al. Fibronectin-binding protein acts as Staphylococcus aureus invasin via fibronectin bridging to integrin alpha5beta1. Cell Microbiol. 1999;1:101–117. doi: 10.1046/j.1462-5822.1999.00011.x. [DOI] [PubMed] [Google Scholar]
- 9.Hudson MC, Ramp WK, Nicholson NC, Williams AS, Nousiainen MT. Internalization of Staphylococcus aureus by cultured osteoblasts. Microb. Pathogenesis. 1995;19:409–419. doi: 10.1006/mpat.1995.0075. [DOI] [PubMed] [Google Scholar]
- 10.Proctor RA, van Langevelde P, Kristjansson M, Maslow JN, Arbeit RD. Persistent and relapsing infections associated with small-colony variants of Staphylococcus aureus. Clin. Infect. Dis. 1995;20:95–102. doi: 10.1093/clinids/20.1.95. [DOI] [PubMed] [Google Scholar]
- 11.Howard CB, Einhorn M, Dagan R, Yagupski P, Porat S. Fine-needle bone biopsy to diagnose osteomyelitis. J. Bone Joint Surg. Br. 1994;76:311–314. doi: 10.1302/0301-620X.76B2.8113300. [DOI] [PubMed] [Google Scholar]
- 12.Jacobson IV, Sieling WL. Microbiology of secondary osteomyelitis. Value of bone biopsy. S. Afr. Med. J. 1987;72:476–477. [PubMed] [Google Scholar]
- 13.Orkoula MG, Kontoyannis CG. Raman spectroscopy for the study of biological organisms (biogenic materials and biological tissues): a valuable analytical tool. Spectrosc. Europe. 2014;26:16–19. [Google Scholar]
- 14.McCreadie BR, et al. Bone tissue compositional differences in women with and without osteoporotic fracture. Bone. 2006;39:1190–1195. doi: 10.1016/j.bone.2006.06.008. [DOI] [PubMed] [Google Scholar]
- 15.Gamsjaeger S, et al. Effects of one-year daily teriparatide treatment on trabecular bone material properties in postmenopausal osteoporotic women previously treated with alendronate or risedronate. Bone. 2011;49:1160–1165. doi: 10.1016/j.bone.2011.08.015. [DOI] [PubMed] [Google Scholar]
- 16.Esmonde-White KA, Esmonde-White FW, Holmes CM, Morris MD, Roessler BJ. Alterations to bone mineral composition as an early indication of osteomyelitis in the diabetic foot. Diabetes care. 2013;36(11):3652–3654. doi: 10.2337/dc13-0510. [DOI] [PMC free article] [PubMed] [Google Scholar]
- 17.Gamsjaeger S, et al. Effects of 3 years treatment with once-yearly zoledronic acid on the kinetics of bone matrix maturation in osteoporotic patients. Osteoporos Int. 2013;24:339–347. doi: 10.1007/s00198-012-2202-8. [DOI] [PubMed] [Google Scholar]
- 18.Busse B, et al. Vitamin D deficiency induces early signs of aging in human bone, increasing the risk of fracture. Sci Transl Med. 2013;5:193ra8. doi: 10.1126/scitranslmed.3006286. [DOI] [PubMed] [Google Scholar]
- 19.Olejnik C, et al. Molecular alterations of bone quality in sequesters of bisphosphonates-related osteonecrosis of the jaws. Osteoporos Int. 2014;25:747–756. doi: 10.1007/s00198-013-2514-3. [DOI] [PubMed] [Google Scholar]
- 20.Kim G, Cole JH, Boskey AL, Baker SP, van der Meulen MCH. Reduced tissue-level stiffness and mineralization in osteoporotic cancellous bone. Calcif Tissue Int. 2014;95:125–131. doi: 10.1007/s00223-014-9873-4. [DOI] [PMC free article] [PubMed] [Google Scholar]
- 21.Imbert L, Auregan J-C, Pernelle K, Hoc T. Mechanical and mineral properties of osteogenesis imperfecta human bones at the tissue level. Bone. 2014;65:18–24. doi: 10.1016/j.bone.2014.04.030. [DOI] [PubMed] [Google Scholar]
- 22.Buckley, K. J. G. et al. Measurement of abnormal bone composition in vivo using noninvasive Raman spectroscopy. IBMS BoneKEy11 (2014).
- 23.Beattie JR, et al. Raman Spectroscopic Analysis of Fingernail Clippings Can Help Differentiate Between Postmenopausal Women Who Have and Have Not Suffered a Fracture. Clinical medicine insights. Arthritis and musculoskeletal disorders. 2016;9:109. doi: 10.4137/CMAMD.S38493. [DOI] [PMC free article] [PubMed] [Google Scholar]
- 24.Morris M, Mandair G. Raman assessment of bone quality. Clin. Orthop. Relat. Res. 2011;469:2160–2169. doi: 10.1007/s11999-010-1692-y. [DOI] [PMC free article] [PubMed] [Google Scholar]
- 25.Gasior-Glogowska M, Komorowska M, Hanuza J, Ptak M, Kobielarz M. Structural alteration of collagen fibres - spectroscopic and mechanical studies. Acta Bioeng. Biomech. 2010;12:55–62. [PubMed] [Google Scholar]
- 26.Maiti NC, Apetri MM, Zagorski MG, Carey PR, Anderson VE. Raman spectroscopic characterization of secondary structure in natively unfolded proteins: alpha-synuclein. J. Am. Chem. Soc. 2004;126:2399–2408. doi: 10.1021/ja0356176. [DOI] [PubMed] [Google Scholar]
- 27.Nguyen TT, et al. Raman comparison of skin dermis of different ages: focus on spectral markers of collagen hydration. J. Raman Spectrosc. 2013;44:1230–1237. doi: 10.1002/jrs.4355. [DOI] [Google Scholar]
- 28.Scholtes-Timmerman M, et al. A novel approach to correct variations in Raman spectra due to photo-bleachable cellular components. Analyst. 2009;134:387–393. doi: 10.1039/B811596F. [DOI] [PubMed] [Google Scholar]
- 29.McCreadie BR, et al. Bone tissue compositional differences in women with and without osteoporotic fracture. Bone. 2006;39:1190–1195. doi: 10.1016/j.bone.2006.06.008. [DOI] [PubMed] [Google Scholar]
- 30.Legros R, Balmain N, Bonel G. Age-related changes in mineral of rat and bovine cortical bone. Calcif. Tissue Int. 1987;41:137–144. doi: 10.1007/BF02563793. [DOI] [PubMed] [Google Scholar]
- 31.Yerramshetty JS, Lind C, Akkus O. The compositional and physicochemical homogeneity of male femoral cortex increases after the sixth decade. Bone. 2006;39:1236–1243. doi: 10.1016/j.bone.2006.06.002. [DOI] [PubMed] [Google Scholar]
- 32.Freeman JJ, Wopenka B, Silva MJ, Pasteris JD. Raman spectroscopic detection of changes in bioapatite in mouse femora as a function of age and in vitro fluoride treatment. Calcif. Tissue Int. 2001;68:156–162. doi: 10.1007/s002230001206. [DOI] [PubMed] [Google Scholar]
- 33.Sadat-Ali M, al-Umran K, al-Habdan I, al-Mulhim F. Ultrasonography: can it differentiate between vasoocclusive crisis and acute osteomyelitis in sickle cell disease? J. Pediatr. Orthop. 1998;18:552–554. [PubMed] [Google Scholar]
- 34.Berger E, Saunders N, Wang L, Friedman JN. Sickle cell disease in children: differentiating osteomyelitis from vaso-occlusive crisis. Arch. Pediatr. Adolesc. Med. 2009;163:251–255. doi: 10.1001/archpediatrics.2008.545. [DOI] [PubMed] [Google Scholar]
- 35.Inusa BPD, Oyewo A, Brokke F, Santhikumaran G, Jogeesvaran KH. Dilemma in differentiating between acute osteomyelitis and bone infarction in children with sickle cell disease: the role of ultrasound. PLoS ONE. 2013;8:e65001. doi: 10.1371/journal.pone.0065001. [DOI] [PMC free article] [PubMed] [Google Scholar]
- 36.Paschalis EP, et al. Bone Fragility and Collagen Cross-Links. J. Bone Miner. Res. 2004;19:2000–2004. doi: 10.1359/jbmr.040820. [DOI] [PMC free article] [PubMed] [Google Scholar]
- 37.Bandekar J. Amide modes and protein conformation. BBA-Protein. Struct. M. 1992;1120:123–143. doi: 10.1016/0167-4838(92)90261-B. [DOI] [PubMed] [Google Scholar]
- 38.Orkoula MG, Vardaki MZ, Kontoyannis CG. Study of bone matrix changes induced by osteoporosis in rat tibia using Raman spectroscopy. Vib. Spectrosc. 2012;63:404–408. doi: 10.1016/j.vibspec.2012.09.016. [DOI] [Google Scholar]
- 39.McConnell D. The Problem of the Carbonate Apatites. Science. 1954;119:913. doi: 10.1126/science.119.3104.913-a. [DOI] [PubMed] [Google Scholar]
- 40.Akkus O, Adar F, Schaffler MB. Age-related changes in physicochemical properties of mineral crystals are related to impaired mechanical function of cortical bone. Bone. 2004;34:443–453. doi: 10.1016/j.bone.2003.11.003. [DOI] [PubMed] [Google Scholar]
- 41.Wopenka B, Pasteris JD. A mineralogical perspective on the apatite in bone. Mater. Sci. Eng. C. 2005;25:131–143. doi: 10.1016/j.msec.2005.01.008. [DOI] [Google Scholar]
- 42.Judex S, et al. Combining high-resolution micro-computed tomography with material composition to define the quality of bone tissue. Curr. Osteoporos. Rep. 2003;1:11–19. doi: 10.1007/s11914-003-0003-x. [DOI] [PubMed] [Google Scholar]
- 43.Boskey A. Bone mineral crystal size. Osteoporos. Int. 2003;14:16–21. doi: 10.1007/s00198-003-1468-2. [DOI] [PubMed] [Google Scholar]
- 44.Yerramshetty JS, Akkus O. The associations between mineral crystallinity and the mechanical properties of human cortical bone. Bone. 2008;42:476–482. doi: 10.1016/j.bone.2007.12.001. [DOI] [PubMed] [Google Scholar]
- 45.Kong K, Kendall C, Stone N, Notingher I. Raman spectroscopy for medical diagnostics — From in-vitro biofluid assays to in-vivo cancer detection. Adv. Drug Deliver. Rev. 2015;89:121–134. doi: 10.1016/j.addr.2015.03.009. [DOI] [PubMed] [Google Scholar]
- 46.Petterson, I. E. I., John, C. C. D., Leanne, M., Fullwood, B. Gardner & Nick Stone. Characterisation of a fibre optic Raman probe within a hypodermic needle. Analytical and bioanalytical chemistry407, no. 27. 8311–8320 (2015). [DOI] [PubMed]
Associated Data
This section collects any data citations, data availability statements, or supplementary materials included in this article.
Supplementary Materials
Data Availability Statement
The datasets generated during and/or analyzed during the current study are available from the corresponding author on reasonable request.


