

Abstract
The recent availability of different transgenic mouse lines coupled with other modern molecular techniques has led to the discovery of an unexpectedly large cellular diversity and synaptic specificity in striatal interneuronal circuitry. Prior research has described three spontaneously active interneuron types in mouse striatal slices: the cholinergic interneuron, the neuropeptide Y-low threshold spike interneuron, and the tyrosine hydroxylase interneurons (THINs). Using transgenic Htr3a-Cre mice, we now characterize a fourth population of spontaneously active striatal GABAergic interneurons termed spontaneously active bursty interneurons (SABIs) because of their unique burst-firing pattern in cell-attached recordings. Although they bear some qualitative similarity in intrinsic electrophysiological properties to THINs in whole-cell recordings, detailed analysis revealed significant differences in many intrinsic properties and in their morphology. Furthermore, all previously identified striatal GABAergic interneurons have been shown to innervate striatal spiny projection neurons (SPNs), contributing to the suggestion that the principal function of striatal GABAergic interneurons is to provide feedforward inhibition to SPNs. Here, very surprisingly, paired recordings show that SABIs do not innervate SPNs significantly. Further, optogenetic inhibition of striatal Htr3a-Cre interneurons triggers barrages of IPSCs in SPNs. We hypothesize that these IPSCs result from disinhibition of a population of GABAergic interneurons with activity that is constitutively suppressed by the SABIs. We suggest that the SABIs represent the first example of a striatal interneuron-selective interneuron and, further, that their existence, along with previously defined interneuronal networks, may participate in the formation of SPN ensembles observed by others.
SIGNIFICANCE STATEMENT Before ∼2010, the main function of the three known subtypes of striatal GABAergic interneurons was assumed to mediate feedforward inhibition of the spiny neurons (SPNs). During the past decade, we and others have described several novel populations of striatal GABAergic interneurons and their synaptic connections and have shown that striatal interneurons and SPNs interact through extensive and highly cell-type-specific connections that form specialized networks. Here, we describe a novel population of striatal GABAergic interneuron and provide several lines of evidence suggesting that it represents the first interneuron-selective interneuron in striatum. Striatal interneurons and their synaptic connections are suggested to play an important role in the formation of ensembles of striatal SPNs interconnected by inhibitory axon collaterals.
Keywords: basal ganglia, interneuron, interneuron-selective, network, optogenetic, striatum
Introduction
The neostriatum is composed almost entirely of GABAergic neurons. The vast majority of these are the spiny projection neurons (SPNs) that make up ∼95% of the rodent striatum (Graveland and DiFiglia, 1985; Gerfen and Surmeier, 2011). The remaining neurons consist of cholinergic interneurons (CINs) and several different subtypes of GABAergic interneurons (Kawaguchi, 1993; Kawaguchi et al., 1995; Wu and Parent, 2000; Tepper and Bolam, 2004; Ibáñez-Sandoval et al., 2010; Tepper et al., 2010). The identification and characterization of striatal interneurons, their synaptic connectivity, and the role(s) that they play in the organization and control of striatal output and striatal-dependent behaviors is evolving rapidly.
Classically, three different subtypes of neostriatal GABAergic interneurons have been distinguished neurochemically. These include parvalbumin (PV)-expressing fast-spiking interneurons (FSIs), calretinin-expressing interneurons, and a third interneuron that coexpresses neuropeptide Y (NPY), somatostatin, and nitric oxide synthase (NOS) termed plateau low threshold spike (PLTS) interneuron (Kawaguchi, 1993; Kawaguchi et al., 1995). We recently identified multiple subtypes of tyrosine hydroxylase-expressing striatal interneurons (THINs; Ibáñez-Sandoval et al., 2010), a second population of NPY-expressing interneurons called neurogliaform (NGF) cells (Ibáñez-Sandoval et al., 2011; English et al., 2011), and a population of serotonin receptor-3a subunit expressing GABAergic interneurons that we termed the fast-adapting interneurons (FAI; Faust et al., 2015).
The most common THIN subtype, TH type I interneurons, comprises 60–80% of all striatal THINs (Ibáñez-Sandoval et al., 2010, 2015; Unal et al., 2011). Evoked spiking in striatal THINs produces fast GABAA IPSP/Cs in SPNs (Ibáñez-Sandoval et al., 2010). Interestingly, intracellular current injection-evoked spikes in SPNs were able to elicit IPSPs in type I THINs, which was the first reported example of SPNs synapsing back onto a GABAergic interneuron. We recently showed that THINs also provide strong inhibitory input to low threshold spike (LTS) interneurons while avoiding FSI and NGF interneurons (Assous et al., 2017), demonstrating highly cell-type-specific connections among GABAergic interneurons.
In addition to the FAIs, which are not spontaneously active in brain slices (Faust et al., 2015), we found another electrophysiologically distinct subtype of GABAergic interneuron targeted in striatum of Htr3a-Cre mice made to express Td-Tomato (AAV5-DIO-Td-Tomato) by virally mediated gene transfer. These interneurons were spontaneously active in both whole-cell and cell-attached recording modes and exhibited many intrinsic electrophysiological properties that were very similar to those of type I THINs. However, none of the interneurons targeted in the Htr3a-Cre mice express TH (Faust et al., 2015). There were also several significant physiological difference, most strikingly an unusual burst firing pattern in cell-attached recordings and an almost complete absence of connection to SPNs. Here, using single and paired whole-cell recording and cell-attached recordings coupled with optogenetics, we analyzed the intrinsic electrophysiological properties, firing patterns, and connectivity of these novel GABAergic interneurons, compared them with those of previously identified striatal interneurons, and concluded that they comprise a novel type of GABAergic interneuron.
Materials and Methods
Animals.
All procedures used in this study were performed in agreement with the National Institutes of Health's Guide for the Care and Use of Laboratory Animals and with the approval of the Rutgers University Institutional Animal Care and Use Committee. Htr3a-Cre mice [Tg(Htr3a-Cre) NO152Gsat/Mmucd; UC Davis], NPY-GFP (stock 006417; The Jackson Laboratory), ChAT-ChR2 mice [Tg(Chat-COP4*H134R/EYFP,Slc18a3) 6Gfng/J; The Jackson Laboratory], and TH-Cre mice [Tg(TH-Cre)12Gsat; Gene Expression Nervous System Atlas (GENSAT)] were generated and maintained as hemizygotic. Mice were housed in groups of up to four per cage and maintained on a 12 h light cycle (7:00 A.M. to 7:00 P.M.) with ad libitum access to food and water.
Intracerebral viral injection.
Htr3a-Cre mice were anesthetized with isofluorane (1.5–2.5%, delivered with O2, 1 ml/min) and placed within a stereotaxic frame. Bupivacaine was used as a local anesthetic at the site of the incision. Coordinates to target the striatum were 0.6 mm anterior and 1.8 mm lateral to bregma. Noncompetent adeno-associated virus (AAV5-CAG-Flex-tdTomato or AAV5-DIO-epNHR3.0-eYFP; University of North Carolina, Vector Core Services, Chapel Hill, NC) was unilaterally injected by glass pipette to 3 sites −2.25, −2.65, and −3.2 mm ventral to brain surface for a total volume of 0.9 μl. The surgery and viral injection took place inside a Biosafety Level 2 isolation hood. Virus was injected at 0.92 nl/5 s, after which the pipette was left in place for 10 min before being slowly retracted. Viral transduction and transgene expression was allowed to proceed for a minimum of 3 weeks before animals were used for physiological experiments.
Slice preparation and visualized in vitro whole-cell recording.
Mice aged 3–6 months were deeply anesthetized with intraperitoneal injection of 100 mg/kg ketamine and perfused transcardially with an ice-cold N-methyl d-glucamine (NMDG)-based solution containing the following (in mm): 103.0 NMDG, 2.5 KCl, 1.2 NaH2PO4, 30.0 NaHCO3, 20.0 HEPES, 25.0 glucose, 101.0 HCl, 10.0 MgSO4, 2.0 thiourea, 3.0 sodium pyruvate, 12.0 N-acetyl cysteine, and 0.5 CaCl2, saturated with 95% O2 and 5% CO2, pH 7.2–7.4. After decapitation, the brain was quickly removed into a beaker containing ice-cold oxygenated NMDG-based solution before slicing. Oblique parahorizontal sections, 300 mm in thickness, were cut in the same medium using a Vibratome 3000. Sections were immediately transferred to an oxygenated NMDG-based solution at 35°C for 5 min, after which they were transferred to oxygenated normal Ringer's solution at 25°C until used. The recording chamber was perfused constantly (2–4 ml/min) with oxygenated Ringer's solution at 32–34°C. Drugs were applied in the perfusion medium and were dissolved freshly each day in Ringer's solution. Slices were initially visualized under epifluorescence illumination with a high-sensitivity digital frame transfer camera (SensiCam; Cooke) mounted on an Olympus BX50-WI epifluorescence microscope with a 40× long working distance water-immersion lens. Once a fluorescent interneuron was identified, visualization was switched to infrared–differential interference contrast microscopy for the actual patching of the neuron. Micropipettes for whole-cell recording were constructed from 1.2 mm outer diameter borosilicate pipettes on a Narishige PP-83 vertical puller. The standard internal solution for whole-cell current-clamp recording was as follows (in mm): 130 K-gluconate, 10 KCl, 2 MgCl2, 10 HEPES, 4 Na2ATP, and 0.4 Na2GTP, pH 7.3; 0.2% biocytin (σ) was also added to the internal solution to allow description of the neuronal morphology of recorded neurons. For the disinhibition experiments, we recorded SPNs using a CsCl-based internal solution containing the following (in mm): 125 CsCl, 0.1 EGTA, 10 HEPES, 2 MgCl2, 4 Na2ATP, and 0.4 Na2GTP. This solution also contained 0.2% (weight) Alexa Fluor 594 to verify the identity of SPNs visually. These pipettes had an in vitro resistance of 3–5MΩ. Membrane currents and potentials were recorded using an Axoclamp 700B amplifier (Molecular Devices) and digitized at 20–40 kHz with a Micro 1401 Mk II and a PC running Signal, version 5 (Cambridge Electronic Design). Optogenetic stimulation consisted of a 500 ms duration orange light pulses (590 nm) delivered using a high-power (750 mW) LED (mouser electronics, 720-LYW5SMHZJZ361, 18.3 cd luminous intensity). Sweeps were run at 30 s intervals. For the testing of synaptic transmission 20 Hz trains (10 spikes) were elicited in the presynaptic cell with short current pulses. Trains were delivered at 30 s intervals. Bicuculline methiodide (10 mm; Sigma-Aldrich) was used to block GABAA receptors.
Histology.
After whole-cell recording, slices containing biocytin-filled neurons were transferred into 4% paraformaldehyde with 15% picric acid in 0.1 m PB for overnight fixation (4°C). After multiple washes in PBS, sections were treated with 10% methanol and 3% H2O2 for 15 min, followed by 1% sodium borohydride for 15 min. Sections were then incubated with avidin–biotin–peroxidase complex (1:200; Vector Laboratories) and 0.5% Triton X-100 overnight at 4°C. After washing 6 times for 10 min in 0.1 m PB, the sections were reacted with 3,3′-diaminobenzidine (0.025%) and H2O2 (0.0008%) in PB with nickel intensification (2.5 mm nickel ammonium sulfate and 7 mm ammonium chloride). The 300-μm-thick sections were then resectioned at 100 μm using a Vibratome 3000. Sections were then postfixed in osmium tetroxide (0.1% in PB) for 30 min, dehydrated through a graded series of ethanol followed by propylene oxide, and infiltrated overnight with a mixture of propylene oxide and epoxy resin (Durcupan; Fluka Chemie). The sections were then transferred to fresh resin mixture for several hours and finally flat-embedded between glass slides and coverslips and polymerized at 60°C for 24 h. Z-stacks (1 μm) of biocytin-filled spontaneously active bursty interneurons (SABIs) were obtained at 40× (Olympus BX50) using Neurolucida 2007.2 (MBF Biosciences). Cells were fully reconstructed using Neurolucida and Sholl analyses were performed using concentric circles of 10 μm increments (Neurolucida Explorer 2007.2; MBF Biosciences).
Data analysis.
Most whole-cell recordings were analyzed using Signal (Cambridge Electronic Design) and statistical analysis was done using Prism (GraphPad).
Firing pattern analysis.
Action potential timestamps were extracted from cell-attached recordings. The burstiness of each trace was analyzed using custom MATLAB scripts based on methods described previously (Kaneoke and Vitek, 1996). Briefly, a density discharge histogram (DDH) was constructed for each recording by counting the number of discharge events occurring within the given time interval (t). A burstiness index (BI) was calculated by finding the smallest possible t value that resulted in a DDH significantly different from a Poisson distribution with a mean of 1.0 (p < 0.05), then taking the reciprocal of the resulting t value (BI = 1/t). Differences in BI between cell types were explored using one-way ANOVA followed by multiple-comparisons post hoc tests using Tukey's multiple-comparisons test.
Burst detection.
Individual spike trains were investigated for burst events with custom MATLAB scripts using the ISIN threshold method, as described previously (Bakkum et al., 2013). A burst event was defined as three spikes occurring within a predetermined interspike interval (ISI) threshold (ISI3). To determine this threshold, a probability distribution histogram was constructed illustrating the percentage of spikes falling within a range of potential ISI thresholds. In the resulting histogram, low-ISI (bursting) and high-ISI (nonbursting) regimes form a bimodal distribution along the base-10 logarithm of ISIN. The border between the two regimes, or the valley between the peaks, is designated the threshold (ISIN-threshold) value for burst detection in the given spike trace. This process was repeated for each recording and each recording trace was tested for bursts. In this method, burst detection is as follows: if N (in this case, 3) spikes occur within a time period equal to or less than the threshold value, then those spikes are assigned to a burst. When these conditions are no longer met, the assigned burst ends and the process is repeated. Data are represented as mean ± SEM unless indicated otherwise.
Results
Spontaneous firing activity of striatal interneurons
Previous reports have identified three subtypes of spontaneously active interneurons in ex vivo rodent striatum (CINs, NPY-expressing LTS, and THINs). These interneurons exhibit significant differences in response to intracellular current injections (Fig. 1). Here, we report the electrophysiological characteristics of another interneuron that is spontaneously active in whole-cell current-clamp recordings and cell-attached voltage-clamp recordings ex vivo in Htr3a-Cre mice. The new interneuron, termed the SABI (see below) shares many properties with the THINs when recorded in whole-cell mode (Fig. 1c,d). Both are usually spontaneously active, exhibit a relatively a high input resistance, and, most characteristically, extreme spike frequency accommodation leading to depolarization block during modest depolarizing current injections.
Figure 1.

Whole-cell current-clamp recordings of spontaneously active interneurons in mouse striatum. a–d, Membrane potential responses to injected current pulses (top) and current voltage responses (bottom) of spontaneously active striatal interneurons. a, Example of a typical CIN recorded in a ChAT-ChR2 mouse, b, NPY–LTS interneuron recorded in slice from an NPY-GFP mouse, c, d, THIN recorded in slice from a TH-Cre mouse (c) and SABI (d) (see below) recorded in slice from a Htr3a-Cre mouse. Note the strong similarities in appearance between the THIN (c) and the SABI (d).
As described previously, we also show that both CIN and LTS interneurons present a very regular, tonic firing activity in cell-attached mode. Most type I THINs also exhibit tonic firing, but we also found a smaller number of THINs with an irregular firing pattern (data not shown). In contrast, all SABIs fired in an unusual highly bursty firing pattern. We analyzed different parameters of the spontaneous firing of the four interneuron populations in cell-attached recordings (Fig. 2e–g). For median ISI, we found significant differences between SABIs and THINs and CINs (14.57 ± 2.03 ms for SABIs, n = 13 vs 238.8 ± 80.59 ms for THINs, n = 16; p ≤ 0.03 and 283.8 ± 42.78 ms for CIN, n = 17; p ≤ 0.005; one-way ANOVA). Consistent with the regular, tonic activity of CINs and LTS interneurons, these interneurons exhibited a low coefficient of variation (CV) of the ISI (0.3460 ± 0.06 for CINs and 0.49 ± 0.07 for LTS, n = 22). In contrast, SABIs showed a significantly greater CV than any other spontaneously active striatal interneuron (4.181 ± 0.67 for SABIs vs 1.683 ± 0.309 for THINs, p < 0.00001; p < 0.0001 vs CIN, p < 0.0001 vs PLTS; one-way ANOVA followed by Tukey's multiple-comparisons test). Comparing mean firing rate, the SABIs exhibited the highest mean firing rate, significantly greater than that of the other interneurons measured (16.53 ± 3.61 Hz for SABI vs 5.958 ± 1.29 Hz for THINs, p = 0.0026, CIN: 4.44 ± 0.603 Hz p ≤ 0.0005 vs SABI, LTS: 6.65 ± 0.84 Hz p = 0.0031 vs SABIs, one-way ANOVA followed by Tukey's multiple-comparisons test).
Figure 2.

Cell-attached voltage-clamp recordings of spontaneously active interneurons in mouse striatum. a–d, Representative cell-attached recordings of the same four interneuron types shown in Figure 1. a, b, CIN (a) and LTS (b) interneurons exhibit tonic, regular firing patterns. Most THINs (c) also exhibit tonic, but less regular firing. In contrast, most SABIs (d) exhibit extreme burst firing showing spike frequency adaptation, separated by periods of complete silence. e–g, Box plots representing the median ISI (e), CV (f), and mean firing rate (g) of the four interneuron populations measured in cell-attached mode. SABIs exhibit a significantly lower median ISI, a higher CV, and a higher firing rate than all the other spontaneously active interneurons. Box plots represent the minimum and maximum interquartile range and the mean and median. One-way ANOVA followed by Tukey's multiple-comparisons test: @SABI versus TH, *SABI versus CIN, and $SABI versus LTS.
Consistent with their tonic activity and low CV, LTS and CINs exhibit a low BI (mean 0.037 ± 0.006 for LTS and 0.026 ± 0.009 for CINs, p < 0.94 one-way ANOVA; Fig. 3a). THINs exhibit an intermediate BI (0.092 ± 0.02 p = 0.023 vs LTS; p < 0.01 vs CIN) with higher variability revealing certain heterogeneity in the THINs population. There was a significantly greater BI for SABIs (0.2371 ± 0.0196, p < 0.0001 vs CIN, LTS and THINs, one-way ANOVA followed by Tukey's multiple-comparisons test). This is consistent with the high CV measured for this population and reveals that the variability in the firing of those cells corresponds to the appearance of bursts. Interestingly, when plotting the BI versus the CV (Fig. 3b), we noted that the tonic regular firing cells (PLTS, CINs, and some THINs) are grouped on the bottom left, whereas the SABIs are scattered in the upper right part of the graph. Those data confirm that, of the spontaneously active striatal interneurons, only the SABIs (and to some extent a few THINs) exhibit a highly variable burst firing pattern.
Figure 3.

Bursting properties of SABIs. a, Box plots representing the BI (see text) of the spontaneously active interneuron populations. Note that the SABIs exhibit a significantly higher BI than all the other interneurons. b, Scatterplot of the BI (see text) versus the CV of the spontaneously active interneurons. Note that the LTS (blue) and CIN (green) are grouped in the bottom left, whereas the SABI (orange) are scattered in the top right of the graph. c, Example of the burst detection method used (ISI-N, see text). Black bars represent action potentials of SABI and red bars below represent groups of action potentials detected as bursts in a representative 30 s spike train. d–g, Box plots of different parameters of the burst analysis for the SABI. d, Percentage of spikes fired inside a burst. e, Number of spikes per burst. f, Average spike frequency inside the burst. g, Difference in spike frequency at the beginning versus at the end of the burst showing strong spike frequency adaptation. Box plots represent the minimum and maximum interquartile range and the mean and median. One-way ANOVA followed by Tukey's multiple-comparisons test: @SABI versus TH, *SABI versus CIN, and $SABI versus LTS.
To further analyze the bursting activity of the SABIs we used the ISI-N burst detection method (Bakkum et al., 2013; for details, see the Materials and Methods). This method allowed us to detect and analyze efficiently the presence of bursts in SABIs (Fig. 3c). The results revealed that almost all action potentials in SABIs were fired in bursts (97.1 ± 1.6%; Fig. 3d). The mean burst length was 423.31 ± 117.92 ms and comprised 31.3 ± 8.51 spikes/burst (Fig. 3e). The average intraburst firing frequency was 82.9 ± 9.076 Hz (Fig. 3f), but there was considerable spike frequency adaptation. We thus measured the instantaneous firing frequency at the beginning of the burst (1/ISI1) and at the end of the burst (1/ISIlast). Consistent with the example traces presented in Figures 1 and 3, there was a large difference in these 2 values (initial firing rate: 174.9 ± 22.78 vs final firing rate: 30.72 ± 2.88, p < 0.0001, paired t test; Fig. 3g).
Electrophysiologically identified SABIs were filled with biocytin during whole-cell recording. After processing, we selected four representative SABIs in which a significant proportion of the axonal field was preserved for reconstruction with Neurolucida and further analysis using Sholl plots (Figs. 4, 5). SABIs are medium-sized neurons (cell body perimeter: 73.94 ± 15.6 μm) emitting five to six primary dendrites branching ∼50 μm away from the soma and that ramify into a relatively sparse anisotropic field ∼150–200 μm in diameter. The total dendritic length of SABI represents 1979 ± 233 μm and a surface of 5219 ± 567.7 μm2. Secondary and higher-order dendrites are sparely but consistently invested with dendritic spines (63.5 ± 19.5 spines/neuron). The axonal arborization was relatively sparse, with prominent varicosities and generally comprised small, local fields surrounding the soma and extending well beyond, as well as occasional sparse extended axons that extended significantly beyond the dendritic arborization (∼300–500 μm away from the soma; Figs. 4, 5). The axonal field length represents 7914 ± 2263 μm and a surface of 9335 ± 2180 μm2. This is in sharp contrast to the axonal fields of both FSIs and THINs, which arborize densely and approximately symmetrically throughout and beyond the parent neuron's dendritic field, and likely has implications for the function of SABIs.
Figure 4.

Neurocytology of typical electrophysiologically identified SABI interneurons labeled with biocytin after whole-cell recording. Shown are typical photomicrographs of single 100 μm sections of resectioned biocytin-filled SABIs visualized with DAB staining. SABIs emit several primary dendrites that extend ∼50 μm before branching. Secondary and higher-order dendrites are sparsely invested with dendritic spines (black arrows, box 1 and box 3). The axonal arborization was to be relatively sparse (compared with those of THINs and FSIs), exhibited prominent varicosities, and comprised small dense and tortuous fields near the soma (box 4), as well as sparse extended axons that extended well beyond the dendritic arborization (box 3).
Figure 5.

3D reconstruction and Sholl analysis of SABIs filled with biocytin after recording. a–d, 3D reconstruction of four different SABIs. The soma and dendritic fields are represented in black and the axon in red in the reconstructed image and the associated Sholl plot. The number of spines plotted against the distance to the soma is represented in black. SABIs dendrites extend 150–200 μm away from the cell body,presenting a maximum number of intersection at ∼50 μm. The axonal field is relatively sparse, extending from 250–550 μm away from the soma and reaching a maximum number of intersections at ∼150 μm. e, Box plots showing the quantification of the number of primary dendrites, number of spines, the axon and dendritic length and surface, as well as the cell body perimeter of the four SABIs fully reconstructed.
Intrinsic electrophysiological differences between THINs and SABIs
Additional comparisons between THINs and SABIs were conducted in whole-cell recordings by analyzing responses to hyperpolarizing and depolarizing current steps (Fig. 6a,c). SABIs exhibited a slightly but significantly greater input resistance calculated at rest than THINs (640.3 ± 64.91 MΩ vs 498.5 ± 32.48 MΩ, respectively, p = 0.033, unpaired t test) and went into depolarization inactivation with smaller current injections (81.25 ± 11.69 pA vs 129.0 ± 13.97 pA, respectively, p = 0.023, unpaired t test; Fig. 6e).
Figure 6.

Differences in intrinsic electrophysiological properties between THINs and SABIs. a, c, Left, Schematics representing the experimental paradigms for AAV transduction with double floxed Td-Tomato of striatal TH and SABI interneurons in TH-Cre (a) and Htr3a-Cre (c) mice. Right, Membrane potential responses to injected current pulses of type I THINs (a) and SABIs (c). Both interneurons present a relatively high input resistance and a long-lasting plateau potential after depolarizing current pulse injection. Note the firing pattern of the SABI (c) that is often constituted of doublets or triplets of action potentials. b, Typical spontaneous firing activity of a THIN recorded in current-clamp mode. Note the regular tonic activity. d, Spontaneous firing activity recorded in approximately half of SABI exhibit membrane potential fluctuations resembling up and down states in SPNs, with action potential firing happening only during the beginning of the up state. e, I–V curve of populations of type I THINs (purple) and SABIs (orange). Although similar, the I–V curves are significantly different near rest. f, THINs and SABIs possess large input resistance. Although largely overlapping, SABI input resistance is significantly higher than that of THINs. g, Box plot measuring the minimum current necessary to induce depolarization block. h, Box plot of the membrane time constants of the two interneuron populations representing the minimum and maximum interquartile range and the mean and median. Statistical analysis was made using unpaired t test.
Interestingly, when recording in whole-cell mode, recordings of SABIs revealed two different spontaneous firing patterns, neither of which was seen in the cell-attached mode. Approximately half of the neurons fired tonically at low rates, as can be in the example traces in Figures 1 and 6. The other half exhibited large membrane potential fluctuations, ∼15 mV, similar to up and down states in described SPNs (Wilson, 1993; Wilson and Kawaguchi, 1996), with short bursts of action potentials riding on the beginning of the depolarization (Fig. 4d1,d2). Both firing patterns were stable; each was observed immediately after breaking in and persisted for the length of the recording without significant change and there were no cases in which one pattern switched to the other.
Analysis of the action potential waveform was conducted during whole-cell patch-clamp recordings of THINs and SABIs (Fig. 7). These analyses revealed significant differences between the two interneurons with respect to spike duration for half-width (0.729 ± 0.042 ms for SABIs, n = 23 vs 0.56 ± 0.018 ms for THINs, n = 22, p ≤ 0.001, unpaired t test; Fig. 7a,b) and 10–90% rise time (0.390 ± 0.0274 ms for SABIs vs 0.28 ± 0.01 ms for THINs, p ≤ 0.001, unpaired t test; Fig. 7a,c) and afterhyperpolarization amplitude (AHP) was −51.05 ± 0.91 mV for SABIs vs −55.22 ± 0.9 for THINs (p ≤ 0.003, unpaired t test; Fig. 7a,f). Consistent with previous reports, these characteristics are also different from the other studied spontaneously active striatal interneurons; the LTS interneurons and CINs (Fig. 7g).
Figure 7.
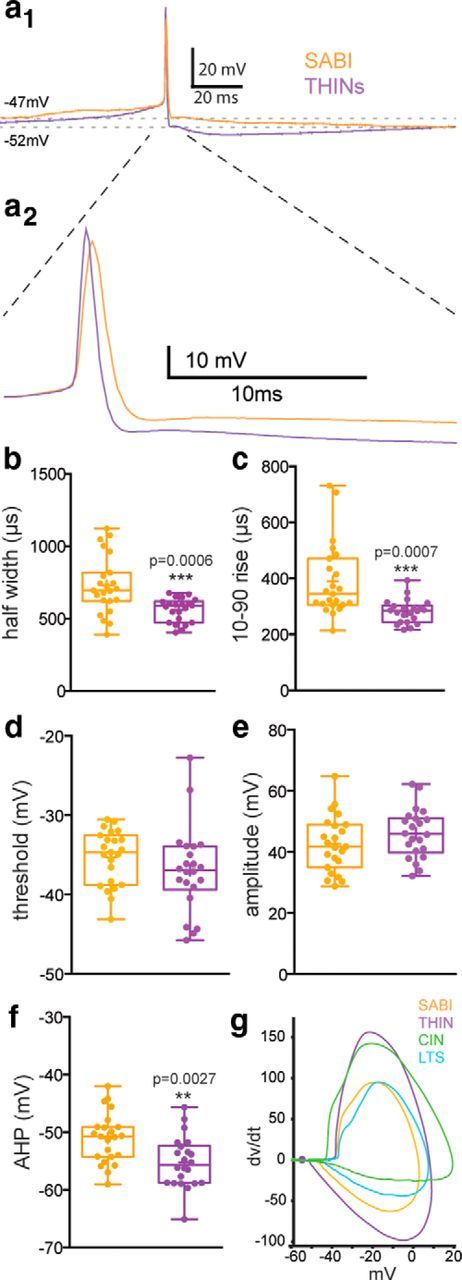
Comparison of action potential properties between THINs and SABI. a1, Action potential waveform of a type I THIN (purple) and a SABI (orange). a2, Expanded view of a1 clarifying the differences in the rising and falling phases of the action potential waveform and the AHP of the two interneuron populations. b–f, Box plots showing the minimum and maximum interquartile range and the mean and median reveal significant differences in spike half-width, rise time, threshold, amplitude, and AHP depth between THINs and SABIs. g, Phase plots reporting dV/dt as a function of voltage generated for a representative action potential of the four spontaneously active populations in the striatum show clear differences (CIN, green; LTS, blue; SABI, orange; THINs, purple). Statistical analysis was made using unpaired t tests.
Connectivity with the striatal output neurons
Similar to previous reports (Ibáñez-Sandoval et al., 2010; Xenias et al., 2015), we found bidirectional monosynaptic connections between THINs and SPNs. Synaptic connectivity was found in six of 34 pairs tested in which the presynaptic cell was a type I THIN corresponding to a connectivity probability of 17.65%. A typical example is shown in Figure 8a. For the pairs in which the presynaptic cell was a SPN, we found five connected pairs of 28 tested (Fig. 8b), corresponding to a connectivity probability of ∼18%, consistent with previous reports (Ibáñez-Sandoval et al., 2010). The mean amplitude IPSC for the TH to SPNs connection was 9.57 ± 2.16 pA and 12.14 ± 5.75 pA for the SPNs to THINs. Reciprocal synaptic connections among individual pairs of synaptically connected THINs and SPNs were not observed.
Figure 8.

Synaptic connectivity among THINs, SABIs, and SPNs. Examples of paired whole-cell recordings demonstrate significant differences of the monosynaptic connectivity between THINs or SABIs and SPNs. a, Train of evoked action potentials in a THIN induces IPSCs in a monosynaptically connected SPN. b, Train of evoked action potentials in a SABI fails to elicit any response in a nearby SPN. c, Train of evoked action potentials in a SPN elicits IPSCs in a THIN. d, Train of evoked action potentials in a SPN fails to elicit any response in a nearby SABI. e, Summary histograms illustrating the connection rates of different spontaneously active interneurons to SPNs. FSIs (pink) exhibit the highest connection rate to SPNs; THINs and LTS interneurons are lower and the connection rate for SABIs is extremely low (see text for additional details). f, Synaptic connection rate from SPNs to SABIs is similarly low, whereas that from THINs to SPNs is ∼18. In a and b, the postsynaptic neuron was recorded with a high-chloride internal solution (125 mm CsCl−).
In contrast, the connection probability between SABIs and SPN was extremely low, with only 2 of 45 SABIs found to elicit IPSCs in SPNs (4.4%). We observed a similar paucity of IPSCs in connected pairs in which the SPN was the presynaptic neuron and the SABI was the postsynaptic neuron (Fig. 8f). Of 24 pairs tested, only 1 SABI showed any a response (4.1%). In this case, the IPSCs after a train of evoked spikes in the SPN exhibited a different profile than seen with THINs, exhibiting a very high failure rate after the second and subsequent current pulses injected in the SPN (data not shown).
We compared the connection probability values of SABIs with SPNs with that of other GABAergic interneurons (Fig. 8e). The connection probability between FSIs and SPNs was the greatest (75%), as reported previously (Koós and Tepper, 1999; Taverna et al., 2007; Tepper and Koós, 2017). The connectivity between LTS and SPNs was two of nine pairs (22.22%), similar to that reported previously (Ibáñez-Sandoval et al., 2011). These connectivity data show that, compared with the other striatal GABAergic interneurons, the SABIs are essentially isolated from SPNs, suggesting that they may innervate other striatal interneurons selectively.
Optogenetic inhibition of the SABIs interneurons evokes IPSC barrages in SPNs
We studied the effect of the optogenetic inhibition of SABIs on the SPNs by injecting a AAV5 Ef1a DIO HR3.0-EYFP Cre-dependent halorhodopsin into the striatum of Htr3a-Cre mice and performing whole-cell voltage-clamp recordings of SPNs using a cesium-based, high-chloride (125 mm CsCl−) internal solution (Fig. 9). Optogenetic inhibition of Htr3a-Cre targeted interneurons evokes large-amplitude IPSCs during and after the optical stimulus (Fig. 9b). The IPSCs occurring shortly after the end of the yellow light pulse are not specific to Htr3a-cre mice because they were also observed in PV-Cre and NPY-cre mice injected with the same cre-dependent halorhodopsin 3.0 virus. Those IPSCs were attributed to rebound spiking of normally silent striatal interneurons such as the PV+ FSIs, which exhibit frequently rebound firing after the end of the yellow light pulse both in cell-attached and whole-cell modes (n = 7, data not shown). Given the nonspecifity of these rebound responses observed in SPNs, they were not further analyzed. Conversely, the IPSC barrages occurring during the optogenetic inhibition of Htr3a-Cre-targeted interneurons after a relatively long onset latency were measured only in Htr3a-cre mice, not in PV-Cre, NPY-Cre, or TH-Cre mice (data not shown) in 27 of 38 recorded SPNs (71.05%; Fig. 9b,e). In the SPNs that did exhibit these IPSCs, they occurred on 34.87% of the trials (Fig. 9b,f). These disinhibitory currents were GABAA mediated because they were completely abolished by bicuculline (10 μm; Fig. 9g1,g2). The average charge transfer of the disinhibition currents was 10.007 ± 0.98 pC (Fig. 9h). Interestingly, the IPSCs always began after a rather long latency (average 221.08 ± 14.69 ms; Fig. 9i), implying the recruitment of polysynaptic pathways. We also show, both in cell-attached and in whole-cell recordings, that the yellow light pulse induce a complete silencing of the SABI and is often followed by a rebound burst (n = 8; Fig. 9c,d).
Figure 9.

Optogenetic inhibition of Htr3a interneurons evokes large barrages of GABAergic IPSCs in SPNs. a, Schematic of the experimental paradigm. AAV5 Ef1a DIO HR3.0-EYFP was injected into the striatum of Htr3a-Cre mice and SPNs were recorded ex vivo using a cesium-based high-chloride internal solution (125 mm CsCl−). b1, Representative examples of raw voltage-clamp data traces recordings in a SPN in the disinhibition protocol. Orange bar indicates the yellow light pulse. b2, Expanded view of the disinhibitory IPSCs occurring during and immediately after the yellow light pulse. c, d, Cell-attached (c) and current-clamp (d) recordings of a SABI during halorhodopsin stimulation (500 ms). Note that the yellow light pulse completely blocks action potential firing of the SABI (n = 8) both in the cell-attached and current-clamp mode. e, f, Pie charts showing the percentage of cells exhibiting IPSC barrages in response to optogenetic inhibition of Htr3a-Cre interneurons (disinhibition, orange; e) and the percentage of individual trials of yellow light application in which the IPSC barrages were observed (f). g1, g2, IPSCs are blocked by bath application of bicuculline (10 μm). Note the delayed onset of the IPSCs. h, Box plot representing the charge transfer measured during the yellow light pulse (500 ms). i, Box plot representing the onset latency of the IPSCs from the start of the yellow light pulse. j, Circuit diagram depicting the disinhibitory circuit hypothesized to mediate these responses. The Htr3a-Cre interneurons that are spontaneously active (i.e., the SABIs) are inhibited by halorhodopsin, which in turn disinhibits another, as yet unidentified population of interneuron(s) evoking these IPSC barrages in SPN.
We hypothesize that the IPSCs occurring during the optogenetic inhibition of the SABIs are the result of the disinhibition of another, separate population of GABAergic interneuron, not targeted in Htr3a-Cre mice, that exhibits spontaneous activity but is normally inhibited by the SABIs (Fig. 9j). This hypothesis is supported by several lines of evidence. First, SABIs are the only spontaneously active striatal interneurons in slices targeted in the Htr3a-Cre mice. Second, unlike the other interneurons targeted in striatal slices from Htr3a-Cre mice, the SABIs do not provide significant input to SPNs, suggesting that their preferential target is some other population of striatal neuron. Finally, disinhibitory IPSCs were never observed in similar experiments in striatal slices from TH-Cre, PV-Cre, or NPY-Cre mice (data not shown).
Discussion
Spontaneously active bursty interneuron is a novel striatal interneuron
Here, we provide evidence for the existence of a previously unknown, spontaneously active GABAergic interneuron in the neostriatum that is targeted in Htr3a-Cre mice. These neurons are usually spontaneously active in both cell-attached and whole-cell recordings. Initially, it was thought there was only a single population of tonically active neuron in the striatum (Kimura et al., 1984; Aosaki et al., 1995) termed TANS, subsequently identified as CINs. However, since then, LTS interneurons and THINs have been shown to be spontaneously active in the slice (Ibáñez-Sandoval et al., 2010, 2011; Beatty et al., 2012). Here, we show that there is a fourth striatal interneuron subtype that is spontaneously active in the slice, which exhibits a unique firing pattern in cell-attached recordings. In the present report, comparisons of the firing pattern among the four identified populations of spontaneously active interneurons confirm previous studies showing that LTS interneurons have spontaneous firing patterns that are virtually indistinguishable from those of CINs (Beatty et al., 2012; Elghaba et al., 2016). Further, we also show that most firing parameters that we investigated showed no significant differences between CINs and LTSs. Therefore some fraction of the TANS previously recorded in vivo (Aosaki et al., 1994; Apicella, 2017) may have been LTS interneurons rather than only CINs, as suggested previously (Ibáñez-Sandoval et al., 2010; Beatty et al., 2012). In contrast, THINs have a shorter duration action potential than CINs or LTS interneurons; THINS could have been be mistaken as putative striatal FSIs when recorded in vivo using extracellular recordings. Compared with these interneurons, we found that SABIs exhibit a highly bursty firing pattern consisting of long adapting bursts separated by relatively long periods of silence in cell-attached recordings, which may be similar to what one would see in vivo.
Previously, we described the existence of four subtypes of TH-expressing interneurons (Ibáñez-Sandoval et al., 2010). In whole-cell recordings, SABIs share many properties in common with type I THINs (comprising 60–80% of all THINs; Ibáñez-Sandoval et al., 2010, 2015; Unal et al., 2015), including spontaneous spiking, strong spike accommodation, high input resistance, and the presence of a plateau potential. However, immunofluorescence staining showed that these neurons do not express TH even after 6 OHDA lesioning, which transiently increased the number of immunostained THINs (Unal et al., 2015), and, conversely, that THINs are not targeted in Htr3a-Cre mice, suggesting that they are in fact a separate cell type (Faust et al., 2015). Additional electrophysiological analyses conducted in cell-attached and whole-cell mode revealed that quantitative differences between the SABI and THIN populations in terms of firing pattern, input resistance, the current necessary to induce depolarization block, and spike properties in whole-cell recordings, confirming that THINs and SABIs are two distinct cell types.
Consistent with the electrophysiological differences, there are also a number of anatomical differences between THINs and SABIs. Type I THINs have a slightly larger soma and simpler dendritic arbor with dendrites that branch less frequently and follow a straighter course (Unal et al., 2011) than the dendrites of SABIs. Similar to THINs, SABI dendrites are sparsely spiny, but more so than THINs. The axonal arborization of the type I THIN and the FSIs are much denser than that of SABIs, which exhibit small, localized clusters of varicose axons proximally and much sparser, elongated varicose axons that can extend far from the dendritic field. This anatomical arrangement is consistent with a very selective targeting of postsynaptic neurons. The question of the total number of SABIs in the striatum is still unanswered because, for now, this interneuron has been targeted only in Htr3a-cre mice and the number of transfected cells depends on virus injection, diffusion, and transfection. Furthermore, using typical interneuron markers (CR, NPY, PV, NOS, TH, or VIP), we have been unable to label SABIs and thus cannot determine their number precisely. However, based on our recordings, we suggest that the SABIs represent 12.33% of the total number of the targeted Htr3a-cre neurons.
It is worth noting that, in a recent study (Muñoz-Manchado et al., 2016) using a different transgenic line that also putatively targets striatal 5HT3a receptor-expressing neurons (5HT3aEGFP), the investigators also described several types of GABAergic interneurons. In addition to the FSI and NGF interneurons that are targeted in these mice, they described a heterogeneous population they termed “type III,” some of which exhibited characteristics of LTS interneurons, including spontaneous activity. Surprisingly, none of the labeled cell types reported exhibited the properties of the SABIs reported here. Like the apparent lack of FAIs that are also targeted in the Htr3a-Cre but not 5HT3aEGFP mice and the significantly different proportions of FSIs reported in the two lines (Faust et al., 2015; Muñoz-Manchado et al., 2016), all of these data indicate that the Htr3a-Cre mice and 5HT3aEGFP transgenic mouse lines target similar but not identical striatal cell populations, which suggests different relevance of those two lines for studying distinct interneuron subtypes and their implication in striatal circuitry.
Connectivity with SPNs
The most studied synaptic targets of striatal GABAergic interneurons are the SPNs. To date, all identified GABAergic interneurons for which outputs are known have been shown to contact SPNs (Tepper and Koós, 2017). Data from paired whole-cell recordings reveal variable and interneuron subtype-dependent connection probabilities and synaptic response amplitudes. Here, we confirm using paired recordings that the connection probability between FSIs and SPNs, along with NGF interneurons (∼75%, Ibáñez-Sandoval et al., 2011), are the highest among striatal interneurons. Data from a recent study reported that the FAI, another GABAergic interneuron targeted in Htr3a-Cre mice, also exhibit a significant, albeit lower connection rate with SPN (∼50%) (Faust et al., 2015) and the connection probability from THINs and LTS interneurons to SPNs, although significant, is even lower (∼17–20%), as reported previously (Ibáñez-Sandoval et al., 2010, 2011).
Compared with those findings, one of the most interesting results of the present study is the near absence of innervation of SPNs by the SABIs. These observations suggest that the principal synaptic targets of SABIs are restricted to other striatal interneurons, the relative scarcity of which would account for the sparse nature of the SABI axonal arborizations. Consistent with this suggestion, we found that optogenetic inhibition of the Htr3a-Cre-targeted interneurons evoke IPSC barrages in SPNs. Because SABIs are the only spontaneously active interneurons targeted in Htr3a-Cre mice, it follows that it is inhibition of SABIs that elicits the IPSC barrages indirectly. We hypothesize that these inhibitory currents are the result of the disinhibition of another distinct interneuron, not targeted in the Htr3a-Cre mice, with spontaneous activity that is normally suppressed by the SABI interneurons.
The SABIs would be the first example of an interneuron specialized for synapsing onto other interneurons in striatum, which suggests the existence of a hierarchical control of other striatal interneurons. Recently, we showed that THINs innervate another population of striatal interneuron, the LTS interneuron (Assous et al., 2017), but we also showed that they provide inhibition onto SPNs (Ibáñez-Sandoval et al., 2010; Xenias et al., 2015), so they cannot be considered interneuron selective.
Cell-attached recordings and whole-cell recordings show that the SABIs are the only identified spontaneously active interneuron in the slice targeted in Htr3a-Cre mice. The disinhibitory barrages of IPSCs never occur in TH-Cre mice, PV-Cre mice (thus excluding the participation of FSIs), or NPY-Cre mice (excluding the NGF interneurons). Finally, as mentioned above, unlike the other interneurons targeted in the Htr3a-Cre mice, the SABIs do not make significant contact with SPNs. This suggests that the IPSC barrages seen during the optogenetic inhibition of Htr3a-Cre interneurons are due to the innervation and thus disinhibition of some other population(s) of interneurons. The interneuron responsible for the disinhibition of SPNs is still unidentified, but we can exclude the interneurons that are targeted in the Htr3a-cre mice, so the remaining known candidates are THINs or LTS interneurons.
Implications for striatal circuitry
Our results reveal further complexity in the organization of the interneuronal circuitry of the striatum. The existence of interneuron-specific interneurons has been shown in different brain areas such as hippocampus (Acsády et al., 1996a,b; Somogyi and Klausberger, 2005), and cortex (Lee et al., 2013; Pfeffer et al., 2013; Pi et al., 2013; Kepecs and Fishell, 2014). In those structures, activation of those interneuron-specific interneurons disinhibits principal cells in vivo, providing a form of gain control (Pi et al., 2013). Much experimental evidence shows that cortical interneuron-specific interneurons may play a major role in the state-dependent gating of information flow across cortical regions, primarily through dendritic disinhibition of principal neurons. By controlling dendritic electrogenesis and the firing mode of principal cells, interneuron-specific interneurons may determine the functional output of intracortical processing during specific brain states (Francavilla et al., 2015).
The striatum is significantly different from cortex and hippocampus in many ways. Arguably the most significant way is that the principal neurons in the latter two structures are glutamatergic, whereas the former comprises only GABAergic principal cells. The idea of single neurons forming ensembles that fire together and act as functional units due to some type of long-term plasticity has permeated our thinking of how engrams are encoded in the brain since the late 1940s (Hebb, 1949; Buzsáki and Chrobak, 1995; Buzsáki, 1997; Stefanelli et al., 2016).
Although there are many ways in which such stable ensembles could form and be maintained in principal neurons of the cortex and hippocampus that are interconnected by excitatory axon collaterals (Somogyi et al., 1998), it is much more difficult to imagine how similar ensembles are created and maintained in the striatum, in which all of the principal neurons are GABAergic and interconnected by inhibitory local axon collaterals (Koós et al., 2004). Nevertheless, such ensembles have been observed in SPNs both in vivo (Miller et al., 2008) and in vitro (Carrillo-Reid et al., 2008). Although ensembles can arise in models of sparse random collateral SPN connections, these do not in general exhibit high spike synchronization (Ponzi and Wickens, 2012). However, recent findings about the connectomics of striatal GABAergic interneurons, in particular the present evidence for the existence of an interneuron-specific interneuron and of a hierarchical organization of GABAergic interneurons that includes disinhibition among interneuronal networks (Tepper and Koós, 2017), suggests multiple mechanisms that could result in the assembly and maintenance of stable cell assemblies of striatal principal neurons.
Footnotes
This work was supported by Rutgers University (National Institutes of Health Grant NS034865 to J.M.T.). We thank Nupur Jain, and Arpan Garg for excellent technical assistance and Daniel Dautan for advice on data analysis.
The authors declare no competing financial interests.
References
- Acsády L, Görcs TJ, Freund TF (1996a) Different populations of vasoactive intestinal polypeptide-immunoreactive interneurons are specialized to control pyramidal cells or interneurons in the hippocampus. Neuroscience 73:317–334. 10.1016/0306-4522(95)00609-5 [DOI] [PubMed] [Google Scholar]
- Acsády L, Arabadzisz D, Freund TF (1996b) Correlated morphological and neurochemical features identify different subsets of vasoactive intestinal polypeptide-immunoreactive interneurons in rat hippocampus. Neuroscience 73:299–315. 10.1016/0306-4522(95)00610-9 [DOI] [PubMed] [Google Scholar]
- Aosaki T, Tsubokawa H, Ishida A, Watanabe K, Graybiel AM, Kimura M (1994) Responses of tonically active neurons in the primate's striatum undergo systematic changes during behavioral sensorimotor conditioning. J Neurosci 14:3969–3984. 10.1523/JNEUROSCI.14-06-03969.1994 [DOI] [PMC free article] [PubMed] [Google Scholar]
- Aosaki T, Kimura M, Graybiel AM (1995) Temporal and spatial characteristics of tonically active neurons of the primate's striatum. J Neurophysiol 73:1234–1252. 10.1152/jn.1995.73.3.1234 [DOI] [PubMed] [Google Scholar]
- Apicella P. (2017) The role of the intrinsic cholinergic system of the striatum: what have we learned from TAN recordings in behaving animals? Neuroscience 360:81–94. 10.1016/j.neuroscience.2017.07.060 [DOI] [PubMed] [Google Scholar]
- Assous M, Kaminer J, Shah F, Garg A, Koós T, Tepper JM (2017) Differential processing of thalamic information via distinct striatal interneuron circuits. Nat Commun 8:15860. 10.1038/ncomms15860 [DOI] [PMC free article] [PubMed] [Google Scholar]
- Bakkum DJ, Radivojevic M, Frey U, Franke F, Hierlemann A, Takahashi H (2013) Parameters for burst detection. Front Comput Neurosci 7:193. 10.3389/fncom.2013.00193 [DOI] [PMC free article] [PubMed] [Google Scholar]
- Beatty JA, Sullivan MA, Morikawa H, Wilson CJ (2012) Complex autonomous firing patterns of striatal low-threshold spike interneurons. J Neurophysiol 108:771–781. 10.1152/jn.00283.2012 [DOI] [PMC free article] [PubMed] [Google Scholar]
- Buzsáki G. (1997) Functions for interneuronal nets in the hippocampus. Can J Physiol Pharmacol 75:508–515. 10.1139/y97-088 [DOI] [PubMed] [Google Scholar]
- Buzsáki G, Chrobak JJ (1995) Temporal structure in spatially organized neuronal ensembles: a role for interneuronal networks. Curr Opin Neurobiol 5:504–510. 10.1016/0959-4388(95)80012-3 [DOI] [PubMed] [Google Scholar]
- Carrillo-Reid L, Tecuapetla F, Tapia D, Hernández-Cruz A, Galarraga E, Drucker-Colin R, Bargas J (2008) Encoding network states by striatal cell assemblies. J Neurophysiol 99:1435–1450. 10.1152/jn.01131.2007 [DOI] [PubMed] [Google Scholar]
- Elghaba R, Vautrelle N, Bracci E (2016) Mutual control of cholinergic and low-threshold spike interneurons in the striatum. Front Cell Neurosci 10:111. 10.3389/fncel.2016.00111 [DOI] [PMC free article] [PubMed] [Google Scholar]
- English DF, Ibáñez-Sandoval O, Stark E, Tecuapetla F, Buzsáki G, Deisseroth K, Tepper JM, Koós T (2011) GABAergic circuits mediate the reinforcement-related signals of striatal cholinergic interneurons. Nat Neurosci 15:123–130. 10.1038/nn.2984 [DOI] [PMC free article] [PubMed] [Google Scholar]
- Faust TW, Assous M, Shah F, Tepper JM, Koós T (2015) Novel fast adapting interneurons mediate cholinergic-induced fast GABAA inhibitory postsynaptic currents in striatal spiny neurons. Eur J Neurosci 42:1764–1774. 10.1111/ejn.12915 [DOI] [PMC free article] [PubMed] [Google Scholar]
- Francavilla R, Luo X, Magnin E, Tyan L, Topolnik L (2015) Coordination of dendritic inhibition through local disinhibitory circuits. Front Synaptic Neurosci 7:5. 10.3389/fnsyn.2015.00005 [DOI] [PMC free article] [PubMed] [Google Scholar]
- Gerfen CR, Surmeier DJ (2011) Modulation of striatal projection systems by dopamine. Annu Rev Neurosci 34:441–466. 10.1146/annurev-neuro-061010-113641 [DOI] [PMC free article] [PubMed] [Google Scholar]
- Graveland GA, DiFiglia M (1985) The frequency and distribution of medium-sized neurons with indented nuclei in the primate and rodent neostriatum. Brain Res 327:307–311. 10.1016/0006-8993(85)91524-0 [DOI] [PubMed] [Google Scholar]
- Hebb DO. (1949) Organization of behavior. New York: Wiley. [Google Scholar]
- Ibáñez-Sandoval O, Tecuapetla F, Unal B, Shah F, Koós T, Tepper JM (2010) Electrophysiological and morphological characteristics and synaptic connectivity of tyrosine hydroxylase-expressing neurons in adult mouse striatum. J Neurosci 30:6999–7016. 10.1523/JNEUROSCI.5996-09.2010 [DOI] [PMC free article] [PubMed] [Google Scholar]
- Ibáñez-Sandoval O, Tecuapetla F, Unal B, Shah F, Koós T, Tepper JM (2011) A novel functionally distinct subtype of striatal neuropeptide Y interneuron. J Neurosci 31:16757–16769. 10.1523/JNEUROSCI.2628-11.2011 [DOI] [PMC free article] [PubMed] [Google Scholar]
- Ibáñez-Sandoval O, Xenias HS, Tepper JM, Koós T (2015) Dopaminergic and cholinergic modulation of striatal tyrosine hydroxylase interneurons. Neuropharmacology 95:468–476. 10.1016/j.neuropharm.2015.03.036 [DOI] [PMC free article] [PubMed] [Google Scholar]
- Kaneoke Y, Vitek JL (1996) Burst and oscillation as disparate neuronal properties. J Neurosci Methods 68:211–223. 10.1016/0165-0270(96)00081-7 [DOI] [PubMed] [Google Scholar]
- Kawaguchi Y. (1993) Physiological, morphological, and histochemical characterization of three classes of interneurons in rat neostriatum. J Neurosci 13:4908–4923. 10.1523/JNEUROSCI.13-11-04908.1993 [DOI] [PMC free article] [PubMed] [Google Scholar]
- Kawaguchi Y, Wilson CJ, Augood SJ, Emson PC (1995) Striatal interneurones: chemical, physiological and morphological characterization. Trends Neurosci 18:527–535. 10.1016/0166-2236(95)98374-8 [DOI] [PubMed] [Google Scholar]
- Kepecs A, Fishell G (2014) Interneuron cell types are fit to function. Nature 505:318–326. 10.1038/nature12983 [DOI] [PMC free article] [PubMed] [Google Scholar]
- Kimura M, Rajkowski J, Evarts E (1984) Tonically discharging putamen neurons exhibit set-dependent responses. Proc Natl Acad Sci U S A 81:4998–5001. 10.1073/pnas.81.15.4998 [DOI] [PMC free article] [PubMed] [Google Scholar]
- Koós T, Tepper JM (1999) Inhibitory control of neostriatal projection neurons by GABAergic interneurons. Nat Neurosci 2:467–472. 10.1038/8138 [DOI] [PubMed] [Google Scholar]
- Koós T, Tepper JM, Wilson CJ (2004) Comparison of IPSCs evoked by spiny and fast-spiking neurons in the neostriatum. J Neurosci 24:7916–7922. 10.1523/JNEUROSCI.2163-04.2004 [DOI] [PMC free article] [PubMed] [Google Scholar]
- Lee S, Kruglikov I, Huang ZJ, Fishell G, Rudy B (2013) A disinhibitory circuit mediates motor integration in the somatosensory cortex. Nat Neurosci 16:1662–1670. 10.1038/nn.3544 [DOI] [PMC free article] [PubMed] [Google Scholar]
- Miller BR, Walker AG, Shah AS, Barton SJ, Rebec GV (2008) Dysregulated information processing by medium spiny neurons in striatum of freely behaving mouse models of Huntington's disease. J Neurophysiol 100:2205–2216. 10.1152/jn.90606.2008 [DOI] [PMC free article] [PubMed] [Google Scholar]
- Muñoz-Manchado AB, Foldi C, Szydlowski S, Sjulson L, Farries M, Wilson C, Silberberg G, Hjerling-Leffler J (2016) Novel striatal GABAergic interneuron populations labeled in the 5HT3a(EGFP) mouse. Cereb Cortex 26:96–105. 10.1093/cercor/bhu179 [DOI] [PMC free article] [PubMed] [Google Scholar]
- Pfeffer CK, Xue M, He M, Huang ZJ, Scanziani M (2013) Inhibition of inhibition in visual cortex: the logic of connections between molecularly distinct interneurons. Nat Neurosci 16:1068–1076. 10.1038/nn.3446 [DOI] [PMC free article] [PubMed] [Google Scholar]
- Pi HJ, Hangya B, Kvitsiani D, Sanders JI, Huang ZJ, Kepecs A (2013) Cortical interneurons that specialize in disinhibitory control. Nature 503:521–524. 10.1038/nature12676 [DOI] [PMC free article] [PubMed] [Google Scholar]
- Ponzi A, Wickens J (2012) Input dependent cell assembly dynamics in a model of the striatal medium spiny neuron network. Front Syst Neurosci 6:6. 10.3389/fnsys.2012.00006 [DOI] [PMC free article] [PubMed] [Google Scholar]
- Somogyi P, Klausberger T (2005) Defined types of cortical interneurone structure space and spike timing in the hippocampus. J Physiol 562:9–26. 10.1113/jphysiol.2004.078915 [DOI] [PMC free article] [PubMed] [Google Scholar]
- Somogyi P, Tamás G, Lujan R, Buhl EH (1998) Salient features of synaptic organisation in the cerebral cortex. Brain Res Brain Res Rev 26:113–135. 10.1016/S0165-0173(97)00061-1 [DOI] [PubMed] [Google Scholar]
- Stefanelli T, Bertollini C, Lüscher C, Muller D, Mendez P (2016) Hippocampal somatostatin interneurons control the size of neuronal memory ensembles. Neuron 89:1074–1085. 10.1016/j.neuron.2016.01.024 [DOI] [PubMed] [Google Scholar]
- Taverna S, Canciani B, Pennartz CM (2007) Membrane properties and synaptic connectivity of fast-spiking interneurons in rat ventral striatum. Brain Res 1152:49–56. 10.1016/j.brainres.2007.03.053 [DOI] [PubMed] [Google Scholar]
- Tepper JM, Bolam JP (2004) Functional diversity and specificity of neostriatal interneurons. Curr Opin Neurobiol 14:685–692. 10.1016/j.conb.2004.10.003 [DOI] [PubMed] [Google Scholar]
- Tepper JM, Koos T (2017) Striatal GABAergic interneurons. In: Handbook of Basal Ganglia Structure and Function, Ed 2 (Steiner H, Tseng KY, eds), pp. 157–178 Cambridge, MA: Academic Press. [Google Scholar]
- Tepper JM, Tecuapetla F, Koós T, Ibáñez-Sandoval O (2010) Heterogeneity and diversity of striatal GABAergic interneurons. Front Neuroanat 4:150. [DOI] [PMC free article] [PubMed] [Google Scholar]
- Unal B, Ibáñez-Sandoval O, Shah F, Abercrombie ED, Tepper JM (2011) Distribution of tyrosine hydroxylase-expressing interneurons with respect to anatomical organization of the neostriatum. Front Syst Neurosci 5:41. 10.3389/fnsys.2011.00041 [DOI] [PMC free article] [PubMed] [Google Scholar]
- Unal B, Shah F, Kothari J, Tepper JM (2015) Anatomical and electrophysiological changes in striatal TH interneurons after loss of the nigrostriatal dopaminergic pathway. Brain Struct Funct 220:331–349. 10.1007/s00429-013-0658-8 [DOI] [PMC free article] [PubMed] [Google Scholar]
- Wilson CJ. (1993) The generation of natural firing patterns in neostriatal neurons. Prog Brain Res 99:277–297. 10.1016/S0079-6123(08)61352-7 [DOI] [PubMed] [Google Scholar]
- Wilson CJ, Kawaguchi Y (1996) The origins of two-state spontaneous membrane potential fluctuations of neostriatal spiny neurons. J Neurosci 16:2397–2410. 10.1523/JNEUROSCI.16-07-02397.1996 [DOI] [PMC free article] [PubMed] [Google Scholar]
- Wu Y, Parent A (2000) Striatal interneurons expressing calretinin, parvalbumin or NADPH-diaphorase: a comparative study in the rat, monkey and human. Brain Res 863:182–191. 10.1016/S0006-8993(00)02135-1 [DOI] [PubMed] [Google Scholar]
- Xenias HS, Ibáñez-Sandoval O, Koós T, Tepper JM (2015) Are striatal tyrosine hydroxylase interneurons dopaminergic? J Neurosci 35:6584–6599. 10.1523/JNEUROSCI.0195-15.2015 [DOI] [PMC free article] [PubMed] [Google Scholar]