

Abstract
Esophageal squamous cell carcinoma (ESCC) is the eighth cause of cancer‐related deaths worldwide. To screen potential biomarkers associated with early recurrence/metastasis (R/M) of ESCC patients after radical resection, ESCC patients were analyzed by a comparative proteomics analysis using iTRAQ with RPLC‐MS to screen differential proteins among R/M groups and adjacent normal tissues. The proteins were identified by qRT‐PCR, Western blotting, and tissue microarray. The protein and mRNA expression difference of PHB2 between tumor tissues of ESCC patients and adjacent normal tissues, ESCC patients with and without metastasis, four ESCC cell lines and normal esophageal epithelial cells were inspected using immunohistochemical staining, qRT‐PCR, and Western blotting. The EC109 and TE1 cells were used to establish PHB2 knockdown cell models, and their cell proliferation and invasion ability were determined by cell counting method, Transwell® assay. Thirteen proteins were selected by cutoff value of 0.67 fold for underexpression and 1.5‐fold for overexpression. Seven proteins were confirmed to be associated with R/M among the 13 proteins. The potential biomarker PHB2 for early recurrence/metastasis of ESCC was identified. PHB2 expression was related to the OS of ESCC patients (P = 0.032) and had high levels in the tumor tissues and human cell lines of ESCC (P = 0.0002). Also, the high PHB2 expression promoted the metastasis of ESCC (P = 0.0075), suggesting high PHB2 expression was a potential prognostic biomarker. Experiments showed that PHB2 could significantly promote the proliferation and cell invasion ability of human ESCC cell lines and the knockdown of PHB2 suppressed the phosphorylation level of AKT, as well as the expression of MMP9 and RAC1. PHB2 could predict the early metastasis of ESCC patients.
Keywords: Esophageal squamous cell carcinoma, metastasis, proteomic, recurrence, tissue microarray
Introduction
Esophageal cancer is the eighth of most common cause of cancer‐related deaths worldwide 1 and ranks the third of incidence among all malignant tumors and the fourth of mortality cancer related in China 2. Although esophageal cancer exists in two principal forms—esophageal squamous cell carcinoma (ESCC) and esophageal adenocarcinoma (EAC), ESCC accounts for about 90% of esophageal cancer and is particularly prevalent in many developing countries, especially in Asia 3, 4. Surgery is the most promising therapeutic strategy for resectable ESCC; however, the 5‐year survival rate after surgery alone is approximately 25% 5. Postoperative recurrence and lymph node metastasis are the primary causes of treatment failure 6, 7. Therefore, screening of suitable prognostic indicator will probably be a key to monitor early recurrence/metastasis (R/M) of ESCC and discover potential treatment strategies that might reduce R/M and prolong lifetime.
Advances in proteomics technologies have enabled us to identify ectopic protein expressions and further explore the potential biomarkers and therapeutic targets for cancers. Recently, a multiplexed quantitative proteomic labeling strategy, namely Isobaric tags for relative and absolute quantification iTRAQ method, has been widely applied to global analysis in diverse cancers including breast cancer, lung cancer, and endometrial carcinoma for discovering biomarkers 8, 9, 10. The iTRAQ method is a highly sensitive proteomic platform, which is characterized by high proteome coverage and labeling efficiency, and has no side effects on analytical or biochemical properties of the labeled proteins or peptides 11, 12. However, the iTRAQ technique is proved to be more suitable for initial biomarkers discovery, and the results would require validation through a large‐scale screening 13, 14. In our study, we presented details of proteome variation in the different ESCC tumor tissues based on an iTRAQ with reversed‐phase liquid chromatography–mass spectrometry (RPLC‐MS) approach, and further validated the observations by tissue microarray (TMA) based on large samples immunohistochemistry.
To identify biomarkers for early R/M of ESCC patients after radical resection, we conducted comprehensive iTRAQ with RPLC‐MS, qRT‐PCR, Western blot analysis, and TMA analysis, comparing tumor tissues from patients with R/M after radical resection to tumor tissues from patients without R/M in 2 years after radical resection and their adjacent normal tissue samples. We obtained a protein biomarker, prohibitin2 (PHB2), which demonstrated a great promise in early metastasis of ESCC and proved to be a significant predictor for overall survival (OS). Lastly, we also performed cell and molecular biology experiments to verify whether PHB2 could affect the biology functions of human ESCC cell lines and the development of ESCC tumor tissues, and the final results told us that PHB2 could be a new target for the diagnosis and treatment of ESCC in clinic.
Materials and Methods
Cell culture
Human ESCC cell lines EC109, EC9706, EC18, and TE1 were obtained from the American Type Culture Collection (ATCC), and cultured in a cell incubator at 37°C with 5% CO2 and RPMI‐1640 medium supplemented with 10% fetal bovine serum (FBS) and 1% penicillin/streptomycin (P/S). Cells in the logarithmic growth phase were used in subsequent experiments.
Cell transfection
Three siRNA sequences targeted at PHB2 were designed by RNAi designer, sequence as follows: shRNA1: 3′‐TGGTGAATATCTCCCTGCGAGTGTT‐5′; shRNA 2: 3′‐CAGAGCTGAGCTTTAGCCGAGAGTA‐5′; shRNA 3: 3′‐CAGCGGGCCCAATTCTTGGTAGAAA‐5′. The siRNA sequences were inserted into PLVX vector to generate PLVX‐siRNA‐PHB2. A mixture of PLVX‐si‐RNA‐PHB2, psPAX2, and pMDG2 were cotransfected into 293T cells using lipofectamin 2000 reagent (Thermo Fisher Scientific, Inc., Waltham, MA) to produce lentivirus. Lastly, EC109 and TE1 cells were infected with the recombinant lentivirus‐transducing units and 8 μg/mL polybrene (Sigma, St. Louis, MO).
Patients and clinical samples collection
ESCC patients who had undergone surgery from Jan 2001 to Dec 2009 were evaluated, and 229 patients with three‐field lymphadenectomy were enrolled in this study. The study was approved by the Ethics Committee of Fudan University Shanghai Cancer Center and Shanghai Chest Hospital, Shanghai Jiao Tong University. The written consents were received from all participants in this study. Eligibility criteria for this study were as follows: (1) pathologically confirmed primary ESCC without neoadjuvant or adjuvant radiotherapy; (2) no distant metastasis at first visit; (3) underwent a complete surgical resection (R0); (4) a total of ≥15 removed lymph nodes (LNs); (5) no sever preoperative complications; (6) no surgical contraindication; and (7) adequate clinical information and follow‐up data. Clinical data, including tumor differentiation and T/N stage, were available for all patients. The pathologic stage of each cancer at the time of operation was identified according to the TNM system 15, and the lesion was graded histologically according to the World Health Organization classification 16.
The tumor tissues and their normal tissues were procured from patients who had been given the written informed consent. Tissues were snap‐frozen after resection and stored in liquid nitrogen with the archives. The tumor tissues of patients were divided into three groups according to the follow‐up information within 2 years after radical resection: the tumor tissues from patients without R/M (Group A); the tumor tissues from patients with recurrence (Group B); and the tumor tissues from patients with metastasis (Group C). The adjacent normal esophageal tissues from patients without R/M were assigned to Group D.
The patients were followed up every 3 months after surgery for 2 years, and every 6 months thereafter. During follow‐up, regular evaluations included medical history, physical examination, complete blood count, thoracic CT and abdominal ultrasound or CT. Other tests, such as PET‐CT, were performed as clinically indicated. Contrast‐enhanced brain MRI was performed if patients had suspicious symptoms or disease progress. Disease progression was determined by the treating physician based on available information, including clinical assessments, radiologic examination and pathology reports.
Protein extraction
Tissue samples were sectioned and thawed on ice. The tissues were washed thrice in ice‐cold phosphate buffer (PBS), ground in liquid nitrogen and extracted with lysis buffer which containing 7 mol/L urea, 2 mol/L thiourea, 65 mmol/L dithiothreitol, 0.1 mmol/L phenylmethylsulfonyl fluoride. The tissue homogenates were centrifuged with a speed of 14,000 rpm at 4°C for 30 min. The supernatant was transferred to a fresh 1.5 mL tube and the protein concentration was quantified using the Bradford Protein Assay (Bio‐Rad Laboratories, Inc., Hercules, CA).
iTRAQ labeling and SCX peptide fractionation
The procedures of iTRAQ Labeling were conducted according to the manufacturer's instruction (Applied Biosystems, Foster City, California, CA). Equal amounts of proteins (100 μg) of each group (A–D) were precipitated with acetone at −20°C for 1 h, resuspended in 20 μL dissolution buffer, and then denatured at 60°C for 1 h. Afterward, the proteins were digested with trypsin at 37°C for 16 h. After trypsin digestion, peptides were dried by vacuum centrifugation and labeled with the iTRAQ regents (Applied Biosystem iTRAQ Reagents, ABI) at room temperature for 1 h. Labeling the reference sample was randomized for each set to eliminate any potential bias that might be associated with a particular iTRAQ report tag. Then, the samples were mixed with equal amounts, and desalted with the Sep‐Pak Vac C18 cartridges and dried using a vacuum centrifuge.
Strong cation exchange (SCX) chromatography was performed using a polysulfoethyl column (2.1 mm × 100 mm, 5 μm, 200 Å, The Nest Group Inc, Southborough, MA) to fractionate the mixed peptides. Firstly, the mixed peptides were desalted with Sep‐Pak Cartridge (Waters, Milford, MA) and then diluted in the loading buffer (buffer A, 10 mmol/L KH2PO4 in 25% acetonitrile, pH 2.8). Subsequently, the mixture was loaded with a flow rate of 200 μL/min for 1 h using a linear binary gradient of 0–80% buffer B (10 mmol/L KH2PO4 in 25% ACN, 350 mmol/L KCl, pH 2.6) in buffer A (10 mmol/L KH2PO4 in 25% acetonitrile, pH 2.8). Eventually, a total of 20 SCX fractions were collected per iTRAQ set and the absorbance at 214 and 280 nm was monitored.
RPLC‐MS/MS analysis
The mixed peptides, which desalted with a PepMap C18 cartridge, were further separated by LC‐20AD nano‐HPLC (Shimadzu, Kyoto, Japan) on the secondary RP analytical column (ZORBAX 300SB‐C18 column, 150 mm × 100 μm 5 μm, 300 Å, USA). Peptides were subsequently eluted using the gradient conditions with phase B at a flow rate of 300 μL/min (5% phase B for 5 min, 35% phase B for 90 min, 80% phase B for 95 min, 80% phase B for 100 min, 5% phase B for 105 min, and 0 phase B for 120 min). Phase B was composed of 95% ACN and 0.1% formic acid.
Electrospray voltage of 2.2 kV versus the inlet of the mass spectrometer was used. A hybrid quadrupole time‐of‐flight mass spectrometer (QStar hybrid LC/MS/MS Q‐TOF, AB SCIEX, USA) was operated in data‐dependent mode to switch automatically between MS and MS/MS acquisition. MS spectra were acquired across the mass range of 400–1800 m/z in high‐resolution mode using 250 msec accumulation time per spectrum. Tandem mass spectral scanned from 100–2000 m/z in high sensitivity mode with collision‐induced dissociation (CID). The four most intense ions were chosen for fragmentation per cycle with dynamic exclusion.
The LC‐MS/MS data to identify proteins were searched against the Universal Protein Resource (UniProt). Protein identification and iTRAQ quantitation were performed with Protein Pilot software (Version 3.0, AB SCIEX, Framingham, MA) with the integrated ParagonTM search algorithm. The search parameters included iTRAQ labeling at N‐terminus and lysine residues, cysteine modification by methyl methanethiosulfonate (MMTS), and digestion by trypsin. For iTRAQ quantitation, the peptide was grouped by the ProGroup algorithm in the software to calculate the reporter peak area, error factor (EF), and P value. In our study, the cutoff value >1.3 was applied to identify protein; the protein must be identified by a minimum of two peptides with ≥95% confidence for quantification. The results were then exported into Microsoft Excel for manual data interpretation. Proteins were considered as differentially expressed if iTRAQ ratios were ≥1.5 or ≤0.67 in ≥50% in ESCC (group A, B, C) to adjacent normal tissues (group D). In addition, proteins must show consistent changes in both replicate samples, and have iTRAQ ratios’ P values <0.05 in at least one of the data set to be considered as differentially expressed. The proteins were considered to be differentially expressed in a comparison in ESCC with different status of R/M (group A, B, C) also using a cutoff value of iTRAQ ratios ≥1.5 or ≤0.67.
Tissue microarray
The tumor regions were reviewed and determined by a pathologist. Tissue microarray (TMA) blocks containing duplicate 1.0‐mm cores from each specimen were constructed with a manual tissue microarrayer (Beecher Instruments, Sun Prairie, WI). The TMAs contained 229 cases of primary ESCC and matched normal esophagus tissues. In addition, each block contained two marker cores for TMA orientation.
TMA sections were cut 5 μm thicknesses from the tissue blocks and placed on charged slides. Slides were deparaffinized in xylene, dehydrated in gradient ethanol, and pretreated in a microwave oven for 20 min at 800 W in 1 L citrate buffer (0.01 mol/L, pH 6.0) for antigen retrieval. Sections were then incubated with hydrogen peroxide (0.3% v/v) in PBS for 15 min to quench the endogenous peroxidase activity, followed by blocking with 10% fetal bovine serum in PBS to preclude nonspecific binding. Thereafter, the tissue slides were incubated with primary antibodies (1:500 dilution) overnight at 4°C. Protein expression was detected using the streptavidin–biotin complex with the Dako LSAB_ kit (DakoCytomation, Glostrup, Denmark) and diaminobenzidine as the chromogen. All procedures were carried out at room temperature unless otherwise specified. The tissue slides were washed with 0.025% Triton X 100 in PBS (0.1 mol/L, pH = 7.3) three times after each step. Finally, sections were counterstained with Mayer's hematoxylin and mounted with DPX mountant. In the negative control tissue sections, the primary antibody was replaced by isotype‐specific nonimmune mouse/rabbit IgG.
Immunoexpression of each protein was evaluated by a pathologist. Quantification in tumor sections was classified into four categories: (A) moderate to strong membrane, cytoplasmic, and nuclear staining in greater than 50% of tumor cells (4+); (B) moderate to strong cytoplasmic staining in ≥50% of either the cytoplasm or the nuclei, but not both (3+); (C) moderate cytoplasmic staining in ≥25% and ≤50% of either the cytoplasm or the nuclei, but not both (2+); (D) overall weak staining in the cytoplasm and/or nuclei (1+); and (E) no staining (0).
Western blotting
The tissue samples from frozen sections and the EC109 and TE1 cells treated as required were further taking for Western blotting. The tissue samples and cells were lysed in extraction buffer completely, centrifuged, then the supernatant was collected and the protein concentration was determined according to BCA protocol. Dysregulated proteins in ESCC samples were screened by Western blotting. Equal amount of proteins (30 μg) from each patient were separated by SDS‐PAGE and transferred to PVDF membranes. The membranes were incubated with primary antibodies, including S100A9, CRNN, PRDX1, CD99, FMNL, NCL, CLIC3, SPRR3, TXLNA, TGM2, FLNA, PHB2, FABP5, MMP9, p‐AKT, AKT, RAC1 and GADPH (all from Abcam, Cambridge, MA) overnight at 4°C, then with HRP‐conjugated secondary antibodies (1:10,000 dilution) at room temperature for 2 h. Protein expression was visualized via enhanced chemoluminescence reagent (Millipore) for 5 min, and then exposed to X‐ray film. All of the above‐mentioned experiments were independently repeated three times at least.
Quantitative RT‐PCR
Trizol homogenization buffer (Takara Inc., Mountain View, CA) was added into the tissue samples from frozen sections to extract the total RNAs, which were then reversely transcribed into cDNAs according to the manufacture's protocol from Takara. The obtained cDNAs were amplified by qRT‐PCR for S100A9, CRNN, PRDX1, CD99, FMNL, NCL, CLIC3, SPRR3, TXLNA, TGM2, FLNA, PHB2, FABP5, and GADPH (Table 1) in a total reaction system of 20 μL(including 1 μL cDNA template, 0.5 μL each primer, 10 μL SYBR green super mix and 8 μL ddH2O). The reaction conditions were as follows: 95°C, 3 min, 1 cycle; followed by 40 cycles of 95°C 5 sec, 62°C 30 sec and 72°C, 20 sec; final cycle 72°C, 30 sec. The relative gene expression was calculated by the Livak method (2−ΔΔCt) with GAPDH mRNA for normalization. The experiments were repeated three times independently at least.
Table 1.
Primer sequences used for RT‐qPCR
| Name | Forward sequence (5′‐3′) | Reverse sequence (5′‐3′) |
|---|---|---|
| S100A9 | ACAGAGTGCAAGACGATGAC | TTCACAGAGTATTGGTGGAAGG |
| CRNN | ACAGTGGTTGGTGAGGAATG | TGCTGAGGAAACACTGGTATG |
| PRDX1 | GCTTCTGTGGATTCTCACTTCT | GGGTCTGATACCAAAGGAATGT |
| CD99 | GATGCCCTTCCTGACAATGA | CCATCAACAACAGCATCTCCTA |
| FMNL | AGGAGCGGTTTCAAGTCAAG | TCCAATCAGCTGCTACCTTTC |
| NCL | ATTGGTAGCAACTCCTGGTAAG | CACTGTCATCATCCTCCTCTTC |
| CLIC3 | TCAAGGGCGTACCTTTCAC | GCTGTCATAGAGCAGGATGG |
| SPRR3 | CCAGCAGAAGCAGACCTTTAC | TCCTTGGTTGTGGGAACAAATA |
| TXLNA | GCGAGGAGCATATCGACAAA | CTTCTGCCTCCTTTAGCATCTC |
| TGM2 | ATCACCCACACCTACAAATACC | ATCCCTGTCTCCTCCTTCTC |
| FLNA | CTTCGAGGTGTACGTGGATAAG | TGGTCTTGTTGGCGATGTT |
| PHB2 | CCAAAGACCTACAGATGGTGAA | CAACACTCGTTCCTCGTAGTC |
| FABP5 | GGCCAAGCCAGATTGTATCA | TCTCTCCCAGGGTACAAGAAA |
| GADPH | GGTGTGAACCATGAGAAGTATGA | GAGTCCTTCCACGATACCAAAG |
Immunohistochemical staining
The tumor tissues and adjacent normal tissues were acquired as described above and then they were fixed using 4% paraformaldehyde (PFA) for 48 h. After that, these fixed tissues were cut into 5 μm slices and placed on the glass slides. Subsequently, these slides were used to immunohistochemical staining. Lastly, these slides were observed under a microscope and three random fields were photographed.
Cell proliferation assay
The cell counting method was performed to inspect the cell proliferation ability. The EC109 and TE1 cells transfected with the siRNA‐PHB2 or siRNA‐Control were cultured in a cell incubator at 37°C with 5% CO2 and RPMI‐1640 medium supplemented with 10% fetal bovine serum (FBS) and 1% penicillin/streptomycin (P/S) and then they were seeded into the 10 cm dishes in a density of 2000 cells per dish. Next, these dishes were further cultured in a cell incubator at 37°C with 5% CO2 for 3 days and every day, the cells in one dish for each cell line were trypsinized and collected to perform cell counting. Lastly, the results of cell counting for everyday were recorded and analyzed statistically.
Transwell® assay
The cell invasion ability of EC109 and TE1 cells transfected with the siRNA‐PHB2 or siRNA‐Control was detected by Transwell® assay. Cell invasion assay was performed using the Transwell® system (24 wells, 8 μm pore size with polycarbonate membrane; Corning Costar, Lowell, MA). The EC109 and TE1 cells transfected with the siRNA‐PHB2 or siRNA‐Control were cultured in a cell incubator at 37°C with 5% CO2 and RPMI‐1640 medium supplemented with 10% fetal bovine serum (FBS) and 1% penicillin/streptomycin (P/S), and then harvested and suspended, respectively, in medium without FBS. Then, the cells were added to the upper wells of the chamber by a density of 1 × 10⁵ cells. After incubated in a cell incubator with 5% CO2 at 37°C for 24 h, the cells adhering to the lower surface were fixed with methanol and stained with 0.1% crystal violet. Five representative fields of each insert were randomly counted under a microscope (Olympus, Japan) and analyzed statistically.
Statistical analyses
All data analyses were conducted with SPSS 16.0 software package (SPSS Inc., Chicago, IL). Kaplan–Meier curves were constructed to evaluate group survivals, and log‐rank test was applied to analyze the statistical significance of differences. Comparisons of over two groups utilized analysis of variance (ANOVA) with post hoc testing for further paired analysis. Wilcoxon rank sum test was used for nonparametric comparisons of TMA data. The Fisher's exact tests were used to compare categorical data. Average protein expression was calculated based on two independent WB analyses. Group B and Group C samples were compared with Group A by the Mann–Whitney two‐tailed test. Other statistical analysis was performed with two‐tailed unpaired t‐tests. *P < 0.05, **P < 0.01.
Results
Patients and protocol
Detailed research steps are showed in Figure 1. Firstly, 25 samples from ESCC patients with three‐field lymphadenectomy were enrolled in detection of 456 biomarkers associated with early R/M of ESCC patients after radical resection and were identified by applying the iTRAQ based on quantitative proteomic approach (iTRAQ‐RPLC‐MS/MS). Among them, seven tumor tissue samples from patients without R/M in 2 years after radical resection, eight tumor tissue samples from patients with recurrence after radical resection, four tumor tissue samples patients with metastasis after radical resection, and six adjacent normal tissue samples from patients without R/M were harvested, respectively. Secondly, the different proteins were identified by qRT‐PCR and Western blotting using another 22 samples, including six tumor tissue samples from patients without R/M in 2 years after radical resection, seven tumor tissue samples from patients with recurrence after radical resection, four tumor tissue samples from patients with metastasis after radical resection, and five adjacent normal tissue samples from patients without R/M. These candidate proteins were further verified by TMA in another cohort consisted of 229 ESCC patients. Finally, the prognostic significance of target protein was validated by OS of 229 ESCC patients.
Figure 1.
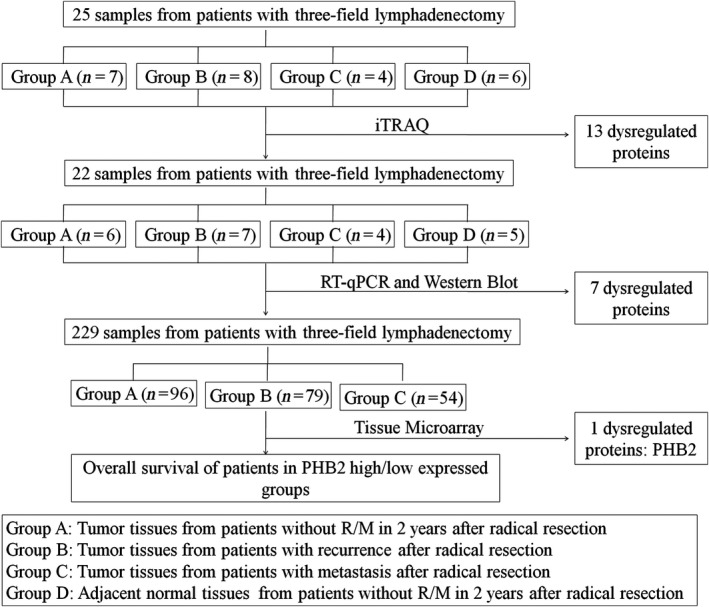
Study protocol.
The potential biomarker PHB2 for early recurrence/metastasis of ESCC was identified
After applying a fold‐change <0.67 for down‐regulated expression and a fold‐change >1.5 for up‐regulated expression, we found four down‐regulated and two up‐regulated proteins in patients with recurrence after radical resection and another four down‐regulated and three up‐regulated proteins in patients with metastasis after radical resection, compared to the control groups (Table 2).
Table 2.
List of 13 abnormally expressed proteins screened from proteomics
| Expression pattern | Accession number | Protein | Gene symbol |
|---|---|---|---|
| Down‐regulated in tumor tissues from patients with recurrence | sp|P06702|S10A9_HUMAN | Protein S100‐A9 | S100A9 |
| sp|Q9UBG3|CRNN_HUMAN | Cornulin | CRNN | |
| sp|Q06830|PRDX1_HUMAN | Peroxiredoxin‐1 | PRDX1 | |
| sp|P14209|CD99_HUMAN | CD99 antigen | CD99 | |
| Up‐regulated in tumor tissues from patients with recurrence | sp|O95466|FMNL_HUMAN | Formin‐like protein 1 | FMNL |
| sp|P19338|NUCL_HUMAN | Nucleolin | NCL | |
| Down‐regulated in tumor tissues from patients with metastasis | sp|O95833|CLIC3_HUMAN | Chloride intracellular channel protein 3 | CLIC3 |
| sp|Q9UBC9|SPRR3_HUMAN | Small proline‐rich protein 3 | SPRR3 | |
| sp|P40222|TXLNA_HUMAN | Alpha‐taxilin | TXLNA | |
| sp|P21980|TGM2_HUMAN | Protein‐glutamine gamma‐glutamyltransferase 2 | TGM2 | |
| Up‐regulated in tumor tissues from patients with metastasis | sp|P21333|FLNA_HUMAN | Filamin‐A | FLNA |
| sp|Q99623|PHB2_HUMAN | Prohibitin‐2 | PHB2 | |
| sp|Q01469|FABP5_HUMAN | Fatty acid‐binding protein | FABP5 |
To further elucidate the potential value of aberrantly expressed genes as biomarkers, we measured the mRNA and protein levels of the target 13 genes in another 17 tumor samples, including six tumor samples from patients without R/M in 2 years after radical resection, seven tumor samples from patients with recurrence after radical resection, four tumor samples from patients with metastasis after radical resection, and five adjacent normal tissue samples from patients without R/M. Consistent with proteomics, elevated expression of FMNL and NCL proteins and decreased expression of PRDX1 were identified in Group B compared to Group A. In addition, enhanced expression of FLNA, PHB2, and FABP5 was observed in Group C compared to Group A. In contrast with proteomics, we found that the expression of CLIC3 proteins were up‐regulated in tumor samples from patients with metastasis, while the transcripts were down‐regulated in metastasis (Fig. 2A and B).
Figure 2.
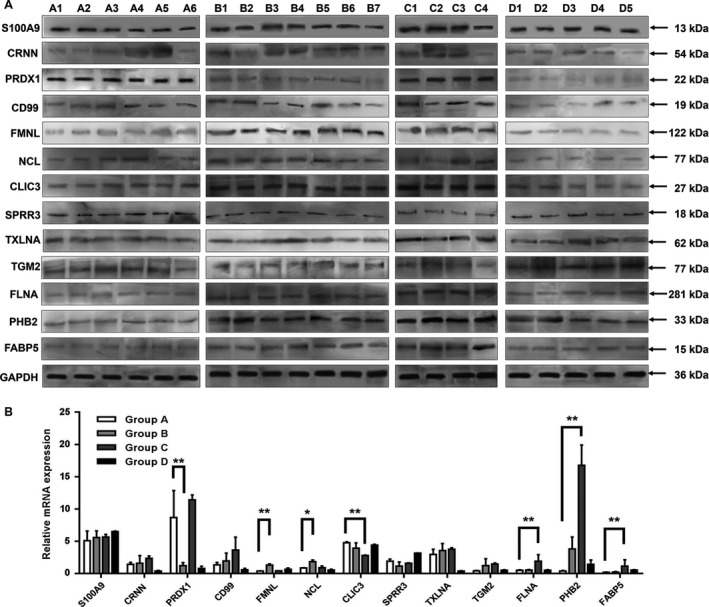
Dysregulated proteins were screened by Western blotting and qRT‐PCR. (A) Differential proteins expression in 22 clinical ESCC samples was detected by Western blotting. (B) Differential mRNA expression in 22 clinical ESCC samples was detected by qRT‐PCR. Group A: tumor tissues from patients without R/M in 2 years after radical resection; Group B: tumor tissues from patients with recurrence after radical resection; Group C: tumor tissues from patients with metastasis after radical resection; Group D: adjacent normal tissues from patients without R/M in 2 years after radical resection. Statistical analysis was performed with two‐tailed unpaired t‐tests. *P < 0.05, **P < 0.01.
We subsequently investigated expression of PRDX1, FMNL, NCL, CLIC3, FLNA, PHB2, and FABP5 of 229 ESCC tumor tissues by TMA. The expression levels of target protein in tumor tissues of the study cohort were scored from 0 to 4. Results showed PHB2 and CLIC3 expression were significantly up‐regulated in patients with metastasis compared with patients without R/M (P = 0.002 and 0.017, respectively, Table 3). Among which, PHB2 showed the consistent trend with proteomics and Western blotting, while the TMA expression of CLIC3 was consistent with the Western blotting, but contrary to proteomics results as shown in Figure 2.
Table 3.
Results of tissue microarray in 229 patients
| Group | Immunoexpressional level | PRDX1 | FMNL | NCL | CLIC3 | FLNA | PHB2 | FABP5 |
|---|---|---|---|---|---|---|---|---|
| A | 0 | 2 | 18 | 4 | 84 | 4 | 8 | 9 |
| 1 | 8 | 27 | 26 | 9 | 12 | 29 | 19 | |
| 2 | 48 | 40 | 55 | 1 | 23 | 44 | 38 | |
| 3 | 39 | 15 | 16 | 0 | 53 | 25 | 26 | |
| 4 | 6 | 0 | 0 | 0 | 4 | 1 | 2 | |
| B | 0 | 1 | 17 | 7 | 72 | 4 | 5 | 5 |
| 1 | 7 | 21 | 20 | 6 | 5 | 23 | 14 | |
| 2 | 32 | 27 | 36 | 0 | 14 | 27 | 32 | |
| 3 | 36 | 12 | 12 | 0 | 44 | 25 | 14 | |
| 4 | 2 | 0 | 1 | 0 | 2 | 1 | 6 | |
| C | 0 | 1 | 10 | 2 | 43 | 1 | 0 | 1 |
| 1 | 5 | 13 | 14 | 8 | 8 | 1 | 10 | |
| 2 | 13 | 19 | 23 | 6 | 13 | 26 | 17 | |
| 3 | 26 | 10 | 12 | 0 | 15 | 14 | 19 | |
| 4 | 3 | 0 | 1 | 0 | 1 | 0 | 1 | |
| P value | A vs. B | 0.747 | 0.599 | 0.526 | 0.500 | 0.455 | 0.494 | 0.698 |
| A vs. C | 0.172 | 0.810 | 0.516 | 0.017* | 0.099 | 0.002** | 0.139 |
Note: Group A: Tumor tissues from patients without R/M in 2 years after radical resection; Group B: Tumor tissues from patients with recurrence after radical resection; Group C: Tumor tissues from patients with metastasis after radical resection. Statistical analysis was performed with Wilcoxon rank sum test. *P < 0.05, **P < 0.01.
PHB2 expression was related to the OS of ESCC patients
We classified the protein expression levels on the tissue array from weak (scored as 0~2) to strong positive (scored as 3~4). Of the 229 ESCC patients examined, PHB2 was strongly stained (scored as 3~4) in 66 cases, weakly stained (scored as 0~2) in 163 cases. Clinicopathologic characteristics of the study cohort consisted of 229 ESCC patients were summarized and compared in PHB2 strong or weak expressed groups (Table 4). The expression of PHB2 was not correlated with other clinical factors such as age, gender, tumor differentiation, T/N status and postoperative chemotherapy. However, the median survival time of high PHB2 expression group was 31.7 months, whereas the median survival time of low PHB2 expression group was 48.7 months. Although there was no statistical difference in DMFS between PHB2 high expressed and PHB2 low expressed ESCC tumor tissues (P = 0.248) (Fig. 3A), high levels of PHB2 expression were correlated with OS in univariate analysis (P = 0.032, Fig. 3B). suggesting low expression level of PHB2 could promote OS of ESCC patient.
Table 4.
Clinicopathologic characteristics of patients in the tissue microarray assay (n = 229)
| Characteristics | n | PHB2 | ||
|---|---|---|---|---|
| Strong | Weak | P, strong vs. weak | ||
| Age | ||||
| <60 | 134 | 34 | 100 | 0.224 |
| 60–70 | 84 | 27 | 57 | |
| >70 | 11 | 5 | 6 | |
| Gender | ||||
| Female | 38 | 9 | 29 | 0.339 |
| Male | 191 | 63 | 128 | |
| Tumor differentiation | ||||
| I | 23 | 8 | 15 | 0.408 |
| II | 150 | 39 | 111 | |
| III | 56 | 19 | 37 | |
| T status | ||||
| T1 | 12 | 4 | 8 | 0.895 |
| T2 | 85 | 22 | 63 | |
| T3 | 104 | 26 | 78 | |
| T4 | 28 | 8 | 20 | |
| N status | ||||
| N0 | 84 | 16 | 68 | 0.242 |
| N1 | 62 | 17 | 45 | |
| N2 | 55 | 18 | 37 | |
| N3 | 28 | 9 | 19 | |
| Postoperative chemotherapy | ||||
| Yes | 127 | 61 | 66 | 0.146 |
| No | 102 | 59 | 43 | |
Figure 3.
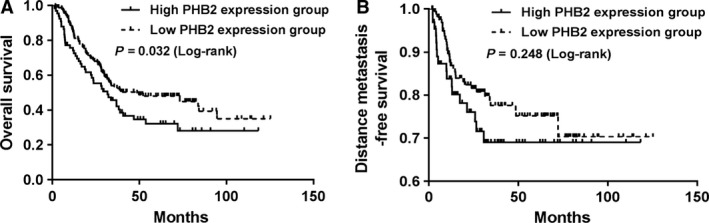
PHB2 expression was correlated with the OS of ESCC patients. (A and B) Kaplan–Meier curves of OS (A) and DMFS (B) in relation to PHB2 expression in ESCC patients with three‐field lymphadenectomy. Log‐rank P values are indicated within the graphs.
PHB2 had high expression levels in the tumor tissues and human cell lines of ESCC
To investigate the role of PHB2 in the ESCC, PHB2 levels were measured in the tumor tissues of ESCC patients and four human ESCC cell lines EC109, EC9706, EC18, and TE1. Immunohistochemistry staining showed PHB2 expression in the tumor tissues of ESCC patients was significantly higher than the adjacent normal tissues (Fig. 4A and B). We determined the PHB2 mRNA and protein levels in 90 pairs of ESCC tumor tissues and their adjacent normal tissues, and the results indicated that PHB2 expression was extremely significantly higher in the ESCC tumor tissues than the adjacent normal tissues (Fig. 4C). In addition, PHB2 mRNA and protein levels were determined in four human ESCC cell lines, and the results showed PHB2 had high expression in four human ESCC cells. Therefore, these results suggested that PHB2 had high expression levels in the tumor tissues of ESCC patients and four cell lines of ESCC.
Figure 4.
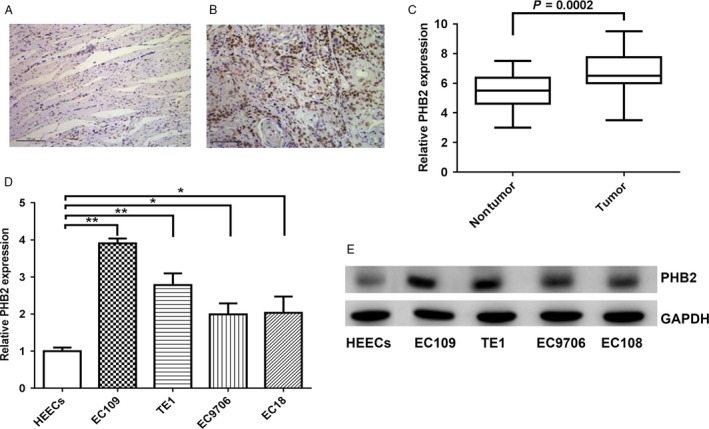
PHB2 had high expression levels in the tumor tissues and human cell lines of ESCC. (A and B) The PHB2 protein expression in the adjacent normal tissues (A) and tumor tissues (B) of ESCC was detected by immunohistochemical staining. (C) The PHB2 mRNA expression was compared between adjacent normal tissues and tumor tissues of 90 ESCC patients. (D and E) The PHB2 mRNA and protein expression in four human ESCC cell lines (EC109, TE1, EC9706, EC18) and a normal human esophageal epithelial cell line were determined by qRT‐PCR (D) and Western blotting (E). Statistical analysis was performed with two‐tailed unpaired t‐tests. *P < 0.05, **P < 0.01.
High PHB2 expression promoted the metastasis of ESCC
To further investigate whether the high PHB2 expression could affect the pathological development of ESCC, we compared PHB2 expression levels in the tumor tissues of ESCC patients with or without metastasis, as well as the metastasis rate between high PHB2 expression and low PHB2 expression of the ESCC patients. Results indicated that tumor tissues of ESCC patients with metastasis had higher PHB2 expression level than the nonmetastasis patients (Fig. 5A), and ESCC patients with high PHB2 expression had higher metastasis rate than ESCC patients with low PHB2 expression after surgery (Fig. 5B). Thus, high PHB2 expression could promote the metastasis of ESCC.
Figure 5.
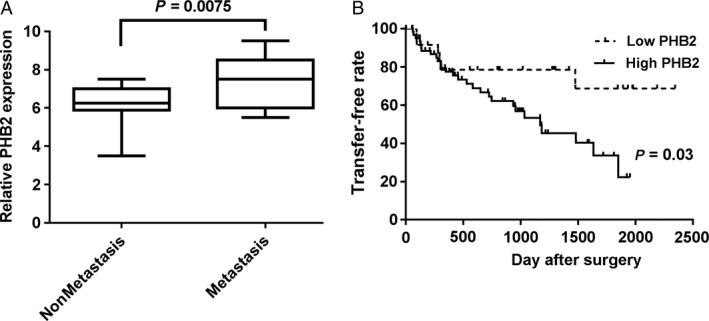
High expression of PHB2 promoted the metastasis of ESCC. The PHB2 mRNA expression was determined between metastasis and nonmetastasis in the ESCC patients. (B) The relative metastasis rate was counted among the ESCC patients with high or low PHB2 expression after surgery. Statistical analysis was performed with two‐tailed unpaired t‐tests.
PHB2 promoted the proliferation and invasive ability of human ESCC cells
In order to further explore the effect of PHB2 on the biological functions of ESCC cells, we transfected three PHB2‐siRNA to knockdown in two human ESCC cell lines (EC109 and TE). Results showed that siRNA2 acquired the highest knockdown rate in both EC109 and TE1 cells (Fig. 6A), and PHB2 mRNA expression level decreased in two cell lines by PHB2‐siRNA2 knockdown (Fig. 6B). Results showed that cells containing PHB2‐siRNA significantly presented lower proliferation ability than the control cells in two cell lines (Fig. 6C and D). In addition, we detected their cell invasive abilities by Transwell® invasion assays. PHB2 knockdown significantly suppressed cell invasion in two cells lines (Fig. 7A and B). And, we investigated the underlying metastasis mechanisms and found that knockdown of PHB2 obviously down‐regulated the expression levels of MMP9 and RAC1, and suppress the AKT in two cells lines (Fig. 7C), suggesting PHB2 affected metastasis via AKT signaling pathway. Take together, PHB2 could promote the proliferation of human ESCC cells, and their invasion ability through activating the AKT signaling pathway.
Figure 6.
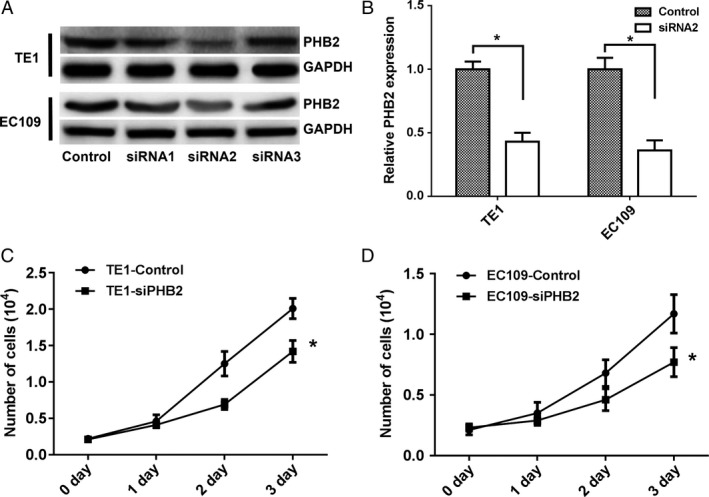
PHB2 promoted the proliferation ability of human ESCC cells. (A and B) The knockdown PHB2 expression in TE1 and EC109 cells was determined by Western blotting (A) and qRT‐PCR (B). (C and D) The proliferation ability of TE1 (C) and EC109 (D) cells transfected with siRNA‐PHB2 or siRNA‐Control were detected by cell counting method. Statistical analysis was performed with two‐tailed unpaired t‐tests. *P < 0.05.
Figure 7.
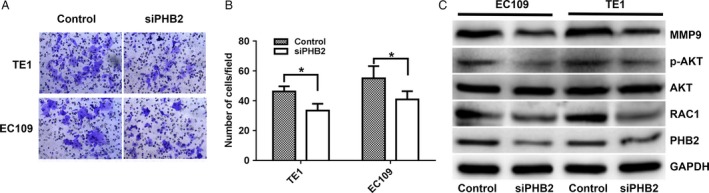
PHB2 promoted the invasion ability of human ESCC cells through activating the AKT signaling pathway. (A and B) The invasive ability was detected by the Transwell® invasion assay. The two cell lines were transfected with siRNA‐PHB2 or siRNA‐Control. (C) The protein expression of p‐AKT, AKT, MMP9, RAC1 and PHB2 in the EC109 and TE1 cells was detected by Western blotting. The two cell lines transfected with siRNA‐PHB2 or siRNA‐Control. Statistical analysis was performed with two‐tailed unpaired t‐tests. *P < 0.05.
Discussion
Despite the use of advanced surgical techniques combined with diverse adjuvant radiotherapy, chemotherapy or chemoradiotherapy, the overall 5‐year survival rate of ESCC patients is only about 40% 17, 18, 19. Thus, it is urgent to strengthen the research of discovering novel cancer diagnostic and therapeutic strategies. We performed a proteomic expression profile analysis of 25 ESCC patients after surgery resection using iTRAQ labeling technology combined with LC‐MS. After the analysis, we obtained 13 genes that could be potential candidates for the diagnosis of the early recurrence or metastasis of ESCC. With further study by qRT‐PCR, Western blotting, and TMAs, we identified PHB2 as the preferable candidate biomarker for early metastasis of ESCC, and provided evidences for its promise roles in predicting metastasis of ESCC, as well as verified that PHB2 could play an important role in regulating the biology functions of human ESCC cell lines and promoting the occurrence and development of ESCC. The integrated profiling method has been used successfully in studies on cancer outcome 20, 21, 22. However, present study using tissue‐based quantitative proteomics had identified few consistent prognostic markers for ESCC. This may be due partly to the heterogeneity of individual patients 23.
In recent years, it has attracted widespread interest that identifying important ESCC‐related biomarkers or therapeutic targets via the proteomic techniques. Du et al. 24 found that there were 22 dysregulated proteins in ESCCs compared to tumor‐adjacent normal tissues and that the up‐regulated expression of calreticulin and a 78 kDa glucose‐regulated protein were involved in poor prognosis through proteomic profiling. In a study by Cao et al. 25, Annexin II, kindlin 2, and myosin 9 were proved to be abnormally expressed in ESCC samples and could be significant predictors of ESCC OS. Additionally, transglutaminase 3 expression was validated in 76 primary tumor samples by IHC and found to be inversely correlated with shorter disease‐specific survival rate 26. In the other quantitative tissue proteomic studies, various proteins including α‐actinin 4, galectin 7, calreticulin, periostin, and the gene amplified in squamous cell carcinoma have been demonstrated to be potential biomarkers 27, 28, 29, 30, 31. According to previous reports, approximately 50% of the ESCC patients who had undergone surgery experienced postoperative recurrent or metastasis disease 32, 33. Uchikado et al. 34 showed that Slug expression in the E‐cadherin preserved tumors is related to prognosis in patients with ESCC and Slug in preserved E‐cadherin group is useful for predicting malignant properties of ESCC. Kitaichi et al. 35 suggested that loss of PAR‐3 protein expression may lead to tumor progression and subsequent lymph node metastasis in ESCC and was associated with adverse prognostic factors in ESCC. However, the biomarkers for predicting early recurrence or metastasis of ESCC patients remain to be poorly understood. In this study, we identified 13 dysregulated expression proteins by iTRAQ and then found seven candidate proteins in 13 dysregulated expression proteins by Western blotting and qPCR. The seven proteins located in cytoplasm or secreted to extracellular region, such as PRDX1, FMNL, NCL, CLIC3, FLNA, PHB2, FABP5, which could observe in the same conditions by TMAs. Eventually, protien PHB2 expression inquantitative proteomics approach, Western blotting, qRT‐PCR, and TMAs were consistant. Thus, we speculated PHB2 may be related to ESCC. PHB2, prohibitin proteins 2, is a evolutionarily conserved protein and a repressor of estrogen receptor (REA) activity or B‐cell receptor associate protein (BAP) 37, and can be found in bacteria, fungi, plants, and mammals 36. Previous studies have documented that PHB2 plays a vital role in repressing ER signaling 37, regulating cell apoptosis 38, and modulating cell cycle progression via the interaction with p53, E2F and pRb 39, 40. In addition, aberrant expression of PHB2 has been observed in multiple cancer cell lines and tumor tissues including breast cancer, rhabdomyosarcoma, thyroid cancer, neuroblastoma, and hepatocellular carcinoma 41, 42, 43, 44, 45. However, whether PHB2 is involved in ESCC remains to be explored. We found that PHB2 expression was related to the OS of ESCC patients and had high levels in the tumor tissues and human cell lines of ESCC. Also, the high PHB2 expression promoted the metastasis of ESCC, suggesting high PHB2 expression was a potential prognostic biomarker. Experiments showed that PHB2 could significantly promote the proliferation and cell invasive ability of human ESCC cell lines and the knockdown of PHB2 suppressed the phosphorylation level of AKT, MMP9, and RAC1, which also involved in the metastasis mechanisms of some cancer cells, which indicated that PHB2 may be associated with the postoperative metastasis of ESCC via AKT signal.
In summary, we identified and further investigated PHB2 might be considered as a potentially prognostic marker for predicting the early R/M of ESCC after radical resection and could promote proliferation and metastasis of human ESCC cells through activating AKT signaling pathway, which provides a theoretical basis for further mechanism research on ESCC R/M.
Conflict of Interests
These authors disclose no conflicts of interests.
Cancer Medicine 2018; 7(6):2504–2517
References
- 1. Siegel, R. L. , Miller K. D., and Jemal A.. 2016. Cancer statistics, 2016. CA Cancer J. Clin. 66:7–30. [DOI] [PubMed] [Google Scholar]
- 2. Chen, W. , Zheng R., Baade P. D., Zhang S., Zeng H., Bray F., et al. 2015. Cancer statistics in China, 2015. CA Cancer J. Clin. 66:115–132. [DOI] [PubMed] [Google Scholar]
- 3. Rustgi, A. K. , and El‐Serag H. B.. 2014. Esophageal carcinoma. N. Engl. J. Med. 371:2499–2509. [DOI] [PubMed] [Google Scholar]
- 4. Bevan, R. , Young C., Holmes P., Fortunato L., Slack R., Rushton L., et al. 2012. Occupational cancer in Britain. Br. J. Cancer 107:S33–S40. [DOI] [PMC free article] [PubMed] [Google Scholar]
- 5. Mariette, C. , Piessen G., and Triboulet J. P.. 2007. Therapeutic strategies in oesophageal carcinoma: role of surgery and other modalities. Lancet Oncol. 8:545–553. [DOI] [PubMed] [Google Scholar]
- 6. Jingu, K. , Ariga H., Nemoto K., Narazaki K., Umezawa R., Takeda K., et al. 2012. Long‐term results of radiochemotherapy for solitary lymph node metastasis after curative resection of esophageal cancer. Int. J. Radiat. Oncol. Biol. Phys. 83:172–177. [DOI] [PubMed] [Google Scholar]
- 7. Shi, M. , Chen D., Yang D., and Liu X. Y.. 2015. CCL21‐CCR7 promotes the lymph node metastasis of esophageal squamous cell carcinoma by up‐regulating MUC1. J. Exp. Clin. Cancer Res. 34:149. [DOI] [PMC free article] [PubMed] [Google Scholar]
- 8. Mertins, P. , Mani D. R., Ruggles K. V., Gillette M. A., Clauser K. R., Wang P., et al. 2016. Proteogenomics connects somatic mutations to signalling in breast cancer. Nature 534:55–62. [DOI] [PMC free article] [PubMed] [Google Scholar]
- 9. Hsu, C. H. , Hsu C. W., Hsueh C., Wang C. L., Wu Y. C., Wu C. C., et al. 2016. Identification and characterization of potential biomarkers by quantitative tissue proteomics of primary lung adenocarcinoma. Mol. Cell Proteomics 15:2396–2410. [DOI] [PMC free article] [PubMed] [Google Scholar]
- 10. DeSouza, L. V. , Grigull J., Ghanny S., Dubé V., Romaschin A. D., Colgan T. J., et al. 2007. Endometrial carcinoma biomarker discovery and verification using differentially tagged clinical samples with multidimensional liquid chromatography and tandem mass spectrometry. Mol. Cell Proteomics 6:1170–1182. [DOI] [PubMed] [Google Scholar]
- 11. Ross, P. L. , Huang Y. N., Marchese J. N., Williamson B., Parker K., Hattan S., et al. 2004. Multiplexed protein quantitation in Saccharomyces cerevisiae using amine‐reactive isobaric tagging reagents. Mol. Cell Proteomics 3:1154–1169. [DOI] [PubMed] [Google Scholar]
- 12. Wu, W. W. , Wang G., Baek S. J., and Shen R. F.. 2006. Comparative study of three proteomic quantitative methods, DIGE, cICAT, and iTRAQ, using 2D gel‐ or LC‐MALDI TOF/TOF. J. Proteome Res. 5:651–658. [DOI] [PubMed] [Google Scholar]
- 13. Chen, L. , Zhai L., Qu C., Zhang C., Li S., Wu F., et al. 2016. Comparative proteomic analysis of buffalo oocytes matured in vitro using iTRAQ technique. Sci. Rep. 6:31795. [DOI] [PMC free article] [PubMed] [Google Scholar]
- 14. Lin, L. L. , Huang H. C., and Juan H. F.. 2012. Discovery of biomarkers for gastric cancer: a proteomics approach. J. Proteomics. 75:3081–3097. [DOI] [PubMed] [Google Scholar]
- 15. Sobin, L. H. , Gospodarowicz M. K., and Wittekind C.. 2009. UICC TNM classification of malignant tumours, 7th ed. Springer, Berlin, Germany. [Google Scholar]
- 16. Watanabe, H. , Jass J. R., and Sobin L. H.. 1990. Histological typing of oesophageal and gastric tumours. Springer, Berlin, Germany. [Google Scholar]
- 17. Oppedijk, V. , van der Gaast A., van Lanschot J. J., van Hagen P., van Os R., van Rij C. M., et al. 2014. Patterns of recurrence after surgery alone versus preoperative chemoradiotherapy and surgery in the CROSS trials. J. Clin. Oncol. 32:385–391. [DOI] [PubMed] [Google Scholar]
- 18. Smit, J. K. , Güler S., Beukema J. C., Mul V. E., Burgerhof J. G., Hospers G. A., et al. 2013. Different recurrence pattern after neoadjuvant chemoradiotherapy compared to surgery alone in esophageal cancer patients. Ann. Surg. Oncol. 20:4008–4015. [DOI] [PubMed] [Google Scholar]
- 19. van Hagen, P. , Wijnhoven B. P. L., Nafteux P., Moons J., Haustermans K., De Hertogh G., et al. 2013. Recurrence pattern in patients with a pathologically complete response after neoadjuvant chemoradiotherapy and surgery for oesophageal cancer. Br. J. Surg. 100:267–273. [DOI] [PubMed] [Google Scholar]
- 20. Wright, M. E. , Han D. K., and Aebersold R.. 2005. Mass spectrometry‐based expression profiling of clinical prostate cancer. Mol. Cell Proteomics 4:545–554. [DOI] [PubMed] [Google Scholar]
- 21. Roy, J. , Winter C., Isik Z., and Schroeder M.. 2014. Network information improves cancer outcome prediction. Brief. Bioinform. 15:612–625. [DOI] [PubMed] [Google Scholar]
- 22. Auffray, C. 2007. Protein subnetwork markers improve prediction of cancer outcome. Mol. Syst. Biol. 3:141. [DOI] [PMC free article] [PubMed] [Google Scholar]
- 23. Song, Q. , Liu M., Bai J., Abliz A., Yuan W., Liu Z., et al. 2015. Mutation signature and intratumor heterogeneity of esophageal squamous cell carcinoma in a Chinese cohort. Cancer Res. 75:4797. [Google Scholar]
- 24. Du, X. L. , Hu H., Lin D. C., Xia S. H., Shen X. M., Zhang Y., et al. 2007. Proteomic profiling of proteins dysregulted in Chinese esophageal squamous cell carcinoma. J. Mol. Med. 85:863–875. [DOI] [PubMed] [Google Scholar]
- 25. Cao, H. H. , Zhang S. Y., Shen J. H., Wu Z. Y., Wu J. Y., Wang S. H., et al. 2015. A three‐protein signature and clinical outcome in esophageal squamous cell carcinoma. Oncotarget 6:5435–5448. [DOI] [PMC free article] [PubMed] [Google Scholar]
- 26. Uemura, N. , Nakanishi Y., Kato H., Saito S., Nagino M., Hirohashi S., et al. 2009. Transglutaminase 3 as a prognostic biomarker in esophageal cancer revealed by proteomics. Int. J. Cancer 124:2106–2115. [DOI] [PubMed] [Google Scholar]
- 27. Fu, L. , Qin Y. R., Xie D., Chow H. Y., Ngai S. M., Kwong D. L., et al. 2007. Identification of alpha‐actinin 4 and 67 kDa laminin receptor as stage‐specific markers in esophageal cancer via proteomic approaches. Cancer 110:2672–2681. [DOI] [PubMed] [Google Scholar]
- 28. Yan, S. , Zhou C., Lou X., Xiao Z., Zhu H., Wang Q., et al. 2009. PTTG overexpression promotes lymph node metastasis in human esophageal squamous cell carcinoma. Cancer Res. 69:3283–3290. [DOI] [PubMed] [Google Scholar]
- 29. Michaylira, C. Z. , Wong G. S., Miller C. G., Gutierrez C. M., Nakagawa H., Hammond R., et al. 2010. Periostin, a cell adhesion molecule, facilitates invasion in the tumor microenvironment and annotates a novel tumor‐invasive signature in esophageal cancer. Cancer Res. 70:5281–5292. [DOI] [PMC free article] [PubMed] [Google Scholar]
- 30. Sun, L. L. , Wu J. Y., Wu Z. Y., Shen J. H., Xu X. E., Chen B., et al. 2015. A three‐gene signature and clinical outcome in esophageal squamous cell carcinoma. Int. J. Cancer 136:E569–E577. [DOI] [PMC free article] [PubMed] [Google Scholar]
- 31. Zhu, X. , Ding M., Yu M. L., Feng M. X., Tan L. J., and Zhao F. K.. 2010. Identification of galectin‐7 as a potential biomarker for esophageal squamous cell carcinoma by proteomic analysis. BMC Cancer 10:290. [DOI] [PMC free article] [PubMed] [Google Scholar]
- 32. Liu, Q. , Cai X. W., Wu B., Zhu Z. F., Chen H. Q., and Fu X. L.. 2014. Patterns of failure after radical surgery among patients with thoracic esophageal squamous cell carcinoma: implications for the clinical target volume design of postoperative radiotherapy. PLoS ONE 9:e97225. [DOI] [PMC free article] [PubMed] [Google Scholar]
- 33. Nakagawa, S. , Kanda T., Kosugi S., Ohashi M., Suzuki T., and Hatakeyama K.. 2004. Recurrence pattern of squamous cell carcinoma of the thoracic esophagus after extended radical esophagectomy with three‐field lymphadenectomy. J. Am. Coll. Surg. 198:205–211. [DOI] [PubMed] [Google Scholar]
- 34. Uchikado, Y. , Natsugoe S., Okumura H., Setoyama T., Matsumoto M., Ishigami S., et al. 2005. Slug expression in the E‐cadherin preserved tumors is related to prognosis in patients with esophageal squamous cell carcinoma. Clin. Cancer Res. 11:1174–1180. [PubMed] [Google Scholar]
- 35. Kitaichi, T. , Yasui K., Tomie A., Gen Y., Dohi O., Naito Y., et al. 2015. Defective expression of partition‐defective 3 (PAR‐3) is associated with adverse prognostic factors in esophageal squamous cell carcinoma. Cancer Res. 4:18–22. [Google Scholar]
- 36. Nijtmans, L. G. , Artal S. M., Grivell L. A., and Coates P. J.. 2002. The mitochondrial PHB complex: roles in mitochondrial respiratory complex assembly, ageing and degenerative disease. Cell. Mol. Life Sci. 59:143–155. [DOI] [PMC free article] [PubMed] [Google Scholar]
- 37. Park, S. , Yoon S., Zhao Y., Park S. E., Liao L., Xu J., et al. 2012. Uterine development and fertility are dependent on gene dosage of the nuclear receptor coregulator REA. Endocrinology 153:3982–3994. [DOI] [PMC free article] [PubMed] [Google Scholar]
- 38. Wang, K. , Long B., Zhou L. Y., Liu F., Zhou Q. Y., Liu C. Y., et al. 2014. CARL lncRNA inhibits anoxia‐induced mitochondrial fission and apoptosis in cardiomyocytes by impairing miR‐539‐dependent PHB2 downregulation. Nat. Commun. 5:3596. [DOI] [PubMed] [Google Scholar]
- 39. Fusaro, G. , Dasgupta P., Rastogi S., Joshi B., and Chellappan S.. 2003. Prohibitin induces the transcriptional activity of p53 and is exported from the nucleus upon apoptotic signaling. J. Biol. Chem. 278:47853–47861. [DOI] [PubMed] [Google Scholar]
- 40. Wang, S. , Nath N., Adlam M., and Chellappan S.. 1999. Prohibitin, a potential tumor suppressor, interacts with RB and regulates E2F function. Oncogene 18:3501–3510. [DOI] [PubMed] [Google Scholar]
- 41. Lacombe, J. , Mange A., Bougnoux A. C., Prassas I., and Solassol J.. 2014. A multiparametric serum marker panel as a complementary test to mammography for the diagnosis of node‐negative early‐stage breast cancer and DCIS in young women. Cancer Epidemiol. Biomarkers Prev. 23:1834–1842. [DOI] [PubMed] [Google Scholar]
- 42. Fu, P. , Yang Z., and Bach L. A.. 2013. Prohibitin‐2 binding modulates insulin‐like growth factor‐binding protein‐6 (IGFBP‐6)‐induced rhabdomyosarcoma cell migration. J. Biol. Chem. 288:29890–29900. [DOI] [PMC free article] [PubMed] [Google Scholar]
- 43. Franzoni, A. , Dima M., D'Agostino M., Puppin C., D. Fabbro , Di Loreto C., et al. 2009. Prohibitin is overexpressed in papillary thyroid carcinomas bearing the BRAF(V600E) mutation. Thyroid 19:247–255. [DOI] [PubMed] [Google Scholar]
- 44. Begum, A. , Lin Q., Yu C., Kim Y., and Yun Z.. 2014. Interaction of delta‐like 1 homolog (Drosophila) with prohibitins and its impact on tumor cell clonogenicity. Mol. Cancer Res. 12:155–164. [DOI] [PMC free article] [PubMed] [Google Scholar]
- 45. Cheng, J. , Gao F., Chen X., Wu J., Xing C., Lv Z., et al. 2014. Prohibitin‐2 promotes hepatocellular carcinoma malignancy progression in hypoxia based on a label‐free quantitative proteomics strategy. Mol. Carcinog. 53:820–832. [DOI] [PubMed] [Google Scholar]