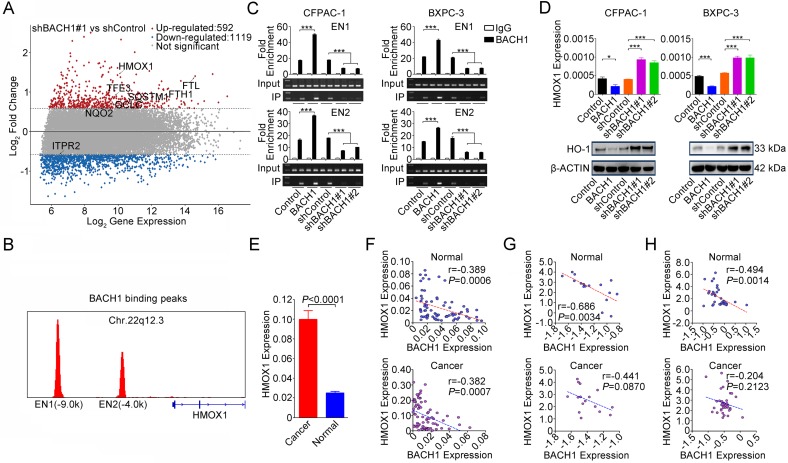
Figure 3.
BACH1 negatively regulates HO-1 expression in PDAC cells. (A) MA plot of the gene expression profile. Eight genes directly regulated by BACH1 were marked: red, upregulated; blue, downregulated; gray, not significantly changed. The dotted lines indicate the cut-off value of log2 fold change (± 0.58). (B) BACH1 binding peaks in the HMOX1 gene locus based on ChIP-sequencing data (GSM693953 and GSM693952). (C) Chromatin immunoprecipitation assays showing binding of BACH1 to two enhancers EN1 (-9.0kb) and EN2 (-4.0kb) in the upstream of HMOX1 in CFPAC-1 and BXPC-3 cells. Overexpression of BACH1 in these cells substantially enhanced enrichment of BACH1 in EN1 and EN2, while knockdown of BACH1 substantially decreased the enrichment in these two enhancers. Fold enrichment (mean ± SEM) represents DNA levels associated with BACH1 or IgG relative to an input control from three independent experiments. IgG served as negative control. ***, P<0.001 compared with Control or shControl. (D) Overexpression of BACH1 suppressed HO-1 expression while knockdown of BACH1 elevated HO-1 expression in both mRNA and protein levels in CFPAC-1 and BXPC-3 cells. *, P<0.05; ***, P<0.001 compared with Control or shControl. (E) HMOX1 mRNA expression was significantly higher in PDAC compared with their adjacent normal tissues (N=75). Results are mean ± SEM normalized to GAPDH and the P-values are for Student's t-test. (F) Correlation between BACH1 and HMOX1 mRNA levels in PDAC and paired normal tissues (N=75). The RNA levels were determined by qRT-PCR and expressed relative to GAPDH. The r- and P-values are for Pearson's correlation analysis. (G-H) Correlation between BACH1 and HMOX1 mRNA levels in PDAC and paired normal tissues. Data are from Oncomine database generated by Pei et al. 27 and Badea et al. 28.

