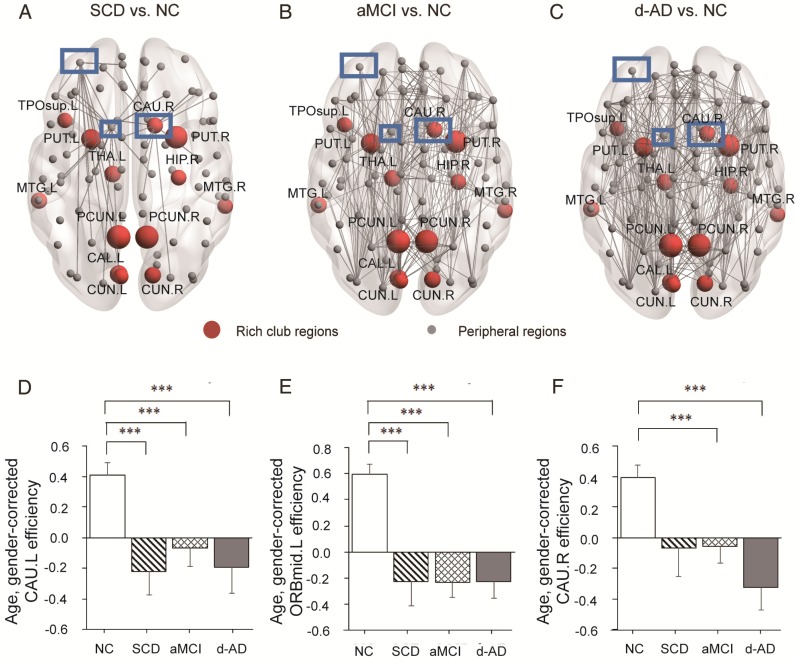
Figure 6.
Whole-brain structural connectivity of nodes with the highest number of aberrant connections in SCD individuals relative to NC. (A-C) Nodes in the blue box (CAU.L, CAU.R, ORBmid.L) were those with the highest number of aberrant connections in SCD individuals relative to NC. The connections displayed are those that connect with the CAU.L, CAU.R, and ORBmid.L. The bar graphs display the mean (standard error) of the age- and gender-corrected nodal efficiency values of (D) CAU.L, (E) ORBmid.L and (F) CAU.R for each group.

