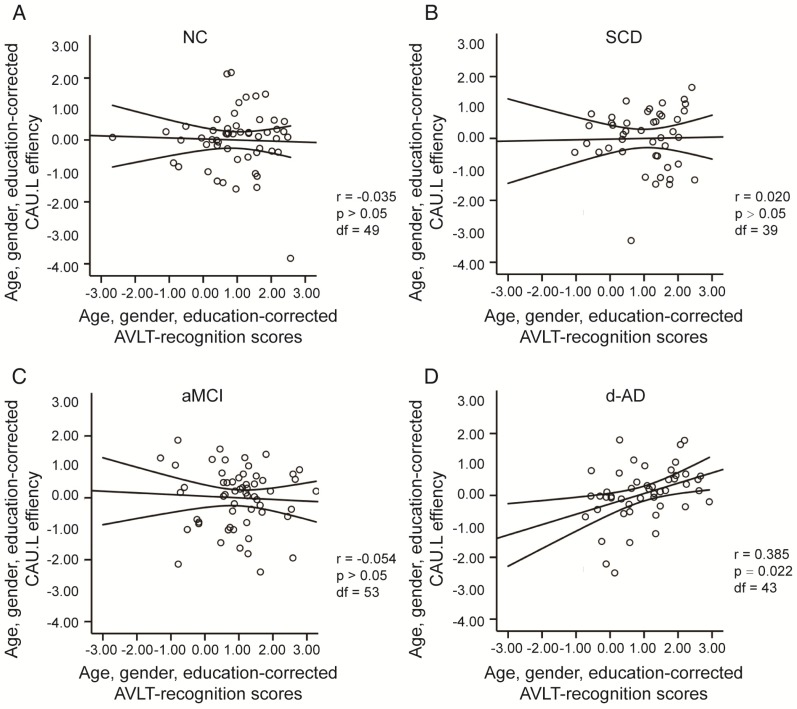
Figure 8.
The scatter plots illustrate the significant associations between CAU.L nodal efficiency and AVLT-recognition scores controlled for age, gender and education after Bonferroni corrections for the number of cognitive test variables in (A) NC, (B) SCD, (C) aMCI, (D) d-AD groups. The solid lines show the best-fitting linear regression line and the 95% confidence intervals.

