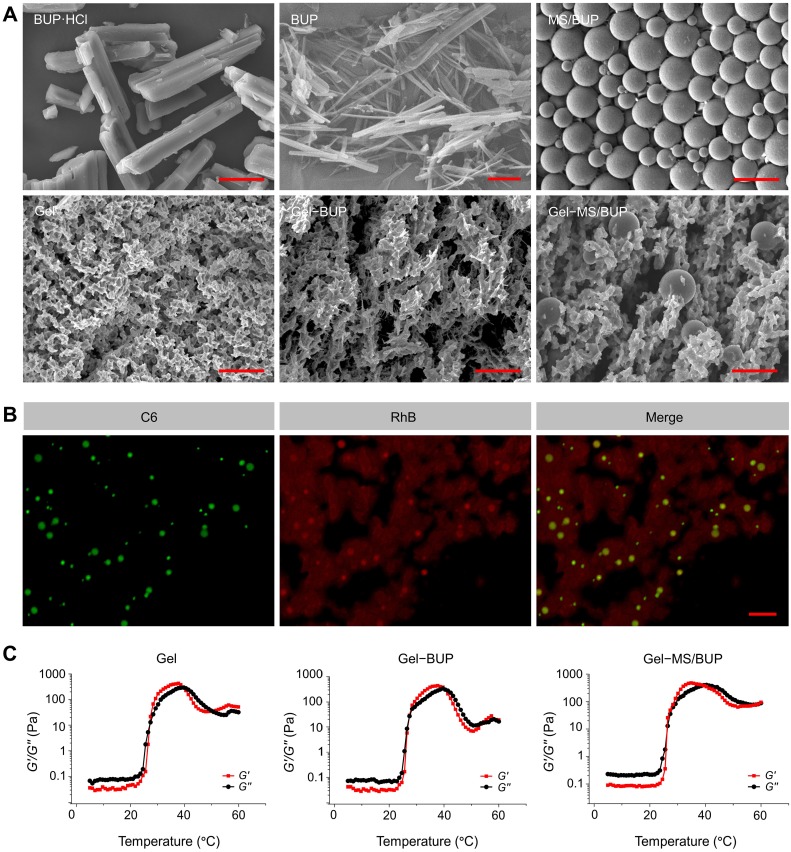
Figure 1.
Characterization of the Gel-microsphere system. (A) SEM images of BUP·HCl, BUP, and MS (the upper panel), and Gel, Gel-BUP, and Gel-MS/BUP (the lower panel). Scale bars are 2.5 μm for BUP and 25 μm for the others. (B) CLSM analysis of fluorescently labeled Gel-MS. Green and red fluorescences indicate C6-labeled MS and RhB-labeled Gel, respectively. Scale bar = 100 μm. (C) Rheological properties of Gel, Gel-BUP, and Gel-MS/BUP.

