Abstract
Indinavir is a viral protease inhibitor used for the treatment of HIV infection. Unconjugated hyperbilirubinemia develops in up to 25% of patients receiving indinavir, prompting drug discontinuation and further clinical evaluation in some instances. We postulated that this side-effect is due to indinavir-mediated impairment of bilirubin UDP-glucuronosyltransferase (UGT) activity and would be most pronounced in individuals with reduced hepatic enzyme levels, as occurs in ≈10% of the population manifesting Gilbert's syndrome. This hypothesis was tested in vitro, in the Gunn rat model of UGT deficiency, and in HIV-infected patients with and without the Gilbert's polymorphism. Indinavir was found to competitively inhibit UGT enzymatic activity (KI = 183 μM) while concomitantly inducing hepatic bilirubin UGT mRNA and protein expression. Although oral indinavir increased plasma bilirubin levels in wild-type and heterozygous Gunn rats, the mean rise was significantly greater in the latter group of animals. Similarly, serum bilirubin increased by a mean of 0.34 mg/dl in indinavir-treated HIV patients lacking the Gilbert's polymorphism versus 1.45 mg/dl in those who were either heterozygous or homozygous for the mutant allele. Whereas saquinavir also competitively inhibits UGT activity, this drug has not been associated with hyperbilirubinemia, most likely because of the higher KI (360 μM) and substantially lower therapeutic levels as compared with indinavir. Taken together, these findings indicate that elevations in serum-unconjugated bilirubin associated with indinavir treatment result from direct inhibition of bilirubin-conjugating activity.
The HIV protease is an essential enzyme that cleaves viral gag and gag-pol polypeptide chains into smaller functional proteins. Blocking viral protease activity results in the release of structurally disorganized and noninfectious virions (1). Indinavir is a potent protease inhibitor that, when used in combination with reverse transcriptase inhibitors, has been shown to effectively suppress viral replication, reduce morbidity, and prolong survival in HIV-infected patients (2, 3). Unfortunately, indinavir therapy is associated with a 6–25% incidence of asymptomatic, unconjugated hyperbilirubinemia (2–5) in the absence of histologic liver injury (6). Patients in whom excessive accumulation of bilirubin leads to the development of clinical jaundice have been subjected to treatment interruption and additional clinical investigation.
Bilirubin, the principal product of heme catabolism, is cleared from the circulation by the liver where it is conjugated with glucuronic acid to form water-soluble metabolites destined for secretion into bile. The glucuronidation reaction is mediated by the microsomal enzyme, bilirubin UDP-glucuronosyltransferase (UGT). A total of 15 human UGT isoforms have been identified, each with distinct substrate specificities (7). Of these, eight are encoded by the UGT1A locus, including the bilirubin-specific isoform (UGT1A1). The substrate specificity of UGT1A enzymes is conferred by exon 1, whereas the carboxyl sequence, encoded by exons 2 through 5, is conserved between the various isoforms (7).
Metabolism of indinavir occurs primarily through the cytochrome P450 3A4 isoenzyme. However, the identification of a glucuronide metabolite of indinavir (8, 9) suggests that this drug may also serve as a substrate for UGT. This finding led us to postulate that elevated serum bilirubin levels result from an inhibitory effect of indinavir on bilirubin conjugation, and that hyperbilirubinemia will be most pronounced in individuals manifesting impaired bilirubin metabolism. One common example is Gilbert's syndrome, an inherited defect in hepatic bilirubin-conjugating activity that affects 5–10% of the general population (10, 11). This benign condition is caused by a polymorphism in the promoter TATA element of the gene encoding UGT1A1, leading to a TA insertion into the wild-type A(TA)6TAA sequence (12). Liver homogenates from individuals homozygous for the Gilbert's A(TA)7TAA genotype exhibit a 50% reduction in bilirubin-conjugating activity (13). Given the high frequency of this polymorphism (11–14), we speculate that indinavir-induced hyperbilirubinemia manifests primarily in patients possessing the Gilbert's allele.
To elucidate the mechanism of indinavir-induced hyperbilirubinemia, we examined the effect of this drug on hepatic UGT1A1 expression and activity in vitro, and in a mutant strain of rat (Gunn) possessing an inherited deficiency of bilirubin UGT. We also assessed HIV-infected patients for the Gilbert's polymorphism and correlated our findings with treatment-associated changes in serum bilirubin levels. Our data indicate that indinavir causes hyperbilirubinemia via competitive inhibition of bilirubin UGT activity.
Materials and Methods
Materials.
Unconjugated bilirubin (bilirubin IXα) was obtained from Porphyrin Products (Logan, UT) and further purified according to the method of McDonagh and Assisi (15). Dioleoylphosphatidylcholine was purchased from Avanti Polar Lipids. All other chemicals were obtained from Sigma.
Isolation of Microsomal Membranes from Rat Liver.
Microsomal membranes were isolated from fasted male Wistar rats (250–300 g) by using established methods (16). Briefly, livers were resected, homogenized in 0.25 M sucrose/1 mM EDTA (pH 7.3), and subjected to serial centrifugation at 41,000 × g for 7 min and 80,000 × g for 23.5 min. Protein concentration was quantified by using the Bio-Rad protein assay.
Assay of Bilirubin Glucuronide Production.
Bilirubin UGT activity was assayed by using a modification of the diazo reaction procedure of Seppen et al. (17). Vesicles composed of dioleoylphosphatidylcholine were prepared by sonication, as previously described (18). Rat liver microsomes (10 mg protein/ml) were preincubated with 12.5 mg/ml digitonin for 1 h on ice and then added to dioleoylphosphatidylcholine vesicles (2.5 mg of phospholipid/ml) suspended in 50 mM Tris-HCl (pH 7.8) containing 5 mM MgCl2/3.5 mM UDP-glucuronic acid/1 mM 1,4-saccharolactone at a final concentration of 2 mg protein/ml. Following a 10-min incubation at 37°C, the glucuronidation reaction was initiated by adding a small aliquot (<5% total volume) of unconjugated bilirubin solubilized in 50 mM NaOH. Reactions were conducted in the presence of varying concentrations (0–500 μM) of indinavir and terminated by adding 3 volumes of 0.4 M glycine/HCl (pH 2.7). Subsequently, 1.5 volumes of diazo reagent (0.1 ml of ethyl anthranilate, 0.3 ml of 70 mM NaNO2, and 0.1 ml 88 mM ammonium sulfamate in 10 ml of 150 mM HCl) was added to the mixture (17, 19), which was incubated at room temperature. The diazo reaction was terminated after 30 min with 1 volume of 570 mM ascorbate. Azopigments were extracted with 3 volumes of methylpropylketone/butyl-1-acetate (17:3, vol:vol), and the absorbance of the organic layer was measured at 530 nm. Bilirubin glucuronide concentrations were calculated based on an extinction coefficient of 44,400 M−1 cm−1 (17).
Assessment of UDP-Glucuronosyltransferase Expression in Rat Hepatoma Cells.
The effect of indinavir on bilirubin UGT mRNA and protein expression in cultured H35 rat hepatoma cells was assessed by Northern and Western blotting. Monolayers were incubated for 18 h in Dulbecco's modified essential medium containing varying concentrations of indinavir (0–50 μM). Total cellular RNA was then extracted and subjected to Northern blotting with a cDNA probe specific for exon 1 of rat UGT1A1 (bp 1–943) and with a nonspecific UGT probe (bp 1004–1601) comprising exons 2 through 5 (7). Western blotting was performed on H35 cell microsomes isolated by using a modification of the method of Seppen et al. (20). Cells were disrupted by probe sonication (30-s pulse), nuclei and large debris were eliminated by serial centrifugation at 4,000 × g and 41,000 × g for 10 min, and microsomal membranes were pelleted at 80,000 × g for 1 h. Blots were developed with rabbit antiserum produced by the injection of a multiple antigen peptide matrix containing a 20-aa synthetic peptide (VFGPYASHAGRLLVFPMDGS) corresponding to a portion of the bilirubin-binding domain of mouse UGT1A1 (21), by using the Renaissance ECL detection system (NEN).
Measurement of Plasma Bilirubin Levels and Hepatic UGT Expression in Indinavir-Treated Rats.
Following an overnight fast, 250-g heterozygous (j/+) Gunn rats and wild-type (+/+) Wistar rats were administered 240 mg/kg indinavir, solubilized in 0.05 M citric acid (240 mg/ml) every 8 h via gavage (22). Tail vein blood samples (500 μl) were obtained before and 3 h following the fourth dose of indinavir, after which the animals were killed and hepatic UGT expression was assessed by Northern and Western blotting. Plasma bilirubin levels were measured by using the Sigma diagnostics total bilirubin assay kit, according to the manufacturer's instructions.
Patient Selection and Characterization of UGT1A1 Promoter Genotypes.
Sample collection for genetic testing was approved by the Institutional Review Board. HIV-infected men were eligible for enrollment after having received a standard dose (800 mg thrice daily) of oral indinavir for a minimum of 4 weeks. Patients were selected based on the availability of bilirubin values before and during the first course of indinavir use, the ability to provide informed consent for genetic testing for UGT1A1 polymorphisms, and a willingness to supply a blood sample for cellular DNA extraction and analysis. Efforts were made to recruit an equal proportion of subjects who exhibited an increase in serum total bilirubin either greater than or less than 0.5 mg/dl. Female patients were excluded because of the more pronounced phenotypic expression of Gilbert's syndrome in males (12). DNA was isolated from whole blood lymphocytes by using QIAamp DNA blood mini kits (Qiagen, Chatsworth, CA). PCR amplification was performed with forward (5′-CTTGGTGTATCGATTGGTTTTTG-3′) and reverse (5′-TTTGCTCCTGCCAGAGGTTCG-3′) primers encompassing the UGT1A1 TATA box (23). PCR products were separated on a 12% acrylamide gel and visualized with ethidium bromide. Fragment identity was confirmed by using samples of known genotype, as determined by direct sequencing. Serum levels of total and unconjugated bilirubin, hemoglobin, alanine aminotransferase, and albumin were measured immediately before the initiation of indinavir treatment and after a minimum of 4 weeks of therapy.
Statistical Analyses.
Data were analyzed by using a computer-based statistical package (STATISTIX 7, Analytical Software). Demographic characteristics of the human subjects were compared by using parametric and nonparametric statistics as appropriate for the data type. Mean bilirubin levels were compared by using ANOVA test with Scheffé comparison of means. Stepwise regression was used to determine the contribution of potential risk factors. A two-tailed hypothesis with alpha-0.05 was used throughout.
Results
Effect of Indinavir on Bilirubin UDP-Glucuronosyltransferase Activity.
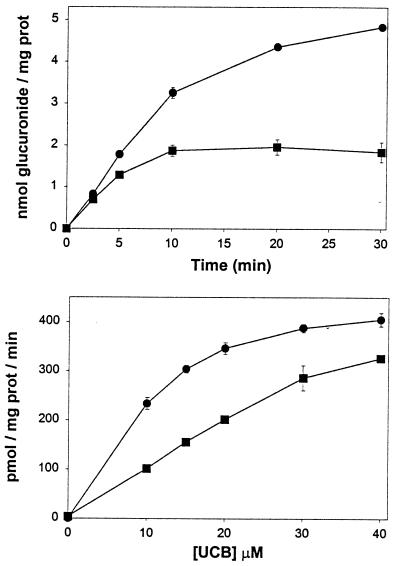
Initial studies focused on the modulatory effects of indinavir on bilirubin conjugation. Because UDP-glucuronosyltransferases are localized primarily in the hepatocyte endoplasmic reticulum (24, 25), isolated liver microsomal membranes served as a source of enzyme activity. The addition of unconjugated bilirubin to a suspension of rat liver microsomes resulted in a time- and concentration-dependent increase in bilirubin glucuronide formation, as assessed by the diazo assay (Fig. 1 Upper). Because the reaction is highly linear over the first 3 min of incubation, the initial rate of glucuronide production was determined at this time point in subsequent experiments. In the presence of 500 μM indinavir, bilirubin glucuronide formation was significantly reduced at each concentration of unconjugated bilirubin studied (Fig. 1 Lower).
Figure 1.
Bilirubin conjugation by rat liver microsomes. (Upper) Time course for the generation of bilirubin glucuronides following the addition of 20 μM (■) or 50 μM (●) unconjugated bilirubin to a suspension of rat liver microsomes (2 mg/ml protein). Each point reflects the mean (±SD) of three experiments and is corrected for baseline absorbance. (Lower) The initial rate of bilirubin glucuronide production in the presence (■) or absence (●) of 500 μM indinavir is plotted against the concentration of unconjugated bilirubin (UCB).
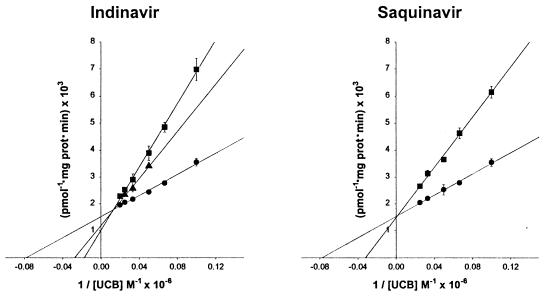
To elucidate the mechanism whereby indinavir inhibits bilirubin conjugation, experiments were conducted over a range of bilirubin (0–50 μM) and indinavir (0–500 μM) concentrations. A reciprocal plot of the data (Fig. 2 Left) is consistent with competitive inhibition of bilirubin UGT activity, with a calculated dissociation constant for the enzyme inhibitor complex (KI) of 183 μM. It is notable that values obtained for the Km (12.8 μM) and Vmax (655 pmol × mg protein−1 × min−1) of rat bilirubin UGT are in close agreement with previously reported results (7, 25, 26). To determine whether this effect is unique to indinavir, parallel studies were performed with saquinavir (Fig. 2 Right), an HIV protease inhibitor that has not been associated with hyperbilirubinemia. Interestingly, this drug also was found to competitively inhibit bilirubin conjugation, albeit with a KI value (360 μM) that is significantly higher than indinavir.
Figure 2.
Reciprocal plots of bilirubin UGT activity. (Left) A reciprocal plot of the initial velocity of bilirubin glucuronide formation versus the concentration of unconjugated bilirubin (UCB) measured in the absence (●) or presence of 250 μM (▴) or 500 μM (■) indinavir. Points reflect the mean (±SD) of three experiments and are fit to linear functions (solid lines). Values for the Km (12.8 ± 1.0 μM, ±SE) and Vmax (655 ± 22 pmol glucuronide × mg protein−1 × min−1) of bilirubin UGT were determined from the fit of data obtained in the absence of indinavir to the expression: y = 1/Vmax + Km/Vmax. (Right) Identical experimental conditions were used in an analysis of the effect of 500 μM saquinavir (■) on bilirubin UGT activity (KI = 360 ± 11 μM). In the absence of saquinavir (●), Km and Vmax values were 12.9 ± 0.9 μM and 654 ± 20 pmol × mg protein−1 × min−1, respectively.
Effect of Indinavir on Bilirubin UGT Expression in Rat Hepatoma Cells.
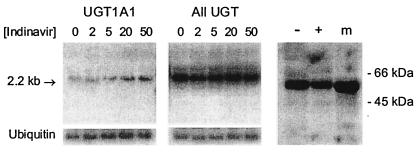
To determine whether indinavir also exerts an effect at the transcriptional or translational level, we analyzed the expression of bilirubin UGT in cultured H35 rat hepatoma cells. Monolayers were grown for 18 h in the presence or absence of indinavir, following which total cellular RNA was isolated and subjected to Northern blotting with a cDNA probe specific for exon 1 of UGT1A1 and with a nonspecific probe (encompassing exons 2 through 5) that hybridizes with all UGT isoforms. A 2-fold increase in UGT1A1 mRNA was observed as the indinavir concentration was increased from 0 to 50 μM (Fig. 3 Left), in the absence of a demonstrable effect on total UGT1A mRNA levels (Fig. 3 Center). In contrast, the addition of 50 μM indinavir to the incubation media was associated with a nonsignificant (29%) decrease in bilirubin UGT protein expression, as assessed by Western blotting of isolated H35 cell microsomes (Fig. 3 Right).
Figure 3.
Effect of indinavir on UGT expression in rat hepatoma cells. Monolayers of H35 rat hepatoma cells were grown for 18 h in the presence of indinavir (0–50 μM). Cells were harvested, and 25 μg of total cellular RNA were subjected to Northern blotting with a murine cDNA probe specific for exon 1 of UGT1A1 (Left) and with a nonspecific UGT probe (Center). Blots were stripped and rehybridized with cDNA for ubiquitin to control for loading (Lower). (Right) H35 cells were harvested following an 18-h incubation in the absence (−) or presence (+) of 50 μM indinavir, and the microsomal fraction (30 μg protein) was subjected to SDS/PAGE on a 10% gel. The final lane contains rat liver microsomes (m) as control. Western blotting was performed with rabbit antiserum (1:2,000 dilution), and a 55-kDa band corresponding to bilirubin UGT was identified.
Comparison of Bilirubin Levels in Wistar and Heterozygous Gunn Rats Treated with Indinavir.
The findings of the preceding in vitro experiments suggest that indinavir-induced hyperbilirubinemia results from direct inhibition of bilirubin UGT activity. This hypothesis was tested in vivo using Gunn rats, a mutant strain of Wistar rat possessing an inherited deficiency in hepatic bilirubin-conjugating activity caused by a −1 frameshift mutation in the UGT1A1 gene (27). Animals homozygous (j/j) for the Gunn mutation are overtly jaundiced because of the absence of hepatic UGT1A1 (28, 29). In contrast, heterozygous (j/+) Gunn rats exhibit normal basal plasma bilirubin levels despite enzyme activities that are ≈50% that of their wild-type (+/+) Wistar counterparts (28). Indeed, the mean plasma bilirubin concentration in j/+ animals (0.054 ± 0.002 mg/dl; ±SE) was not significantly different (P = 0.13) from +/+ controls (0.050 ± 0.002 mg/dl) (Fig. 4).
Figure 4.
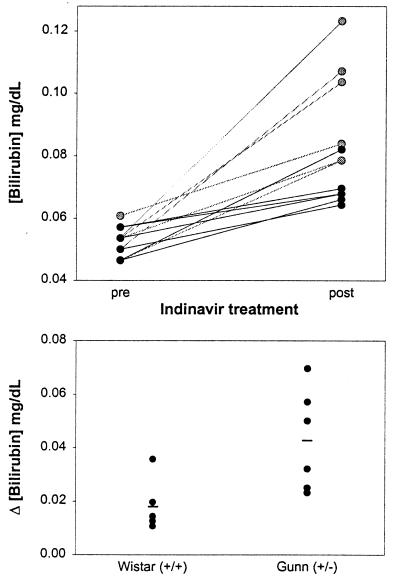
Effect of indinavir on plasma bilirubin levels in Wistar and heterozygous Gunn rats. (Upper) The concentration of total bilirubin in the plasma of wild-type (+/+) Wistar (n = 6, dark circles) and heterozygous (j/+) Gunn (n = 6, gray circles) rats before (pre) and after (post) receiving four doses of indinavir (240 mg/kg) every 8 h via gavage. Mean plasma bilirubin levels increased from 0.050 ± 0.002 to 0.070 ± 0.003 mg/dl (±SE) in +/+ rodents (P < 0.0001) and from 0.054 ± 0.002 to 0.096 ± 0.007 mg/dl (P = 0.0007) in j/+ animals. (Lower) the change in the plasma bilirubin concentration, stratified by genotype, is plotted for each animal. The lines reflect mean values for the +/+ (0.018 ± 0.004 mg/dl) and j/+ (0.043 ± 0.008 mg/dl) rats (P = 0.02).
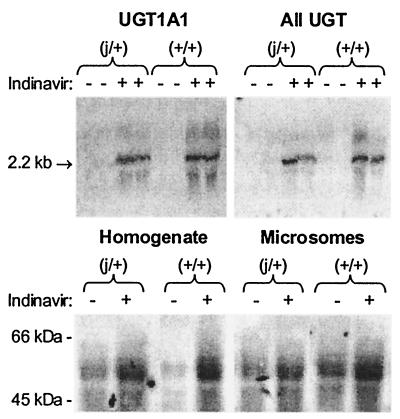
Speculating that hyperbilirubinemia will be more pronounced under conditions where hepatic bilirubin-conjugating activity is reduced, we examined the effect of indinavir on the concentration of bilirubin in the plasma of +/+ and j/+ rats. Animals were administered indinavir at a dose of 240 mg/kg every 8 h via gavage, and tail vein blood samples were obtained before treatment and 3 h after the fourth dose. As shown in Fig. 4 (Upper), plasma bilirubin levels increased in both groups of animals following treatment. However, the mean rise in plasma bilirubin was significantly greater in the heterozygous Gunn (j/+) rats (0.043 ± 0.008 mg/dl, ±SE) versus wild-type (+/+) animals (0.018 ± 0.004 mg/dl) (Fig. 4 Lower). Notably, hepatic levels of UGT1A1 mRNA and protein also were substantially higher in indinavir-treated rats as compared with untreated +/+ and j/+ animals (Fig. 5), suggesting that the drug does not inhibit bilirubin conjugation by suppressing enzyme expression. The finding that hyperbilirubinemia is more pronounced in animals with reduced bilirubin UGT activity is consistent with the hypothesis that indinavir competes with bilirubin for conjugation.
Figure 5.
Hepatic UGT expression in indinavir-treated and untreated rats. Total RNA was isolated from the livers of untreated (−) heterozygous Gunn (j/+) and wild-type Wistar (+/+) rats and from animals treated with four doses of indinavir (240 mg/kg) every 8 h via gavage (+). Northern blotting (25 μg of RNA) was performed by using a murine cDNA probe specific for exon 1 of UGT1A1 (Upper Left) and a nonspecific UGT probe (Upper Right). (Lower) 500 μg of whole liver homogenate (Left) and 50 μg of isolated hepatic microsomes (Right) from indinavir-treated (+) and untreated (−) rats was subjected to Western blotting with rabbit antiserum (1:500 dilution).
Influence of the Gilbert's Polymorphism on Indinavir-Induced Hyperbilirubinemia in HIV-Infected Patients.
We sought to extend the findings of our rodent studies to humans by analyzing a series of HIV-infected patients undergoing treatment with indinavir. A total of 15 male patients who had received indinavir for a minimum of 4 weeks were screened for the Gilbert's TATA box mutation, and the findings correlated with pretreatment and posttreatment serum bilirubin levels. Demographic and laboratory data are summarized in Table 1. Polymorphisms in the promoter region of the UGT1A1 gene were characterized by PCR analysis of DNA isolated from peripheral blood lymphocytes (Fig. 6). Consistent with previous reports (12, 14, 30), baseline bilirubin concentrations in serum samples obtained before the initiation of indinavir therapy correlated with the number of Gilbert's alleles (P = 0.037). Mean serum bilirubin levels were significantly higher in patients homozygous for A(TA)7TAA (0.96 ± 0.22 mg/dl) than in A(TA)6TAA homozygotes (0.50 ± 0.28 mg/dl), with heterozygous individuals exhibiting intermediate levels (0.75 ± 0.19 mg/dl).
Table 1.
Demographic and laboratory data for HIV-infected patients treated with indinavir
| Characteristic | Indinavir-treated patients (n = 15) | |||
|---|---|---|---|---|
| Mean age (yr) | 40.8 ± 6.7 | |||
| (range 30–55) | ||||
| % male | 100 | |||
| Race | ||||
| Caucasian | 13 | |||
| African-American | 2 | |||
| Mean duration of HIV infection (yr) | 8.0 ± 5.1 | |||
| (range 2–15) | ||||
| Mean length of treatment (wk) | 21.9 ± 30.2 | |||
| (range 4–116) | ||||
| Other liver disease | ||||
| Hepatitis B | 1 | |||
| Hepatitis C | 1 | |||
| n | Pretreatment | Posttreatment | P value* | |
| Total bilirubin (mg/dl) | 15 | 0.72 ± 0.29 | 1.80 ± 1.12 | 0.0007 |
| (range 0.3–1.3) | (range 0.4–4.1) | |||
| Indirect bilirubin (mg/dl) | 9 | 0.51 ± 0.21 | 1.20 ± 0.80 | 0.015 |
| (range 0.2–0.8) | (range 0.3–2.5) | |||
| Direct bilirubin (mg/dl) | 9 | 0.13 ± 0.05 | 0.22 ± 0.11 | 0.035 |
| (range 0.1–0.2) | (range 0.1–0.4) | |||
| Albumin (g/dl) | 15 | 4.30 ± 0.39 | 4.38 ± 0.49 | 0.42 |
| (range 3.6–4.9) | (range 2.9–4.9) | |||
| ALT (units/liter) | 15 | 38.3 ± 24.0 | 25.1 ± 14.7 | 0.053 |
| (range 16–84) | (range 14–73) | |||
| Hemoglobin (g/dl) | 14 | 13.9 ± 1.6 | 13.4 ± 2.8 | 0.35 |
| (range 10.7–15.8) | (range 5.8–17.0) |
Values are expressed as the mean ± SD.
Student's paired t test.
Figure 6.
Genotyping of UGT1A1 promoter polymorphisms. DNA samples from five separate HIV-infected patients were amplified by PCR using primers specific for the UGT1A1 promoter region and subjected to electrophoresis on a 12% acrylamide gel. The presence of the A(TA)6TAA allele results in a 71-bp PCR product, whereas the A(TA)7TAA allele yields a 73-bp fragment. Genotypes are assigned as follows: 6/6, homozygous for the wild-type A(TA)6TAA allele; 7/7, homozygous for the A(TA)7TAA Gilbert's allele; 6/7, heterozygous for the A(TA)6TAA and A(TA)7TAA alleles.
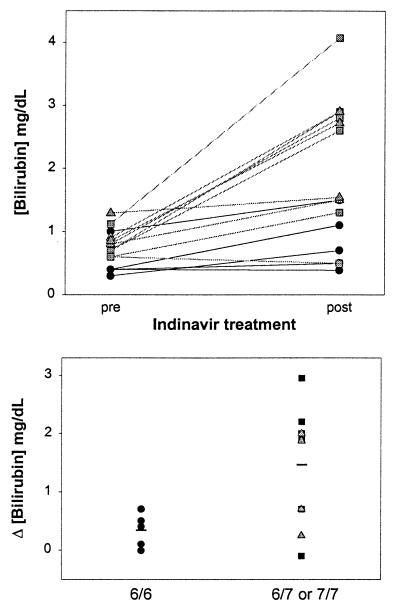
The concentration of total bilirubin in the serum increased in 13 of the 15 patients after receiving indinavir (Fig. 7 Upper), primarily because of a rise in the unconjugated (indirect) fraction (Table 1). Hyperbilirubinemia was more pronounced in individuals possessing one or both of the A(TA)7TAA alleles versus A(TA)6TAA homozygotes (Fig. 7 Lower), with mean posttreatment bilirubin levels of 2.36 ± 1.27, 2.17 ± 0.75, and 0.84 ± 0.46 mg/dl, respectively. Data analysis employing a stepwise regression model indicates that the presence of the Gilbert's mutation is highly predictive of elevated posttreatment bilirubin levels (P = 0.012). Based on the absence of a concomitant decline in serum hemoglobin (Table 1), drug-induced hemolysis is unlikely to have contributed to the increased bilirubin concentrations. Even in the subgroup of six patients exhibiting a greater than 1 mg/dl rise in serum bilirubin, hemoglobin levels before (13.9 ± 1.5 g/dl) and after (13.9 ± 1.2 g/dl) treatment were unchanged. Posttreatment levels of serum albumin and alanine aminotransferase were normal (Table 1), arguing against underlying hepatic dysfunction, and no correlation between the presence of viral hepatitis and elevated serum bilirubin was found.
Figure 7.
Influence of the Gilbert's polymorphism on serum bilirubin levels in HIV-infected patients treated with indinavir. (Upper) Serum total bilirubin concentrations for individual patients with UGT1A1 promoter genotype 6/6 (dark circles), 6/7 (gray squares), and 7/7 (gray triangles) before (pre) and after (post) receiving a minimum of 4 weeks of oral indinavir. (Lower) The change in serum bilirubin concentration for each patient following indinavir treatment is stratified for the absence (6/6, dark circles) or presence (6/7, dark squares; or 7/7, gray triangles) of the Gilbert's mutation. Mean values for each group (solid lines) were 0.34 ± 0.29 mg/dl and 1.45 ± 0.99 mg/dl (±SD), respectively (P = 0.030).
Discussion
Indinavir is a potent and commonly used protease inhibitor that has been shown to be highly effective against HIV when used in combination with reverse transcriptase inhibitors (2, 3). Unconjugated hyperbilirubinemia is a frequent side-effect of this medication, which may confound medical management. The results of our in vitro studies indicate that indinavir causes increased serum levels of unconjugated bilirubin by competitively inhibiting bilirubin UDP-glucuronosyltransferase activity. Our finding that indinavir treatment is associated with increased hepatic UGT1A1 levels argues against a mechanism involving drug-mediated down-regulation of enzyme expression and further supports that indinavir-induced hyperbilirubinemia is because of direct inhibition of enzyme activity. Interestingly, prior studies have shown that bilirubin is a potent inhibitor of the HIV-1 protease (31), suggesting that bilirubin may share structural homology with other protease inhibitors. In this regard, saquinavir also inhibits bilirubin UGT activity in a competitive manner. The absence of an association of this drug with clinical hyperbilirubinemia is likely because of the 2-fold higher KI and 40-fold lower peak serum concentrations as compared with indinavir (32).
Our data support a strong association between the presence of the Gilbert's allele and the risk of developing hyperbilirubinemia on indinavir, providing some direct evidence for a pharmacologically relevant effect of what is generally considered to be a benign condition. In fact, only those patients possessing the A(TA)7TAA allele exhibited posttreatment serum bilirubin levels in the range normally associated with clinically apparent jaundice (>2.3 mg/dl). As compared with the 6/6 promoter genotype, the 6/7 and 7/7 genotypes are associated with substantially lower median levels of hepatic bilirubin UGT activity (13). Hence, it follows that individuals who possess the A(TA)7TAA allele will manifest heightened susceptibility to hyperbilirubinemia as a consequence of indinavir-mediated enzyme inhibition. In an analogous manner, it has previously been shown that the presence of the Gilbert's polymorphism is a major determinant of serum bilirubin concentrations in heterozygous β-thalassemia and in glucose-6-phosphate dehydrogenase deficiency (23).
It is notable that a proportion of HIV-infected patients who possess the A(TA)7TAA allele do not manifest hyperbilirubinemia on indinavir. We postulate that this is because of the well documented variability in phenotypic expression of the Gilbert's mutation (13), with hyperbilirubinemia manifesting in patients with the lowest levels of hepatic UGT activity. Alternatively, it has been proposed that a simultaneous defect in hepatic organic anion transport is present in individuals with Gilbert's syndrome who manifest baseline unconjugated hyperbilirubinemia (33). These same patients might be expected to exhibit heightened sensitivity to indinavir. Against this possibility, however, is the absence of a correlation between pretreatment and posttreatment bilirubin levels in our study patients. Regardless, our data indicate that the presence of the Gilbert's mutation predisposes HIV-infected patients to indinavir-induced hyperbilirubinemia. In individuals possessing the A(TA)7TAA allele, the development of elevated serum levels of unconjugated bilirubin following initiation of indinavir, in the absence of other liver test abnormalities, seems to represent a benign process. In fact, there is evidence to suggest that bilirubin reduces the infectivity of HIV (31); hence, the induction of hyperbilirubinemia actually may enhance the efficacy of treatment.
Acknowledgments
We thank Ms. Tammy Powell for technical assistance. These studies were supported by National Institutes of Health Research Grants DK-51679 (to S.D.Z.), AI-25897 (to J.F. and K.E.S.), and HD-40027 (to R.M.G.) and a Veterans Affairs Hospitals merit award (to R.M.G.).
Abbreviation
- UGT
UDP-glucuronosyltransferase
Footnotes
This paper was submitted directly (Track II) to the PNAS office.
References
- 1.Kohl N E, Emini E A, Schleif W A, Davis L J, Heimbach J C, Dixon R A, Scolnick E M, Sigal I S. Proc Natl Acad Sci USA. 1988;85:4686–4690. doi: 10.1073/pnas.85.13.4686. [DOI] [PMC free article] [PubMed] [Google Scholar]
- 2.Hammer S M, Squires K E, Hughes M E, Grimes J M, Demeter L M, Currier J S, Eron J J, Feinberg J E, Balfour H H, Deyton L R, et al. N Engl J Med. 1997;337:725–733. doi: 10.1056/NEJM199709113371101. [DOI] [PubMed] [Google Scholar]
- 3.Roy M G, Mellors J W, Havlir D, Eron J J, Gonzalez C, McMahon D, Richman D D, Valentine F T, Jonas L, Meibohm A, et al. N Engl J Med. 1997;337:734–739. doi: 10.1056/NEJM199709113371102. [DOI] [PubMed] [Google Scholar]
- 4.Stein D S, Fish D G, Bilello J A, Preston S L, Martineau G L, Drusano G L. AIDS. 1996;10:485–492. doi: 10.1097/00002030-199605000-00006. [DOI] [PubMed] [Google Scholar]
- 5.Kaul D R, Cinti S K, Carver P L, Kazanjian P H. Pharmacotherapy. 1999;19:281–298. doi: 10.1592/phco.19.4.281.30937. [DOI] [PubMed] [Google Scholar]
- 6.Deeks S G, Smith M, Holodniy M, Kahn J O. J Am Med Assoc. 1997;277:145–153. [PubMed] [Google Scholar]
- 7.Tukey R H, Strassburg C P. Annu Rev Pharmacol Toxicol. 2000;40:581–616. doi: 10.1146/annurev.pharmtox.40.1.581. [DOI] [PubMed] [Google Scholar]
- 8.Balani S K, Woolf E J, Hoagland V L, Sturgill M G, Deutsch P, Yeh K C, Lin J H. Drug Metab Dispos. 1996;24:1389–1394. [PubMed] [Google Scholar]
- 9.Lin J H, Chiba M, Balani S K, Chen I W, Kwei G Y S, Vastag K J, Nishime J A. Drug Metab Dispos. 1996;24:1111–1120. [PubMed] [Google Scholar]
- 10.Strassburg C P, Manns M P. J Hepatol. 2000;33:476–479. doi: 10.1016/s0168-8278(00)80285-8. [DOI] [PubMed] [Google Scholar]
- 11.Beutler E, Gelbart T, Demina A. Proc Natl Acad Sci USA. 1998;95:8170–8174. doi: 10.1073/pnas.95.14.8170. [DOI] [PMC free article] [PubMed] [Google Scholar]
- 12.Bosma P J, Roy-Chowdhury J, Bakker C, Gantla S, de Boer A, Oostra B A, Lindhout D, Tytgat G N J, Jansen P L M, Oude Elferink R P J, Roy-Chowdhury N. N Engl J Med. 1995;333:1171–1175. doi: 10.1056/NEJM199511023331802. [DOI] [PubMed] [Google Scholar]
- 13.Raijmakers M T M, Jansen P L M, Steegers E A P, Peters W H M. J Hepatol. 2000;33:348–351. doi: 10.1016/s0168-8278(00)80268-8. [DOI] [PubMed] [Google Scholar]
- 14.Biondi M L, Turri O, Dilillo D, Stival G, Guagnellini E. Clin Chem. 1999;45:897–898. [PubMed] [Google Scholar]
- 15.McDonagh A F, Assisi F. Biochem J. 1972;129:797–800. doi: 10.1042/bj1290797. [DOI] [PMC free article] [PubMed] [Google Scholar]
- 16.Zucker S D, Goessling W, Zeidel M L, Gollan J L. J Biol Chem. 1994;269:19262–19270. [PubMed] [Google Scholar]
- 17.Seppen J, Tada K, Hellwig S, Bakker C T M, Prasad V R, Roy-Chowdhury N, Roy-Chowdhury J, Bosma P J, Oude Elferink R P J. Biochem J. 1996;314:477–483. doi: 10.1042/bj3140477. [DOI] [PMC free article] [PubMed] [Google Scholar]
- 18.Zucker S D. Biochemistry. 2001;40:977–986. doi: 10.1021/bi001277e. [DOI] [PubMed] [Google Scholar]
- 19.Heirwegh K P, Van de Vijver M, Fevery J. Biochem J. 1972;129:605–618. doi: 10.1042/bj1290605. [DOI] [PMC free article] [PubMed] [Google Scholar]
- 20.Seppen J, Bosma P J, Goldhoorn B G, Bakker C T M, Roy-Chowdhury J, Roy-Chowdhury N, Jansen P L M, Oude Elferink R P J. J Clin Invest. 1994;94:2385–2391. doi: 10.1172/JCI117604. [DOI] [PMC free article] [PubMed] [Google Scholar]
- 21.Tam J P. Proc Natl Acad Sci USA. 1988;85:5409–5413. doi: 10.1073/pnas.85.15.5409. [DOI] [PMC free article] [PubMed] [Google Scholar]
- 22.Lin J H, Chen I W, Vastag K J, Ostovic D. Drug Metab Dispos. 1995;23:730–735. [PubMed] [Google Scholar]
- 23.Sampietro M, Lupica L, Perrero L, Comino A, Di Montemuros F M, Cappellini M D, Fiorelli G. Br J Haematol. 1997;99:437–439. doi: 10.1046/j.1365-2141.1997.4113228.x. [DOI] [PubMed] [Google Scholar]
- 24.Hauser S C, Ziurys J C, Gollan J L. J Biol Chem. 1984;259:4527–4533. [PubMed] [Google Scholar]
- 25.Crawford J M, Ransil B J, Narciso J P, Gollan J L. J Biol Chem. 1992;267:16943–16950. [PubMed] [Google Scholar]
- 26.Whitmer D I, Russell P E, Ziurys J C, Gollan J L. J Biol Chem. 1986;261:7170–7177. [PubMed] [Google Scholar]
- 27.Iyanagi T, Watanabe T, Uchiyama Y. J Biol Chem. 1989;264:21302–21307. [PubMed] [Google Scholar]
- 28.Stobie P E, Hansen C T, Hailey J R, Levine R L. Pediatrics. 1991;87:88–93. [PubMed] [Google Scholar]
- 29.Kotal P, Van der Veere C N, Sinaasappel M, Oude Elferink R, Vitek L, Brodanova M, Jansen P L M, Fevery J. Pediatr Res. 1997;42:195–200. doi: 10.1203/00006450-199708000-00011. [DOI] [PubMed] [Google Scholar]
- 30.Monaghan G, Ryan M, Seddon R, Hume R, Burchell B. Lancet. 1996;347:578–581. doi: 10.1016/s0140-6736(96)91273-8. [DOI] [PubMed] [Google Scholar]
- 31.McPhee F, Caldera P S, Bemis G W, McDonagh A F, Kuntz I D, Craik C S. Biochem J. 1996;320:681–686. doi: 10.1042/bj3200681. [DOI] [PMC free article] [PubMed] [Google Scholar]
- 32.Physicians' Desk Reference. (2001) (Medical Economics, Montvale, NJ), pp. 1904–2759.
- 33.Persico M, Persico E, Bakker C T M, Rigato I, Amoroso A, Torella R, Bosma P J, Tiribelli C, Ostrow J D. Hepatology. 2001;33:627–632. doi: 10.1053/jhep.2001.22499. [DOI] [PubMed] [Google Scholar]


