

Abstract
Cardiovascular disease (CVD) may increase depression risk. Risk for future CVD, which can be estimated by the Framingham Risk Score (FRS), and depression risk are both linked to systemic inflammation. Dietary consumption of pro-inflammatory food can be measured using the Dietary Inflammatory Index (DII) score. We examined the potential impact of DII on depression and whether this effect is independent of FRS. We hypothesized that: 1. both FRS and DII would be associated with depression (PHQ-9≥ 10) and 2. associations between DII and depressive symptoms (continuous) would be mediated by FRS. Data were included from adults without CVD who were participants of the 2007–2012 National Health and Nutrition Examination Survey (n=11,624). Using logistic regression, we tested cross-sectional associations of FRS, DII (adjusting for FRS), and joint effects of FRS and DII with depression. Finally, using the Sobel method, we tested whether FRS mediates the relationship between DII and depressive symptoms. Individuals with FRS or DII scores in the top two quartiles had higher odds of depressive symptoms than those in the bottom quartile. The association of DII with depressive symptoms remained after FRS adjustment. The joint effects of elevated DII and FRS were additive. There was no evidence for mediation by FRS between DII and depressive symptoms. Thus, higher DII remained associated with increased odds of depressive symptoms net CVD risk. Collectively, the joint effects of CVD risk and DII indicates that a pro-inflammatory diet could add to risk for depressive symptoms even in those with a high FRS.
Keywords: cardiovascular disease risk, depression, dietary inflammation, systemic inflammation
1. Introduction
Cardiovascular disease (CVD) and depression are highly comorbid and common disorders with large public health impact [1–5]. While it is generally accepted that there is a bidirectional relationship between CVD and depression[6–9], evidence suggests that CVD may confer risk for depressive symptoms [10, 11] and depression [8, 12–14]. Accordingly, preventing CVD may reduce risk for depression.
CVD and depression share genetic and environmental risk factors, and they appear to have a common underlying pathophysiology: inflammation [6, 8, 15, 16]. Increases in inflammation induce depressive symptoms, such as sad mood, fatigue, social-behavioral withdrawal, and anhedonia[17–19]. Inflammation also relates to the initiation and progression of atherosclerosis [20–22], the chief cause of CVD, as well as a major determinant of CVD symptom severity [23] and CVD events [24–27]. Moreover, reductions in inflammatory markers have been associated with decreased risk for developing both CVD and depression[20, 28–31]. However, little work has been done to investigate the simultaneous inter-relationships between inflammation, CVD risk, and depression in large and representative samples of otherwise healthy individuals. In this regard, understanding and identifying preclinical and modifiable risk factors may help to delay disease onset in healthy individuals.
Chronic low-grade systemic inflammation can be caused by many different internal (e.g. atherosclerosis, injury, infection, adiposity) and external factors (e.g. exposure to smoke, environmental toxins, social factors). A major modifiable source of inflammation is habitual dietary consumption of certain foods. Diet can cause either systemic pro-inflammatory or anti-inflammatory states[32]. Diets high in sugar, saturated fat, dairy and fried foods are associated with increased systemic inflammatory markers (C-reactive protein and interleukin-6)[33–35]. Such pro-inflammatory dietary patterns have been traditionally associated with increased CVD risk [36–38]. Whereas diets high in whole grains, fish, fruit, olive oil, and green leafy vegetables and low in red meat and saturated fats, and moderate alcohol intake are associated with decreased systemic inflammation [39, 40]. The latter are thought to be cardio-protective [37, 38, 41, 42]. These dietary patterns could be key contributors to shared pathways linking CVD and depression. Previous work has identified dietary inflammation as a specific modifiable risk factor for depression [43–45]. The current literature is limited, however, insofar as most studies have focused on single nutrients and no studies to our awareness have concurrently accounted for prevailing CVD or CVD risk[43–45] among study participants.
Assessing dietary inflammation is difficult, given that diets are complex and dynamic over time. Moreover, anti-inflammatory and pro-inflammatory foods are often ingested together. For these reasons, Shivappa and colleagues recently developed the Dietary Inflammation Index (DII),[46] which is based on information from over 1900 research articles. This index may thus help to adjudicate whether pro-inflammatory diets relate to increased CVD risk [36–38] and thus the risk for depression or whether the effect of diet on depression is relatively independent of CVD risk. This index may also aid in testing whether CVD risk statistically accounts for (mediates) associations between dietary inflammation and depression, which is still unknown. In these regards, examining dietary inflammation with indices such as the DII may prove important because it may inform safer and less expensive behavioral strategies to decrease inflammation compared to the prolonged use of anti-inflammatory drugs [20, 47, 48]. While the latter may have antidepressant effects[49], their adverse impacts and side effects are nontrivial when chronically used.
Accordingly, the present study extends previous work by examining the relationships between dietary inflammation and depression while accounting for the potential contribution of CVD risk. Our primary hypothesis was that both Framingham Risk Score (FRS, a measure of CVD risk) and DII would be associated with depression. Additionally, because pro-inflammatory diet patterns are associated with CVD risk, we examined whether associations between DII and depression symptoms would be explained by FRS. Our secondary hypothesis was that associations between DII and depressive symptoms would be partially explained by FRS. To these ends, we examined National Health and Nutrition Examination Survey (NHANES) data to determine associations between CVD risk factors, dietary inflammation, and depression. Finally, we examined whether FRS statistically mediates the association between DII score and depression symptomology. To our knowledge, this is the first study to test these hypotheses concerning dietary inflammation in association with both CVD risk and depressive symptomatology simultaneously in a large and representative sample.
2. Methods and materials
2.1 Dataset and study sample
NHANES is a stratified, multistage probability sample of the civilian non-institutionalized US population, conducted by the National Center for Health Statistics and designed to assess the health and nutritional status of the US population through interviews and physical examinations [50]. We used 2007–2012 NHANES data for this analysis. Adults age 18 and older without CVD diagnosis (history of heart attack, angina, stroke, coronary heart disease) and with non-missing data on depression, daily food/nutrient intake, CVD risk factors and other covariates were included in this analysis.
2.2 Measurements
2.2.1 Current Depression
Participants with current depression were identified using the Patient Health Questionnaire (PHQ-9), which reflects the frequency of depressive symptoms during past two weeks [51]. Applying previously used methods, we assigned a score from 0 to 3 to the responses for each of the 9 items as follows: not at all=0, several days=1, more than half the days=2, nearly every day=3. Depression symptomology was defined by the continuous distribution of this variable. Individuals with a summed score ≥ 10 were defined as having current depression [51].
2.2.2 Framingham Risk Score
We estimated CVD risk using the Framingham general CVD risk score[52]. The FRS was calculated using a sex-specific multivariable risk factor algorithm constructed by D’Agostino et al. [52]. This algorithm is used to assess general CVD risk based on sex, age, diabetes, smoking, treated and untreated hypertension, total cholesterol, and high-density lipoprotein [HDL] cholesterol[52]. Prior to calculating FRS, age in years, total cholesterol, HDL, and systolic blood pressure were log transformed. Blood pressure was classified as treated if participant answered yes to either “Are you taking prescription for hypertension?” or “Are you now taking prescribed medicine for high blood pressure?”. Diabetes status was classified as yes if participant answered yes to “Have you ever been told by a doctor or health professional that you have diabetes or sugar diabetes?” Note, the introduction to this set of question excludes those who only report gestational diabetes. The following equation was used to calculate FRS for women: 2.32888(log of age) + 1.20904(log of total cholesterol) + −0.70833(log of HDL) +2.76157(log of systolic blood pressure if untreated) + 2.82263(log of SBP if treated) + 0.52873(current smoker) + 0.69154(diabetic). The following equation was used to calculate FRS for men: 3.06117(log of age) + 1.12370(log of total cholesterol) + −0.932663(log of HDL) + 1.93303(log of systolic blood pressure if untreated) + 1.99881(log of SBP if treated) + 0.65451(current smoker) + 0.57367(diabetic).
2.2.3 Dietary Inflammation
Consistent with previous research[46], twenty-eight micro- and macro-nutrient (food parameter) values derived from the 24-hour dietary recall interview were each assigned a score. The 28 food parameters examined in this study include: total calories; carbohydrates; proteins; fats; grams of alcohol; fiber; cholesterol; saturated, monounsaturated, and polyunsaturated fatty acids; omega-3 and omega-6 polyunsaturated fatty acids; niacin; vitamins A, B1, B2, B6, B12, C, D, and E; iron; magnesium; zinc; selenium; folic acid; [beta]-carotene; and caffeine [53]. As previously described [46], z-scores were calculated for each food parameter and each z-score was then converted to a centered percentile. The centered percentile score for each food parameter was then multiplied by its corresponding inflammatory effect score and summed across all food parameters to create a DII score for each participant. Higher DII values reflect a pro-inflammatory dietary pattern.
2.3 Statistical analyses
We used SAS® software version 9.4 (SAS Institute Inc., Cary, NC) survey procedures to account for non-response differences in the sample and the unequal probability of sample selection. Six-year sampling weights were created by multiplying each of the 2-year sampling weights by one third. Standard error estimates include participants who had missing data on independent or dependent variables. All reported p-values take the complex survey design into account. Characteristics of participants were compared among those with and without depression with the Pearson chi-squared test for categorical variables and t-test for continuous variables. In a subsample of the population, C-reactive protein (CRP) levels were available. In a sensitivity analysis, mean CRP levels in depressed and non-depressed were examined and correlations between FRS and DII score were examined in the subsample with CRP data. Using multivariable logistic regression, we examined associations between:
FRS and current depression
DII score and current depression
DII score and current depression, controlling for FRS
Joint effects of FRS and DII and current depression
Based on previous literature [54–57], all multivariate associations were simultaneously adjusted for race/ethnicity (four categories: non-Hispanic white, non-Hispanic black, Mexican American, other), education (two categories: high school or less, more than a high school), annual household income (four categories: <$20,000, $20,000–$34,999, $35,000–$64,999, ≥$65,000), use of prescription cholesterol-lowering medication (two categories: yes, no), lifetime history of cancer (two categories: yes, no), body mass index (kg/m2, continuous) and physical activity (have rigorous work/recreational activity: yes, no). In models including only DII scores (model 2), we also adjusted for age (continuous), gender, current smoking status (yes/no), taking dietary supplements in past 30 days (two categories: yes/no), and total caloric intake (continuous). Because age, sex and current smoking status were used in the FRS calculation, we did not further adjust for these 3 variables in models using FRS (models 1 and 3). For ease of interpretation, both FRS and DII scores were categorized into quartiles. To assess the joint effect of elevated FRS and DII scores, we further defined people with FRS and DII scores above the 50th percentile (median) as having elevated FRS and DII, respectively. A post-hoc power analysis was completed using G*power [58]. We determined that with our sample size of 11,624 people we have 92.5% power to detect a 10% increase in the odds of depression.
2.3.1 Mediation Testing
Given that the relationship between DII and depression symptomology has been established previously, we tested whether FRS was a potential mediator of this path. Instead of using a binary cutoff for depression, continuous depression symptomology from the PHQ-9 was used for the mediation analysis. Regression analysis was used to test the hypothesis that FRS (M) statistically mediates the cross-sectional relationship between DII scores (X) and depressive symptomology (Y). Associations of DII with FRS were tested as the effect of X on M (X→M), corresponding to the “a Path.” Associations of FRS and depressive symptomology were tested as the effect of M on Y (M→Y), corresponding to the “b Path.” Associations reflecting the total effects of DII scores on depression symptomology without controlling for FRS were tested as the unadjusted effects of X on Y (X→Y) or “c Path.” Associations reflecting the direct effects of DII scores on depression symptomology measures while controlling for FRS were tested as the adjusted effects of X on Y (X→Y) or “c’ Path.” Indirect path effects reflecting the association of DII scores and depression symptomology—as mediated by FRS (X→M→Y)—were tested as the product of Paths a and b (a × b). We performed statistical testing of mediation using a Sobel test [59][60], our sample size would yield higher than 80% power to detect a small mediation effect [61] (α = 0.14, β = 0.14, τ’= 0). All mediation models were adjusted for covariates listed above.
3. Results
3.1. Population characteristics
There were 11,624 people in the analytic sample (Figure 1), of which 8.6% (n=996) were classified as having current depression (PHQ-9 ≥ 10). As shown in Table 1, individuals with current depression were younger, and a greater proportion were female and non-white. Those with current depression were also more likely to have a high school degree or less, earn a household income <$35,000, be less physically active, and exhibit a higher BMI. Finally, those with current depression had a lower dietary energy intake, higher FRS, and a higher DII. Level of CRP, was higher in those with current depression compared with those without current depression. CRP was also significantly correlated with FRS (Pearson correlation coefficient = 0.243; p<0.001) and DII score (Pearson correlation coefficient=0.13, p<0.001) in this subsample.
Figure 1.
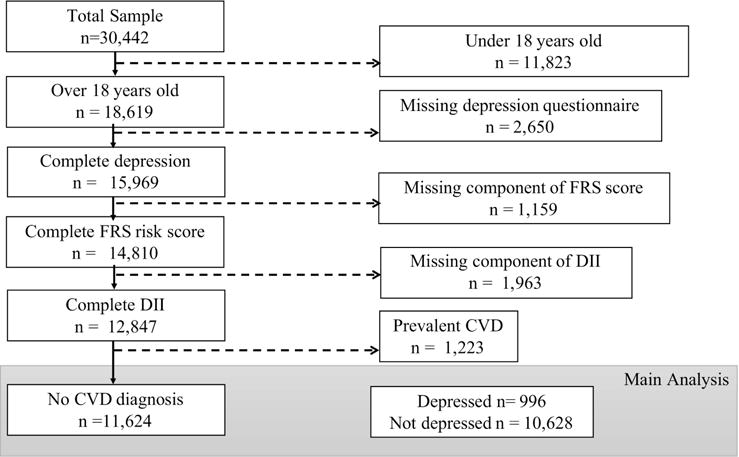
Selection of study sample from 2007–2012 NHANES data for this analysis. Adults age 18 and older without CVD diagnosis (history of heart attack, angina, stroke, CHD) and with non-missing data on depression, daily food/nutrient intake, CVD risk factors and other related covariates were included in this analysis. Participants with extreme values (<500 or ≥ 5000 kcal) of energy intake on the 24-hour dietary recall interview were also excluded from the study. Leaving the final n=11,624 before weighting (weighted n in thousands: total n=159,079; current depression n=11,480; no current depression n= 147,599).
Table 1.
| Characteristics | Current depression n=966 |
No current depression n=10,628 |
p-value |
|---|---|---|---|
| Age | 44.23 (0.36) | 46.05 (0.41) | <.0001 |
|
| |||
| Gender: Male, % (SE) | 34.91 (1.68) | 48.88 (0.45) | <.0001 |
|
| |||
| Race/Ethnicity, % (SE) | <.0001 | ||
| Non-Hispanic White | 63.94 (3.34) | 70.97 (2.01) | |
| Non-Hispanic Black | 13.69 (1.67) | 9.98 (0.95) | |
| Mexican American | 8.59 (1.55) | 8.13 (1.06) | |
| Other Hispanic | 8.89 (1.67) | 4.85 (0.64) | |
| Other race | 4.9 (0.76) | 6.07 (0.54) | |
|
| |||
| Education, % (SE) | <.0001 | ||
| Less than high School | 27.82 (1.65) | 15.48 (0.76) | |
| High school or equivalent | 24.90 (1.90) | 21.88 (0.73) | |
| Some college or AA degree | 32.4 (1.95) | 31.27 (0.81) | |
| College graduate or above | 14.88 (2.09) | 31.36 (1.33) | |
|
| |||
| Annual household income, % (SE) | <.0001 | ||
| Under $20,000 | 39.53 (2.02) | 19.32 (0.61) | |
| $20,000–$34,999 | 26.99 (1.94) | 21.00 (0.65) | |
| $35,000–$64,999 | 17.11 (1.58) | 25.85 (0.84) | |
| $65,000 and above | 16.37 (2.22) | 33.82 (1.45) | |
|
| |||
| Vigorous physical activity, % (SE) | 28.04 (1.84) | 41.97 (1.01) | <.0001 |
|
| |||
| Body mass index (kg/m2) | 30.15 (0.30) | 28.57 (0.11) | <.0001 |
|
| |||
| History of cancer, % (SE) | 9.71 (1.31) | 8.6 (0.47) | 0.4136 |
|
| |||
| Dietary supplement use % (SE) | 42.18 (2.20) | 52.06 (1.04) | <.0001 |
|
| |||
| Total energy intake (kcal) | 2044.57 (43.98) | 2146.17 (10.06) | <.0001 |
|
| |||
| Dietary inflammatory index (DII) | 1.66 (0.079) | 0.92 (0.047) | <.0001 |
|
| |||
| Framingham Risk Score (FRS) | 24.98 (0.07) | 24.54 (0.04) | <.0001 |
|
| |||
| Components of FRS | |||
| Current smoker, % (SE) | 40.66 (2.48) | 18.75 (0.65) | <.0001 |
| Diabetic, % (SE) | 14.98 (1.30) | 8.07 (0.30) | <.0001 |
| Total cholesterol (mg/dL) | 199.89 (1.71) | 197.58 (0.70) | <.0001 |
| HDL cholesterol (mg/dL) | 51.25 (0.59) | 53.16 (0.29) | <.0001 |
| Systolic blood pressure (mm Hg) | 118.99 (0.69) | 120.40 (0.34) | <.0001 |
| Diastolic blood pressure (mm Hg) | 71.12 (0.53) | 70.47 (0.35) | <.0001 |
| Taking blood pressure medication, % (SE) | 29.52 (1.64) | 22.73 (0.85) | 0.0005 |
|
| |||
| CRP (mg/dL)a | 0.56 (0.07) | 0.36 (0.01) | <.0001 |
DII, Dietary inflammatory index; FRS, Framingham Risk Score; CRP, C-Reactive Protein
Values are means ± SD unless otherwise listed
CRP was only collected in a subsample of the population (Current depression n=716; No current depression n=7,421)
3.2. Current Depression by CVD risk quartiles
Compared to those without current depression, those with depression were less likely to be in the lowest quartile of the FRS distribution, with 18.0% [95% CI: 14.6%–21.4%] of the depressed group compared to 27.2% [95% CI: 25.6%–28.7%] of the non-depressed group in quartile 1 (Figure 2). Those with current depression were also more likely to be in the highest quartile of the FRS distribution compared to the non-depressed group, with 30.7% [95% CI: 26.4%–34.9%] compared to 23.3% [95% CI: 21.8%–24.9%] respectively (Figure 2). There was no statistical difference in the proportion of people with and without current depression in quartile 3 or 4 of the FRS distribution.
Figure 2.
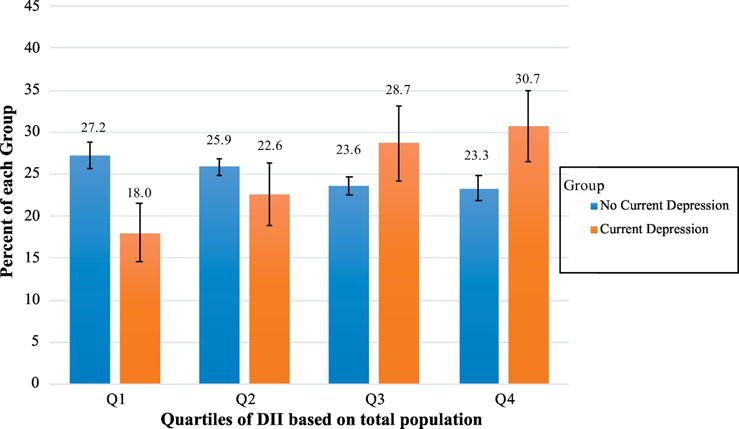
Current Depression by Framingham Risk Score Quartiles.
Displays the percent of those with current depression (orange) and the percent of those without current depression (PHQ-9 ≥ 10) (blue) by each quartile of the FRS. Quartiles of FRS were defined using the total population. Those with current depression were more likely to be in higher quartiles of the FRS (p<0.0001 for trend). 95% Confidence Limits are presented on bars. *p<0.05
3.3. Current Depression by DII quartiles
Compared to those without current depression, those with depression were less likely to be in the lowest two quartiles of the DII score distribution, with 16.0% [95% CI: 13.5%–18.5%] of the depressed group compared to 25.7% [95% CI: 24.1%–27.4%] of the non-depressed group in quartile 1 and 20.2% [95% CI: 16.2%–24.1%] of depressed individuals compared to 25.4% [95% CI: 24.2%–26.5%] of people without current depression in quartile 2 (Figure 3). Those with current depression were also more likely to be in the highest quartile of the DII distribution compared to the non-depressed group, with 36.7% [95% CI: 33.1%–40.4%] compared to 24.1% [95% CI: 22.6%–25.6%] respectively (Figure 3). There was no statistical difference in the proportion of people with and without current depression in quartile 3.
Figure 3.
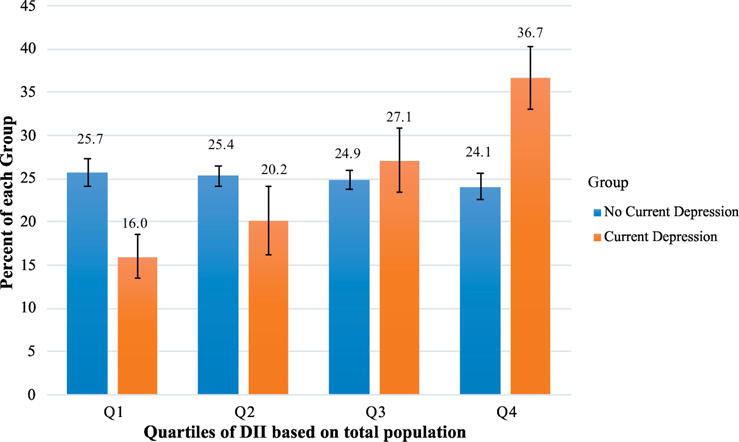
Current depression by Dietary Inflammation Index Score Quartiles.
Displays the percent of those with current depression (orange) and the percent of those without current depression (PHQ-9 ≥ 10) (blue) by each quartile of the DII score. Quartiles of DII were defined using the total population. Those with current depression were more likely to be in higher quartiles of the DII score (p<0.0001 for trend). 95% Confidence Limits are presented on bars. *p<0.05
3.4. Multivariate analysis on the Odds of Current Depression
After adjusting for confounders, the odds of having current depression were increased for those in the 3rd and 4th quartile of the FRS distribution, where those in quartile 3 were 1.70 times [95% CI:1.28–2.53] more likely to have current depression that those in quartile 1 and 1.48 times [95% CI: 1.05–2.07] more for those in quartile 4 when compared to those in the lowest FRS quartile. Those with a FRS score in quartile 2 did not have statistically higher odds of current depression when compared to those in quartile 1 (Figure 4).
Figure 4.
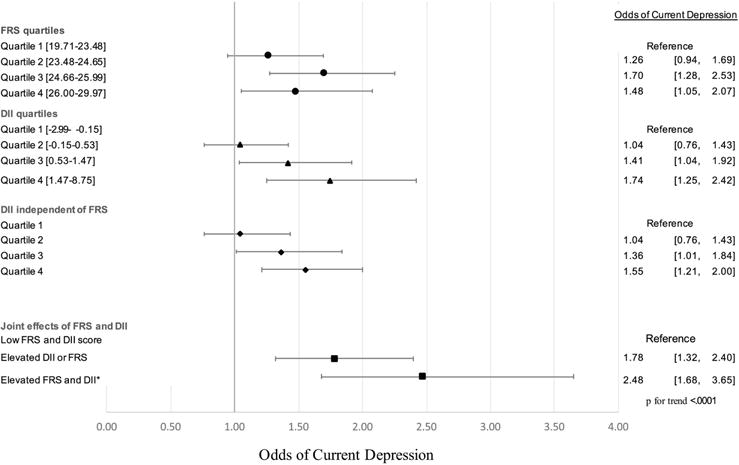
Multivariate Analysis for Odds of Depression.
All multivariate associations were simultaneously adjusted for race/ethnicity, education, annual household income, cholesterol-lowering medication, history of cancer, body mass index, and physical activity. Models of DII score were additionally adjusted for age, gender, current smoker, dietary supplements use, and total caloric intake. Elevated FRS and DII score were defined as above the median score.
Furthermore, those in quartile 3 and quartile 4 of the DII score distribution had significantly higher odds of having current depression when compared to those with DII scores in the lowest quartile. Those in quartile 3 of the DII score distribution had 1.41 times [95% CI: 1.04–1.92] the odds of having current depression, while those in the highest DII quartile had 1.74 times [95% CI:1.25–2.42] the odds of having current depression. People with a DII score within quartile 2 did not have an increased likelihood of current depression when compared to those with a DII score within quartile 1 (Figure 4).
Additional adjustment for the FRS did not attenuate the relationship between DII score and the odds of current depression. People with a DII score in quartile 3 or quartile 4 remained at a significantly higher risk of current depression when compared to those in quartile 1 (figure 4).
We found that having either a DII score or FRS above the median increased the odds of having current depression by 1.78 times [95% CI: 1.32–2.40] when compared to people who have neither score above the median. Moreover, having both a DII score and a FRS above the median more than doubled the odds of having current depression when compared to those with both scores below the median, 2.48 times [95% CI: 1.68–3.65] (figure 4).
3.5. Mediation testing
Results above supported testing FRS as a putative mediator of the cross-sectional relationship between DII scores and depression symptomology. We found a significant total effect of DII scores on depression symptomology (path c = 0.029, p<0.001). FRS was also associated with higher depressive symptomology (Figure 2). Further, DII scores were a significant predictor of FRS (path a=0.165, p<0.001). However, mediation models showed no statistical indirect effect of FRS on depressive symptomology (Figure 5) (indirect effect (a × b) = 0.002, Sobel test statistic: 1.75, p=0.08). The direct effect of DII score on depressive symptomology remained (direct c’ path), reflecting independence from FRS (indirect ab path) (path c’ = 0.027, p=0.006). These findings suggest that DII independently relates to depression symptomology, net the contributions of FRS.
Figure 5.
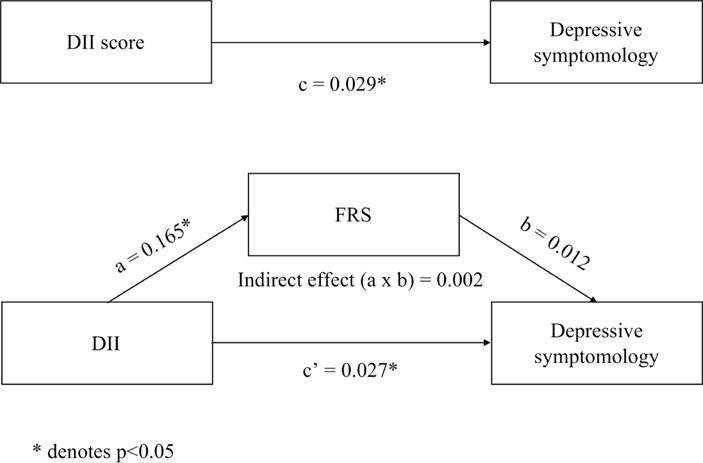
Mediation analysis examining if FRS statistically mediates the relationship between DII and depression symptomology.
Path diagrams for 1) the total effect of the DII on depression symptomology (c) and 2) the indirect effect of DII on depression symptomology through the mediator FRS. * denotes p<0.05
4. Discussion
Consistent with the study hypothesis and prior work, people with elevated CVD risk or elevated dietary inflammation were more likely to have depressive symptoms than those who with lower CVD risk or dietary inflammation. Moreover, the relationship between dietary inflammation and depression was independent of CVD risk, but those with higher CVD risk and dietary inflammation had more than double the risk of meeting thresholds for current depression. The latter novel finding suggests a possible additive effect of each risk factor. Contrary to our secondary hypothesis, we found that CVD risk was not a significant mediator of the relationship between dietary inflammation and depression. Finally, those with both DII and FRS above median values were at more than double the risk of meeting thresholds for current depression, again suggesting a possible additive effect of each risk factor.
By linking both CVD risk and dietary inflammation in the same model, our findings provide new evidence that the relationship between dietary inflammation and depression is not fully explained by CVD risk. However, we found that the relationship between dietary inflammation and depression remained after adjustment for CVD risk, and that CVD risk was not a statistical mediator of this relationship. This may indicate that modifying diet in the context of a behavioral or lifestyle intervention could reduce depressive symptoms—even among those at high risk of CVD. Another possible interpretation is that the association between CVD risk and dietary inflammation is weaker than suspected, and both may independently increase depressive symptoms. The latter possibility would appear to agree with our findings of additive effects in the prediction of depression status. Notwithstanding, more work needs to be done considering multiple dietary components and current health status (e.g. subclinical CVD and mental health) to adjudicate potential mechanisms and develop successful interventions or prevention strategies that take into account current CVD risk status more precisely.
Our findings are consistent with past research showing associations between dietary inflammation and depression [45, 62–64], as well as evidence linking dietary inflammation to higher CVD risk profiles (e.g. metabolic syndrome) [65]. However, we add to this prior work by explicitly accounting for the contributions of CVD risk. Currently, work is being done to determine whether diet could be targeted to prevent depression; however, most work on this topic focuses on single nutrients. Future research should thus examine whether decreasing dietary inflammation in general, rather than changing single nutrients can prevent depression.
In agreement with prior work, we also found that FRS, DII, and depression symptoms were statistically correlated with CRP in a sub-sample of this NHANES population. Two previous studies found increased CRP in people with high depression symptoms in the 2009–2010 NHANES and NHANES III samples [66, 67]. Also, DII score has been recently shown to be related to CRP in a 1999–2002 NHANES sample [68]. Although, CRP is a non-specific marker of systemic inflammation, it was the only inflammatory factor measured in NHANES and CRP is a biomarker that significantly predicts future CVD events [69]. This relationship helps to conceptually link systemic inflammation with DII, CVD risk, and depression symptoms, but it would be preferable to identify other parameters of immune physiology (e.g., cytokines) that may be more specific to the shared pathophysiology between depression and CVD risk.
A limitation of these findings is that the data are cross-sectional and a causal relationship linking DII or CVD risk to depression symptoms cannot be formally established. For example, a person with depression may have a higher DII because depressive symptoms lead them to eat less healthy foods that lead to a higher DII rather than the converse. Future work should also evaluate whether the relationships observed here remain in longitudinal analyses. Additionally, the FRS was developed from a primarily white sample and may not reliably predict CVD risk in other racial groups [52]. Newer versions of the FRS consider both white and African American races [70], but may underestimate risk in other demographic groups [71, 72]. Since the sample included more groups than African Americans and whites [70], the choice was made to use the conventional sex-stratified FRS and adjust for race in statistical modeling. Lastly, a potential limitation is the use of the PHQ-9 to classify current depression. While the PHQ-9 is a valid tool for screening for depression[51], it may underestimate clinical depression. Yet, the PHQ-9 has a sensitivity of 88% and specificity of 88% [73], suggesting that misclassification of depression may be relatively rare.
Although, the cross-sectional nature of NHANES data precludes causal interpretations, the present findings add to an understanding of the complex inter-relationships between CVD risk, dietary inflammation, and depression. Dietary inflammation is a modifiable target for intervention and prevention, and these findings suggest that dietary inflammation is associated with depression symptomology in the general population, independent of CVD risk.
Highlights.
Cardiovascular disease risk and dietary inflammation were associated with depression symptomology in a national sample.
The association between dietary inflammation and depression symptomology was independent of cardiovascular disease risk.
Consuming pro-inflammatory foods may independently add to risk for depression, even among those at high cardiovascular disease risk.
Acknowledgments
We would like to acknowledge the technical assistance provided by both Yona Keich Cloonan and Ya-Hui Yu. This work was supported by the National Heart, Lung, and Blood Institute [grant numbers T32 HL083825, R01 HL089850].
Abbreviations
- CVD
Cardiovascular disease
- FRS
Framingham Risk score
- DII
Dietary Inflammatory Index
Footnotes
Publisher's Disclaimer: This is a PDF file of an unedited manuscript that has been accepted for publication. As a service to our customers we are providing this early version of the manuscript. The manuscript will undergo copyediting, typesetting, and review of the resulting proof before it is published in its final citable form. Please note that during the production process errors may be discovered which could affect the content, and all legal disclaimers that apply to the journal pertain.
The authors have no conflicts of interest to disclose.
References
- 1.Benjamin EJ, Blaha MJ, Chiuve SE, Cushman M, Das SR, Deo R, et al. Heart disease and stroke statistics—2017 update: a report from the American Heart Association. Circulation. 2017;135:e146–e603. doi: 10.1161/CIR.0000000000000485. [DOI] [PMC free article] [PubMed] [Google Scholar]
- 2.Major Depression Among Adults. National Institute of Mental Health; 2015. Web. [Google Scholar]
- 3.World Health Organization (WHO) Cardiovascular disease. WHO; 2012. Global Burden of CVD. online. [Google Scholar]
- 4.Statistics NCfH. Health, United States, 2016: With Chartbook on Long-term Trends in Health. Hyattsville, Maryland: 2017. [PubMed] [Google Scholar]
- 5.World Health Organization. Depression. Fact Sheet. 2017 Online. [Google Scholar]
- 6.Choi NG, Kim J, Marti CN, Chen GJ. Late-life depression and cardiovascular disease burden: examination of reciprocal relationship. The American Journal of Geriatric Psychiatry. 2014;22:1522–9. doi: 10.1016/j.jagp.2014.04.004. [DOI] [PMC free article] [PubMed] [Google Scholar]
- 7.Teismann H, Wersching H, Nagel M, Arolt V, Heindel W, Baune BT, et al. Establishing the bidirectional relationship between depression and subclinical arteriosclerosis–rationale, design, and characteristics of the BiDirect Study. BMC psychiatry. 2014;14:174. doi: 10.1186/1471-244X-14-174. [DOI] [PMC free article] [PubMed] [Google Scholar]
- 8.Halaris A. Inflammation, heart disease, and depression. Current psychiatry reports. 2013;15:1–9. doi: 10.1007/s11920-013-0400-5. [DOI] [PubMed] [Google Scholar]
- 9.Loftis JM, Huckans M, Morasco BJ. Neuroimmune mechanisms of cytokine-induced depression: current theories and novel treatment strategies. Neurobiology of disease. 2010;37:519–33. doi: 10.1016/j.nbd.2009.11.015. [DOI] [PMC free article] [PubMed] [Google Scholar]
- 10.Luijendijk HJ, Tiemeier H, van den Berg JF, Bleumink GS, Hofman A, Stricker BH. Heart Failure and Incident Late-Life Depression. Journal of the American Geriatrics Society. 2010;58:1441–8. doi: 10.1111/j.1532-5415.2010.02921.x. [DOI] [PubMed] [Google Scholar]
- 11.Luijendijk HJ, Stricker BHC, Wieberdink RG, Koudstaal PJ, Hofman A, Breteler MM, et al. Transient ischemic attack and incident depression. Stroke. 2011;42:1857–61. doi: 10.1161/STROKEAHA.110.604405. [DOI] [PubMed] [Google Scholar]
- 12.Park JE, Lee JE. Cardiovascular disease risk factors and depression in Korean women: results from the fourth Korean National Health and Nutrition Examination Survey. Psychiatry research. 2011;190:232–9. doi: 10.1016/j.psychres.2011.05.040. [DOI] [PubMed] [Google Scholar]
- 13.Bradley SM, Rumsfeld JS. Depression and cardiovascular disease. Trends in cardiovascular medicine. 2015;25:614–22. doi: 10.1016/j.tcm.2015.02.002. [DOI] [PubMed] [Google Scholar]
- 14.Liu H, Luiten PG, Eisel UL, Dejongste MJ, Schoemaker RG. Depression after myocardial infarction: TNF-α-induced alterations of the blood–brain barrier and its putative therapeutic implications. Neuroscience & Biobehavioral Reviews. 2013;37:561–72. doi: 10.1016/j.neubiorev.2013.02.004. [DOI] [PubMed] [Google Scholar]
- 15.Alexopoulos GS, Meyers BS, Young RC, Campbell S, Silbersweig D, Charlson M. ‘Vascular depression’hypothesis. Archives of general psychiatry. 1997;54:915. doi: 10.1001/archpsyc.1997.01830220033006. [DOI] [PubMed] [Google Scholar]
- 16.Hare DL, Toukhsati SR, Johansson P, Jaarsma T. Depression and cardiovascular disease: a clinical review. European heart journal. 2013:eht462. doi: 10.1093/eurheartj/eht462. [DOI] [PubMed] [Google Scholar]
- 17.Miller AH, Raison CL. The role of inflammation in depression: from evolutionary imperative to modern treatment target. Nature Reviews Immunology. 2016;16:22–34. doi: 10.1038/nri.2015.5. [DOI] [PMC free article] [PubMed] [Google Scholar]
- 18.Raison CL, Miller AH. Is depression an inflammatory disorder? Current psychiatry reports. 2011;13:467–75. doi: 10.1007/s11920-011-0232-0. [DOI] [PMC free article] [PubMed] [Google Scholar]
- 19.Reichenberg A, Yirmiya R, Schuld A, Kraus T, Haack M, Morag A, et al. Cytokine-associated emotional and cognitive disturbances in humans. Archives of general psychiatry. 2001;58:445–52. doi: 10.1001/archpsyc.58.5.445. [DOI] [PubMed] [Google Scholar]
- 20.Ridker PM, Everett BM, Thuren T, MacFadyen JG, Chang WH, Ballantyne C, et al. Antiinflammatory therapy with canakinumab for atherosclerotic disease. New England Journal of Medicine. 2017;377:1119–31. doi: 10.1056/NEJMoa1707914. [DOI] [PubMed] [Google Scholar]
- 21.Libby P, Ridker PM, Maseri A. Inflammation and atherosclerosis. Circulation. 2002;105:1135–43. doi: 10.1161/hc0902.104353. [DOI] [PubMed] [Google Scholar]
- 22.Libby P. Inflammation in atherosclerosis. Arteriosclerosis, thrombosis, and vascular biology. 2012;32:2045–51. doi: 10.1161/ATVBAHA.108.179705. [DOI] [PMC free article] [PubMed] [Google Scholar]
- 23.Ferrario CM, Strawn WB. Role of the renin-angiotensin-aldosterone system and proinflammatory mediators in cardiovascular disease. The American journal of cardiology. 2006;98:121–8. doi: 10.1016/j.amjcard.2006.01.059. [DOI] [PubMed] [Google Scholar]
- 24.Kuller LH, Tracy RP, Shaten J, Meilahn EN. Relation of C-reactive protein and coronary heart disease in the MRFIT nested case-control study. American journal of epidemiology. 1996;144:537–47. doi: 10.1093/oxfordjournals.aje.a008963. [DOI] [PubMed] [Google Scholar]
- 25.Ridker PM, Cushman M, Stampfer MJ, Tracy RP, Hennekens CH. Inflammation, aspirin, and the risk of cardiovascular disease in apparently healthy men. New England journal of medicine. 1997;336:973–9. doi: 10.1056/NEJM199704033361401. [DOI] [PubMed] [Google Scholar]
- 26.Tracy RP, Lemaitre RN, Psaty BM, Ives DG, Evans RW, Cushman M, et al. Relationship of C-reactive protein to risk of cardiovascular disease in the elderly. Arteriosclerosis, thrombosis, and vascular biology. 1997;17:1121–7. doi: 10.1161/01.atv.17.6.1121. [DOI] [PubMed] [Google Scholar]
- 27.Ridker PM, Hennekens CH, Buring JE, Rifai N. C-reactive protein and other markers of inflammation in the prediction of cardiovascular disease in women. New England Journal of Medicine. 2000;342:836–43. doi: 10.1056/NEJM200003233421202. [DOI] [PubMed] [Google Scholar]
- 28.Ridker PM, Danielson E, Fonseca F, Genest J, Gotto AM, Jr, Kastelein J, et al. Rosuvastatin to prevent vascular events in men and women with elevated C-reactive protein. New England Journal of Medicine. 2008;359:2195. doi: 10.1056/NEJMoa0807646. [DOI] [PubMed] [Google Scholar]
- 29.Raison CL, Capuron L, Miller AH. Cytokines sing the blues: inflammation and the pathogenesis of depression. Trends in immunology. 2006;27:24–31. doi: 10.1016/j.it.2005.11.006. [DOI] [PMC free article] [PubMed] [Google Scholar]
- 30.Howren MB, Lamkin DM, Suls J. Associations of depression with C-reactive protein, IL-1, and IL-6: a meta-analysis. Psychosomatic medicine. 2009;71:171–86. doi: 10.1097/PSY.0b013e3181907c1b. [DOI] [PubMed] [Google Scholar]
- 31.Stafford L, Berk M. The use of statins after a cardiac intervention is associated with reduced risk of subsequent depression: proof of concept for the inflammatory and oxidative hypotheses of depression? The Journal of clinical psychiatry. 2010;72(1):478–1235. doi: 10.4088/JCP.09m05825blu. [DOI] [PubMed] [Google Scholar]
- 32.Cavicchia PP, Steck SE, Hurley TG, Hussey JR, Ma Y, Ockene IS, et al. A new dietary inflammatory index predicts interval changes in serum high-sensitivity C-reactive protein. The Journal of nutrition. 2009;139:2365–72. doi: 10.3945/jn.109.114025. [DOI] [PMC free article] [PubMed] [Google Scholar]
- 33.King DE, Egan BM, Geesey ME. Relation of dietary fat and fiber to elevation of C-reactive protein. The American journal of cardiology. 2003;92:1335–9. doi: 10.1016/j.amjcard.2003.08.020. [DOI] [PubMed] [Google Scholar]
- 34.Esmaillzadeh A, Kimiagar M, Mehrabi Y, Azadbakht L, Hu FB, Willett WC. Dietary patterns and markers of systemic inflammation among Iranian women. The Journal of nutrition. 2007;137:992–8. doi: 10.1093/jn/137.4.992. [DOI] [PubMed] [Google Scholar]
- 35.Aeberli I, Gerber PA, Hochuli M, Kohler S, Haile SR, Gouni-Berthold I, et al. Low to moderate sugar-sweetened beverage consumption impairs glucose and lipid metabolism and promotes inflammation in healthy young men: a randomized controlled trial. The American journal of clinical nutrition. 2011;94:479–85. doi: 10.3945/ajcn.111.013540. [DOI] [PubMed] [Google Scholar]
- 36.Zhong X, Guo L, Zhang L, Li Y, He R, Cheng G. Inflammatory potential of diet and risk of cardiovascular disease or mortality: A meta-analysis. Scientific reports. 2017;7:6367. doi: 10.1038/s41598-017-06455-x. [DOI] [PMC free article] [PubMed] [Google Scholar]
- 37.Delavar MA, Lye M-S, Khor GL, Hassan STBS, Hanachi P. Dietary patterns and the metabolic syndrome in middle aged women, Babol, Iran. Asia Pacific journal of clinical nutrition. 2009;18:285–92. [PubMed] [Google Scholar]
- 38.Verschuren WM. Diet and cardiovascular disease. Current cardiology reports. 2012;14:701–8. doi: 10.1007/s11886-012-0318-2. [DOI] [PubMed] [Google Scholar]
- 39.Esposito K, Marfella R, Ciotola M, Di Palo C, Giugliano F, Giugliano G, et al. Effect of a Mediterranean-style diet on endothelial dysfunction and markers of vascular inflammation in the metabolic syndrome: a randomized trial. Jama. 2004;292:1440–6. doi: 10.1001/jama.292.12.1440. [DOI] [PubMed] [Google Scholar]
- 40.Chrysohoou C, Panagiotakos DB, Pitsavos C, Das UN, Stefanadis C. Adherence to the Mediterranean diet attenuates inflammation and coagulation process in healthy adults: The ATTICA Study. Journal of the American College of Cardiology. 2004;44:152–8. doi: 10.1016/j.jacc.2004.03.039. [DOI] [PubMed] [Google Scholar]
- 41.Sofi F, Macchi C, Abbate R, Gensini GF, Casini A. Mediterranean diet and health status: an updated meta-analysis and a proposal for a literature-based adherence score. Public health nutrition. 2014;17:2769–82. doi: 10.1017/S1368980013003169. [DOI] [PMC free article] [PubMed] [Google Scholar]
- 42.Estruch R, Ros E, Salas-Salvadó J, Covas M-I, Corella D, Arós F, et al. Primary prevention of cardiovascular disease with a Mediterranean diet. New England Journal of Medicine. 2013;368:1279–90. doi: 10.1056/NEJMc1806491. [DOI] [PubMed] [Google Scholar]
- 43.Sanchez-Villegas A, Martínez-González MA. Diet, a new target to prevent depression? BMC medicine. 2013;11:3. doi: 10.1186/1741-7015-11-3. [DOI] [PMC free article] [PubMed] [Google Scholar]
- 44.Gangwisch JE, Hale L, Garcia L, Malaspina D, Opler MG, Payne ME, et al. High glycemic index diet as a risk factor for depression: analyses from the Women’s Health Initiative. The American journal of clinical nutrition. 2015:ajcn103846. doi: 10.3945/ajcn.114.103846. [DOI] [PMC free article] [PubMed] [Google Scholar]
- 45.Lucas M, Chocano-Bedoya P, Shulze MB, Mirzaei F, O’Reilly ÉJ, Okereke OI, et al. Inflammatory dietary pattern and risk of depression among women. Brain, behavior, and immunity. 2014;36:46–53. doi: 10.1016/j.bbi.2013.09.014. [DOI] [PMC free article] [PubMed] [Google Scholar]
- 46.Shivappa N, Steck SE, Hurley TG, Hussey JR, Hébert JR. Designing and developing a literature-derived, population-based dietary inflammatory index. Public health nutrition. 2014;17:1689–96. doi: 10.1017/S1368980013002115. [DOI] [PMC free article] [PubMed] [Google Scholar]
- 47.Rao CV, Rivenson A, Simi B, Reddy BS. Chemoprevention of colon carcinogenesis by dietary curcumin, a naturally occurring plant phenolic compound. Cancer research. 1995;55:259–66. [PubMed] [Google Scholar]
- 48.Langman MJ, Jensen DM, Watson DJ, Harper SE, Zhao P-L, Quan H, et al. Adverse upper gastrointestinal effects of rofecoxib compared with NSAIDs. Jama. 1999;282:1929–33. doi: 10.1001/jama.282.20.1929. [DOI] [PubMed] [Google Scholar]
- 49.Kappelmann N, Lewis G, Dantzer R, Jones PB, Khandaker GM. Antidepressant activity of anti-cytokine treatment: a systematic review and meta-analysis of clinical trials of chronic inflammatory conditions. Molecular psychiatry. 2016 doi: 10.1038/mp.2016.167. [DOI] [PMC free article] [PubMed] [Google Scholar]
- 50.Ezzati T, Massey J, Waksberg J, Chu A, Maurer K. (Vital and health statistics Series 2, Data evaluation and methods research).Sample design: Third National Health and Nutrition Examination Survey. 1992:1–35. [PubMed] [Google Scholar]
- 51.Kroenke K, Spitzer RL. The PHQ-9: a new depression diagnostic and severity measure. Psychiatric annals. 2002;32:509–15. [Google Scholar]
- 52.D’Agostino RB, Vasan RS, Pencina MJ, Wolf PA, Cobain M, Massaro JM, et al. General cardiovascular risk profile for use in primary care. Circulation. 2008;117:743–53. doi: 10.1161/CIRCULATIONAHA.107.699579. [DOI] [PubMed] [Google Scholar]
- 53.Deng FE, Shivappa N, Tang Y, Mann JR, Hebert JR. Association between diet-related inflammation, all-cause, all-cancer, and cardiovascular disease mortality, with special focus on prediabetics: findings from NHANES III. European journal of nutrition. 2016:1–9. doi: 10.1007/s00394-016-1158-4. [DOI] [PubMed] [Google Scholar]
- 54.Stansfeld SA, Clark C, Rodgers B, Caldwell T, Power C. Repeated exposure to socioeconomic disadvantage and health selection as life course pathways to mid-life depressive and anxiety disorders. Social psychiatry and psychiatric epidemiology. 2011;46:549–58. doi: 10.1007/s00127-010-0221-3. [DOI] [PMC free article] [PubMed] [Google Scholar]
- 55.Parsaik AK, Singh B, Hassan MM, Singh K, Mascarenhas SS, Williams MD, et al. Statins use and risk of depression: a systematic review and meta-analysis. Journal of affective disorders. 2014;160:62–7. doi: 10.1016/j.jad.2013.11.026. [DOI] [PubMed] [Google Scholar]
- 56.Coussens LM, Werb Z. Inflammation and cancer. Nature. 2002;420:860–7. doi: 10.1038/nature01322. [DOI] [PMC free article] [PubMed] [Google Scholar]
- 57.Rebar AL, Stanton R, Geard D, Short C, Duncan MJ, Vandelanotte C. A meta-meta-analysis of the effect of physical activity on depression and anxiety in non-clinical adult populations. Health psychology review. 2015;9:366–78. doi: 10.1080/17437199.2015.1022901. [DOI] [PubMed] [Google Scholar]
- 58.Faul F, Erdfelder E, Lang A-G, Buchner A. G* Power 3: A flexible statistical power analysis program for the social, behavioral, and biomedical sciences. Behavior research methods. 2007;39:175–91. doi: 10.3758/bf03193146. [DOI] [PubMed] [Google Scholar]
- 59.Sobel ME. Asymptotic confidence intervals for indirect effects in structural equation models. Sociological methodology. 1982;13:290–312. [Google Scholar]
- 60.Baron RM, Kenny DA. The moderator–mediator variable distinction in social psychological research: Conceptual, strategic, and statistical considerations. Journal of personality and social psychology. 1986;51:1173. doi: 10.1037//0022-3514.51.6.1173. [DOI] [PubMed] [Google Scholar]
- 61.Fritz MS, MacKinnon DP. Required sample size to detect the mediated effect. Psychological science. 2007;18:233–9. doi: 10.1111/j.1467-9280.2007.01882.x. [DOI] [PMC free article] [PubMed] [Google Scholar]
- 62.Bergmans RS, Malecki KM. The association of dietary inflammatory potential with depression and mental well-being among US adults. Preventive Medicine. 2017 doi: 10.1016/j.ypmed.2017.03.016. [DOI] [PMC free article] [PubMed] [Google Scholar]
- 63.Shivappa N, Schoenaker DA, Hebert JR, Mishra GD. Association between inflammatory potential of diet and risk of depression in middle-aged women: The Australian longitudinal study on women’s health. British Journal of Nutrition. 2016;116:1077–86. doi: 10.1017/S0007114516002853. [DOI] [PubMed] [Google Scholar]
- 64.Sánchez-Villegas A, Ruíz-Canela M, de la Fuente-Arrillaga C, Gea A, Shivappa N, Hébert JR, et al. Dietary inflammatory index, cardiometabolic conditions and depression in the Seguimiento Universidad de Navarra cohort study. British Journal of Nutrition. 2015;114:1471–9. doi: 10.1017/S0007114515003074. [DOI] [PubMed] [Google Scholar]
- 65.Wirth M, Burch J, Shivappa N, Violanti JM, Burchfiel CM, Fekedulegn D, et al. Association of a Dietary Inflammatory Index with Inflammatory Indices and the Metabolic Syndrome among Police Officers. Journal of occupational and environmental medicine/American College of Occupational and Environmental Medicine. 2014;56:986. doi: 10.1097/JOM.0000000000000213. [DOI] [PMC free article] [PubMed] [Google Scholar]
- 66.Ford DE, Erlinger TP. Depression and C-reactive protein in US adults: data from the Third National Health and Nutrition Examination Survey. Archives of internal medicine. 2004;164:1010–4. doi: 10.1001/archinte.164.9.1010. [DOI] [PubMed] [Google Scholar]
- 67.Rethorst CD, Bernstein I, Trivedi MH. Inflammation, obesity and metabolic syndrome in depression: Analysis of the 2009–2010 National Health and Nutrition Survey (NHANES) The Journal of clinical psychiatry. 2014;75:e1428. doi: 10.4088/JCP.14m09009. [DOI] [PMC free article] [PubMed] [Google Scholar]
- 68.Shivappa N, Wirth MD, Hurley TG, Hébert JR. Association between the dietary inflammatory index (DII) and telomere length and C-reactive protein from the National Health and Nutrition Examination Survey - 1999-2002. Molecular nutrition & food research. 2017 doi: 10.1002/mnfr.201600630. [DOI] [PMC free article] [PubMed] [Google Scholar]
- 69.Ridker PM. Clinical application of C-reactive protein for cardiovascular disease detection and prevention. Circulation. 2003;107:363–9. doi: 10.1161/01.cir.0000053730.47739.3c. [DOI] [PubMed] [Google Scholar]
- 70.Goff DC, Lloyd-Jones DM, Bennett G, Coady S, D’Agostino RB, Gibbons R, et al. 2013 ACC/AHA guideline on the assessment of cardiovascular risk. Circulation. 2014;129:S49–S73. doi: 10.1161/01.cir.0000437741.48606.98. [DOI] [PubMed] [Google Scholar]
- 71.Kanjilal S, Rao V, Mukherjee M, Natesha B, Renuka K, Sibi K, et al. Application of cardiovascular disease risk prediction models and the relevance of novel biomarkers to risk stratification in Asian Indians. Vascular health and risk management. 2008;4:199. doi: 10.2147/vhrm.2008.04.01.199. [DOI] [PMC free article] [PubMed] [Google Scholar]
- 72.Garg N, Muduli SK, Kapoor A, Tewari S, Kumar S, Khanna R, et al. Comparison of different cardiovascular risk score calculators for cardiovascular risk prediction and guideline recommended statin uses. Indian Heart Journal. 2017 doi: 10.1016/j.ihj.2017.01.015. [DOI] [PMC free article] [PubMed] [Google Scholar]
- 73.Kroenke K, Spitzer R, Williams J. The PHQ-9 validity of a brief depression severity measure. Non-US Gov’t. 2001 doi: 10.1046/j.1525-1497.2001.016009606.x. [DOI] [PMC free article] [PubMed] [Google Scholar]