Short abstract
Objective
To investigate the effects of Cushing’s disease (CD) and adrenal-dependent Cushing’s syndrome (ACS) on bone mineral density (BMD) and bone metabolism.
Methods
Data were retrospectively collected for 55 patients with hypercortisolism (CD, n = 34; ACS n = 21) from January 1997 to June 2014. BMD was examined in all patients, and bone turnover markers were tested in some patients. Healthy controls (n = 18) were also recruited.
Results
The lumbar spine and femoral neck BMD were significantly lower in the ACS and CD groups than in the control group. Lumbar BMD was significantly lower in the ACS than CD group. The collagen breakdown product (CTX) concentrations were significantly higher while the osteocalcin and procollagen type I N-terminal propeptide (PINP) concentrations were significantly lower in the ACS and CD groups than in the control group. The PINP concentration was significantly lower while the CTX concentration was significantly higher in the ACS than CD group. In the CD group only, lumbar BMD and serum adrenocorticotropic hormone had a significant positive correlation.
Conclusions
Bone turnover markers indicated suppressed osteoblast and enhanced osteoclast activities. PINP and CTX changes might indicate bone mass deterioration. Adrenocorticotropic hormone might be protective for lumbar BMD in patients with CD.
Keywords: Bone mineral density, bone turnover markers, hypercortisolism, osteoporosis, Cushing’s disease, adrenal-dependent Cushing’s syndrome
Introduction
Hypercortisolism is a syndrome characterized by chronically high cortisol levels. It is classified as either adrenocorticotropic hormone (ACTH)-dependent or ACTH-independent (i.e., adrenal tumor) based on the underlying cause. Osteoporosis has been recognized as a serious consequence of endogenous hypercortisolism since the first description by Harvey Cushing in 1932.1 The reported prevalence of osteoporosis due to excess endogenous cortisol ranges from 50% to 59%.2,3 Pathological fractures, particularly in the vertebral spine, can be the presenting manifestation of hypercortisolism.4,5 The proposed mechanism by which excess glucocorticoid leads to the development of secondary osteoporosis is multifactorial. Early identification of the characteristic changes in bone mass with hypercortisolism assists with early identification of bone mass loss and timely treatment, thus reducing the occurrence of adverse events such as fractures.
The current study was performed to compare the characteristics of the bone mineral density (BMD) and bone metabolism in patients with ACTH-dependent or ACTH-independent hypercortisolism versus healthy controls and to analyze the effects of ACTH on BMD in patients with adrenal-dependent Cushing’s syndrome (ACS) and Cushing’s disease (CD).
Materials and methods
Patients
We retrospectively analyzed data for 78 patients with hypercortisolism, including 52 patients with CD and 26 patients with ACS. All patients had signs and symptoms of overt hypercortisolism.
Patients were excluded from the study if they had subclinical Cushing’s syndrome, forms of hypercortisolism other than CD and ACS (e.g., ectopic ACTH syndrome, adrenocortical hyperplasia, or adrenocortical carcinoma), recurring diseases, or comorbid diabetes mellitus prior to admission. Finally, 55 patients (21 with ACS and 34 with CD) were included in this study. Data for 18 healthy controls were collected from the physical examination center of the Tianjin Medical University General Hospital.
Cushing’s syndrome was diagnosed based on clinical features and the following endocrine work-up: measurement of serum cortisol and ACTH at 08:00, 16:00, and 24:00; measurement of 24-h urinary free cortisol (UFC) excretion, evaluated as the mean value of three different samples collected on consecutive days; an overnight low-dose dexamethasone suppression test (2 mg/d administered orally, with measurement of urine cortisol the following day) and overnight high-dose dexamethasone suppression test (8 mg/d administered orally, with measurement of urine cortisol the following day); and findings of a space-occupying lesion on adrenal computed tomography or pituitary magnetic resonance imaging. All healthy controls were confirmed healthy based on their clinical history, physical examination findings, and routine laboratory test results. The patients and controls were matched in terms of sex, age, body mass index (BMI), ethnicity, and geographic origin.
The exclusion criteria for all patients and healthy controls in this study were pregnancy, alcoholism, smoking, chronic disease, and previous or current exposure to drugs affecting the pituitary-adrenal axis or bone metabolism.
Biochemical evaluation
In all patients and healthy controls, blood samples were obtained in a fasting state, and calcium, phosphorus, alanine aminotransferase, creatinine, total cholesterol, and triglycerides in the plasma samples was measured using standard enzymatic techniques (Hitachi 7600 Automatic Biochemistry Analyzer; Hitachi, Tokyo, Japan). Serum thyroid hormones (free triiodothyronine, free thyroxine, and thyroid stimulating hormone), gonadal hormones (testosterone and estrogen), adrenal cortex function (serum adrenocorticotropic hormone and cortisol), parathyroid hormone (PTH), and 24-h excretion of UFC were measured using chemiluminescent methods (Siemens Healthcare Diagnostics Inc., Erlangen, Germany). The 25(OH)D3 level in the plasma samples was measured using an enzyme-linked immunosorbent assay (Immunodiagnostic Systems Ltd., The Boldons, UK). Serum bone turnover markers (serum osteocalcin [OC], procollagen type I N-terminal propeptide [PINP], and serum collagen type I cross-linked C-telopeptide [CTX]) were measured using a chemiluminescent method (Roche Diagnostics Ltd., Mannheim, Germany). Urinary calcium was measured using a colorimetric method (Roche Diagnostics Ltd.).
This study was conducted in accordance with the principles of good clinical practice and the Declaration of Helsinki and was approved by the ethics committee of the Tianjin Medical University General Hospital. All participants provided written informed consent.
Assessment of BMD
Bone densitometry was performed by dual-energy X-ray absorptiometry using a Prodigy-GE densitometer (GE Healthcare, Chicago, IL, USA). The coefficient of variation of the BMD measurements in our laboratory was <0.1%. Data were analyzed using absolute BMD values (g/cm2).
Statistical analysis
SPSS v19.0 (IBM Corp., Armonk, NY) was used for data analysis. All data were tested for a normal distribution. Normally distributed data are reported as mean ± standard deviation. Statistical analyses were performed using analysis of variance for multiple-group comparisons among the ACS, CD, and control (N) groups, and the Student–Newman–Keuls test was used for comparisons between two groups. The chi-square test was used for count data. Correlations were tested using Pearson’s test. Linear regression analysis was used for further correlation testing. Binary logistic regression analysis was used to compare the correlations of categorical variables. Statistical significance was set at P < 0.05.
Results
Patient characteristics
This study included 21 patients with ACS, 34 patients with CD, and 18 healthy controls. Age, BMI, estimated disease duration, renal function, blood glucose concentrations, blood lipid concentrations, and thyroid hormone concentrations were not significantly different among the ACS, CD, and N groups (Tables 1 and 2). The ACS, CD, and N groups contained one, two, and one postmenopausal women and two, nine, and five men, respectively. The numbers of postmenopausal vs. non-postmenopausal women and men vs. women were not significantly different among the three groups as shown by the chi-square test. The patients with hypercortisolism were divided into two groups according to their gonadal status (those with hypogonadism and those with normal gonads). Sex, BMD, and age were taken as independent variables. Binary logistic regression analysis showed that lumbar BMD and gonad function had no correlation (β = 7.778).
Table 1.
Demographic characteristics of patients with hypercortisolism and healthy controls
| Characteristics | ACS(n = 21) | CD(n = 34) | N(n = 18) | P |
|---|---|---|---|---|
| Sex, M/F | 2/19 | 9/25 | 5/13 | 0.18 |
| Age, years | 35.00 ± 11.53 | 36.63 ± 11.22 | 38.36 ± 14.19 | 0.74 |
| Disease duration, years | 1.30 ± 0.48 | 2.41 ± 0.82 | – | 0.09 |
| BMI, kg/m2 | 24.74 ± 3.05 | 26.50 ± 3.85 | 26.42 ± 7.91 | 0.36 |
ACS, adrenal-dependent Cushing’s syndrome; CD, Cushing’s disease; N, healthy controls; M, male; F, female; BMI, body mass index
Data are presented as mean ± standard deviation.
Table 2.
Clinical data for patients with hypercortisolism and healthy controls
| ACS (n = 21) | CD (n = 34) | N (n = 18) | P | |
|---|---|---|---|---|
| Glu (mmol/L) | 5.53 ± 1.2 | 5.10 ± 0.98 | 4.54 ± 0.60 | 0.069 |
| Cr (µmol/L) | 55.19 ± 11.87 | 58.35 ± 11.31 | 65.33 ± 10.63 | 0.093 |
| TC (mmol/L) | 5.22 ± 1.06 | 5.40 ± 0.86 | 4.70 ± 0.58 | 0.149 |
| TG (mmol/L) | 1.48 ± 0.70 | 1.52 ± 0.68 | 1.72 ± 0.72 | 0.680 |
| FT3 (pmol/L) | 3.91 ± 0.38 | 3.99 ± 0.60 | 4.34 ± 0.60 | 0.162 |
| FT4 (pmol/L) | 14.36 ± 2.66 | 14.27 ± 1.64 | 16.07 ± 2.13 | 0.099 |
| TSH (µIU/mL) | 0.94 ± 0.48 | 0.91 ± 0.44 | 1.30 ± 0.56 | 0.117 |
ACS, adrenal-dependent Cushing’s syndrome; CD, Cushing’s disease; N, healthy controls; Glu, glucose; Cr, creatinine; TC, total cholesterol; TG, triglycerides; FT3, free thyroxine (T3); FT4, free thyroxine (T4); TSH, thyroid-stimulating hormone
Data are presented as mean ± standard deviation.
Comparison of adrenal cortex function
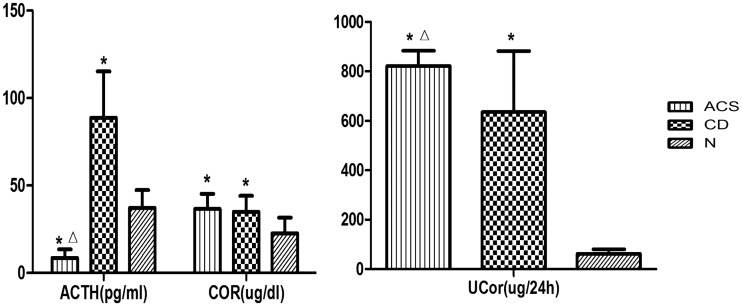
The serum ACTH concentration, serum and urinary cortisol concentrations, and 24-h UFC concentration were significantly different among the three groups. The serum ACTH concentration was significantly lower in the ACS group than in the CD and N groups (P < 0.05). The serum and urinary cortisol concentrations were significantly higher in the ACS and CD groups than in the N group (P < 0.05); however, the 24-h UFC concentration in the ACS group was significantly higher than that in the CD group (P < 0.05) (Figure 1, Table 3).
Figure 1.
Comparison of adrenal cortex function between the adrenal-dependent Cushing’s syndrome (ACS), Cushing’s disease (CD), and healthy control (N) groups
Values are expressed as mean ± standard deviation.
*P < 0.05 compared with the N group; ΔP < 0.05 compared with the CD group
ACTH, adrenocorticotropic hormone; Cor, serum cortisol; UCor, urinary cortisol
Table 3.
Data for comparison of adrenal cortex function, bone mineral density, and bone turnover markers
| ACS (n = 21) | CD (n = 34) | N (n = 18) | P | |
|---|---|---|---|---|
| ACTH (pg/ml) | 8.56 ± 4.89*Δ | 88.63 ± 26.61* | 37.23 ± 10.09 | 0.000 |
| Serum Cor (µg/dl) | 36.52 ± 8.69* | 34.91 ± 9.12* | 22.51 ± 9.01 | 0.001 |
| UCor (µg/24 h) | 822.10 ± 61.96*Δ | 635.31 ± 247.82* | 62.41 ± 18.31 | 0.000 |
| Lumbar BMD (g/cm2) | 0.98 ± 0.14*Δ | 1.07 ± 0.13* | 1.20 ± 0.16 | 0.001 |
| Femoral BMD (g/cm2) | 0.83 ± 0.15* | 0.90 ± 0.13* | 1.06 ± 0.26 | 0.005 |
| Whole-body BMD (g/cm2) | 1.00 ± 0.10* | 1.05 ± 0.13* | 1.15 ± 0.15 | 0.018 |
| Serum Ca (mmol/L) | 2.25 ± 0.11* | 2.22 ± 0.11* | 2.34 ± 0.08 | 0.015 |
| Corrected serum Ca (mmol/L) | 2.21 ± 0.12 | 2.20 ± 0.09 | 2.29 ± 0.19 | 0.000 |
| Serum P (mmol/L) | 1.05 ± 0.12* | 1.11 ± 0.17* | 1.38 ± 0.21 | 0.000 |
| UCa (mg/24 h) | 256.03 ± 112.17 | 244.11 ± 92.85 | 211.82 ± 62.6 | 0.537 |
| ALP (U/L) | 81.90 ± 24.10 | 74.18 ± 22.88 | 71.67 ± 12.24 | 0.389 |
| PTH (pmol/L) | 7.10 ± 2.84* | 5.20 ± 2.05 | 3.83 ± 1.58 | 0.012 |
| 25(OH)D3 (nmol/L) | 34.14 ± 12.71 | 32.22 ± 13.06 | 27.81 ± 8.65 | 0.578 |
Data are presented as mean ± standard deviation.
P < 0.05 compared with the N group; ΔP < 0.05 compared with the CD group
Comparison of BMD
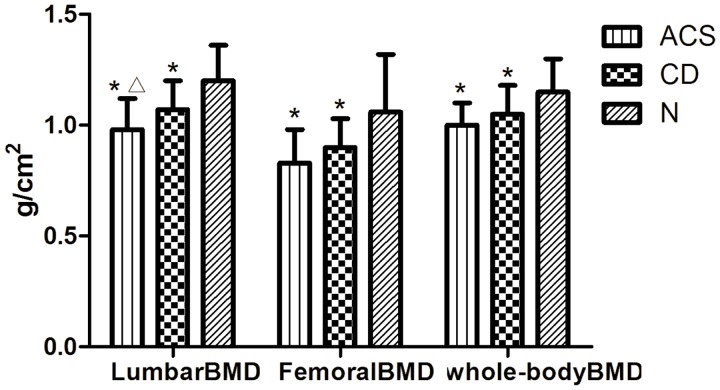
Lumbar, femoral, and whole-body BMDs were significantly lower in the CD and ACS groups than in the N group (P < 0.05). Lumbar BMD was significantly lower in the ACS group than in the CD group (P < 0.05) (Figure 2, Table 3).
Figure 2.
Comparison of bone mineral density (BMD) between the adrenal-dependent Cushing’s syndrome (ACS), Cushing’s disease (CD), and healthy control (N) groups
Values are expressed as mean ± standard deviation.
*P < 0.05 compared with the N group; ΔP < 0.05 compared with the CD group
Comparison of bone turnover markers
Bone turnover markers were measured for 10 patients in the ACS group, 11 patients in the CD group, and 9 patients in the N group.
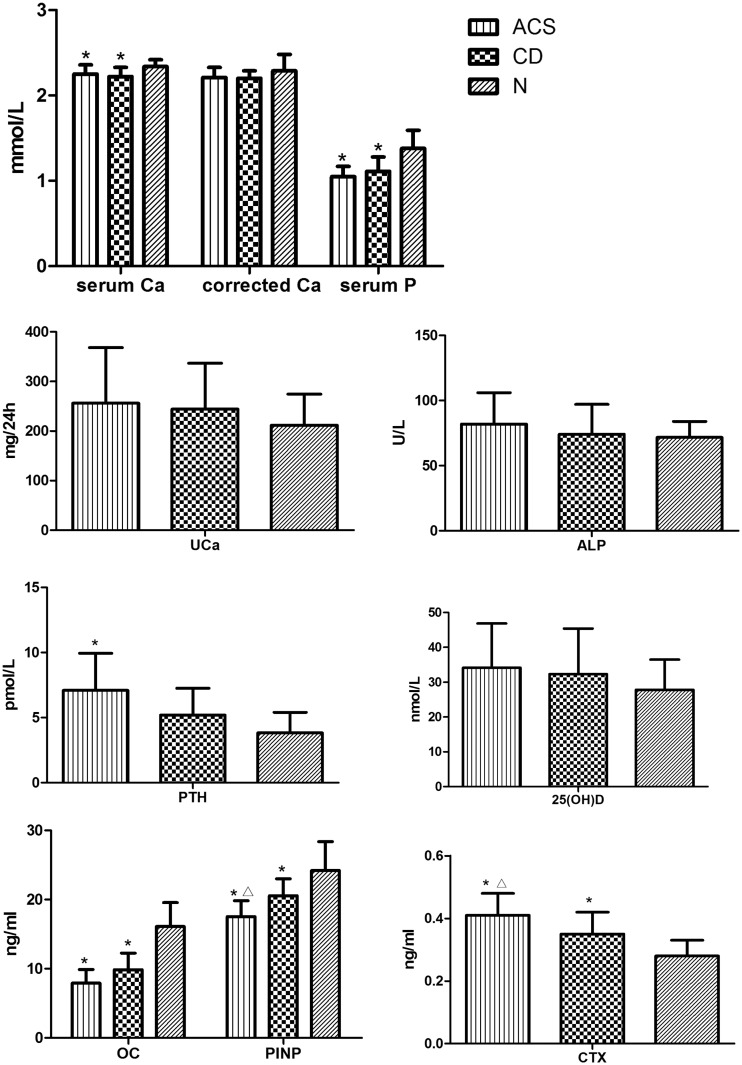
The serum calcium and phosphorus concentrations were significantly lower in the ACS and CD groups than in the N group (P < 0.05). However, the serum calcium corrected by serum albumin was not significantly different among the groups. No significant difference was observed in the serum alkaline phosphatase (ALP) or urinary calcium concentration between any of the groups. Additionally, no significant difference was observed in the serum calcium or phosphorus concentration between the ACS and CD groups (Figure 3, Table 4).
Figure 3.
Comparison of bone turnover markers between the adrenal-dependent Cushing’s syndrome (ACS), Cushing’s disease (CD), and healthy control (N) groups
Values are expressed as mean ± standard deviation.
*P < 0.05 compared with the N group; ΔP < 0.05 compared with the CD group
Ca, calcium; P, phosphorus; UCa, urinary calcium; ALP, alkaline phosphatase; PTH, parathyroid hormone; OC, osteocalcin; PINP, procollagen type I N-terminal propeptide; CTX, collagen type I cross-linked C-telopeptide
Table 4.
Data for comparison of bone turnover markers
| ACS (n = 10) | CD (n = 11) | N (n = 9) | P | |
|---|---|---|---|---|
| OC (ng/ml) | 7.92 ± 1.97* | 9.86 ± 2.40* | 16.12 ± 3.45 | 0.000 |
| PINP (ng/ml) | 17.53 ± 2.30*Δ | 20.56 ± 2.44* | 24.12 ± 4.17 | 0.001 |
| CTX (ng/ml) | 0.41 ± 0.07*Δ | 0.35 ± 0.07* | 0.28 ± 0.05 | 0.001 |
Data are presented as mean ± standard deviation.
P < 0.05 compared with the N group; ΔP < 0.05 compared with the CD group
The serum OC and PINP concentrations in the ACS and CD groups were significantly lower than those in the N group (P < 0.05). The serum CTX concentrations in the ACS and CD groups were significantly higher than those in the N group (P < 0.05). The CTX concentrations were significantly higher and the PINP concentrations were significantly lower in the ACS group than CD group. No significant differences were observed in the serum 25(OH)D3 concentration among the groups. The serum PTH concentration in the ACS group was significantly higher than that in the CD and N groups (P < 0.05).
Correlations with BMD
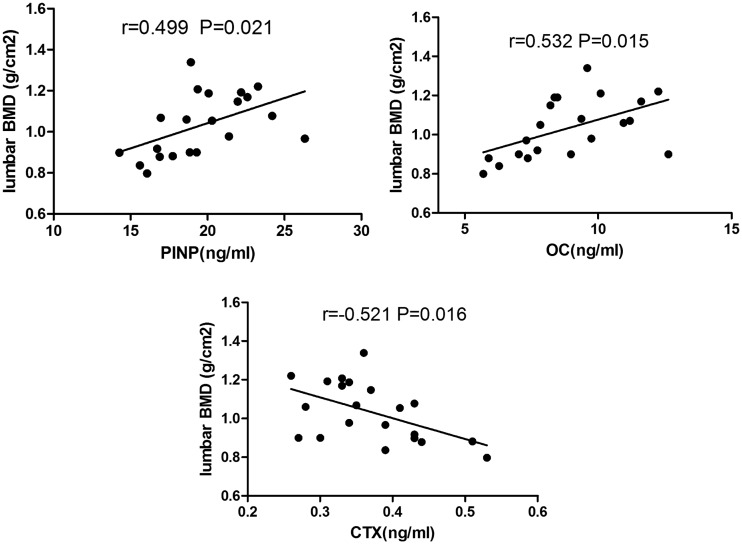
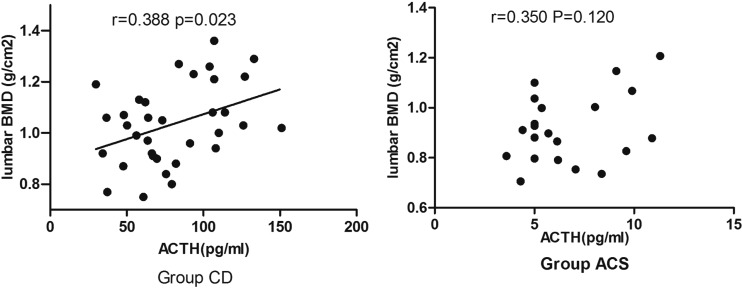
In the patients with hypercortisolism, Pearson analysis showed a significant positive correlation between BMD and the PINP concentration (P < 0.05), a significant positive correlation between BMD and the OC concentration (P < 0.05), and a significant negative correlation between BMD and the CTX concentration (P < 0.05) (Figure 4). We found no significant correlations between BMD and the following parameters: the PTH, urinary calcium, 25(OH)D3, urinary cortisol, and serum cortisol concentrations (data not shown). In the CD group but not in the ACS group, there was a significant positive correlation between lumbar BMD and the serum ACTH concentration (Figure 5). No significant correlations were found for femoral or whole-body BMD (data not shown). Further linear regression analysis was performed in the CD group, in which age, sex, BMI, disease course, serum ACTH, and serum cortisol were taken as independent variables. The results showed that lumbar BMD and serum ACTH had a linear correlation (β = 0.524, P = 0.003). However, when more independent variables were added (e.g. free triiodothyroxine, testosterone, estradiol, and serum calcium), the results showed that serum cortisol was associated with lumbar BMD (β = −0.723, P = 0.033). The small sample size may have resulted in insufficient statistical power.
Figure 4.
Correlation between bone turnover markers and lumbar bone mineral density (BMD) in patients with hypercortisolism
OC, osteocalcin; PINP, procollagen type I N-terminal propeptide; CTX, collagen type I cross-linked C-telopeptide
Figure 5.
Correlation between adrenocorticotropic hormone (ACTH) concentrations and lumbar bone mineral density (BMD) in patients with adrenal-dependent Cushing’s syndrome (ACS) or Cushing’s disease (CD)
Discussion
In the present study, the serum cortisol and urinary cortisol concentrations were significantly higher in patients with ACS and CD than in healthy controls. In the patients with hypercortisolism, the serum ACTH concentration was significantly higher in patients with CD than in those with ACS, while the urinary cortisol concentration was significantly higher in patients with ACS than in those with CD; however, the serum cortisol concentration was similar between the ACS and CD groups. The urinary cortisol concentration in the ACS group was significantly higher than that in the CD group, indicating that adrenal adenoma has a strong effect.
Despite the different numbers of men and postmenopausal women among the three groups, no significant differences were observed. dos Santos et al.6 showed that endogenous hypercortisolism was a more important determinant of bone properties than was the gonadal status. In the present study, the patients with hypercortisolism were divided into a hypogonadism group and a normal gonads group, and the binary logistic regression analysis showed that lumbar BMD and gonad function had no correlation. Therefore, we do not believe that sex hormones were a confounding factor affecting bone density in this study.
Osteoporosis is one of the most important clinical consequences of hypercortisolism. In the present study, the lumbar, femoral, and whole-body BMDs were significantly lower in patients with ACS and CD than in the healthy controls, similar to a previous study.6 The differences in the location and degree of decreased BMD showed a trend that followed the underlying cause of hypercortisolism, while a previous study showed that patients with ACS had significantly greater loss of bone mass than did patients with CD.7 Patients with ACS had poorer BMD in the lumbar region than did patients with CD in the present study, while femoral BMD was similar between the two groups. The lumbar vertebrae contain more cancellous bone (trabecular bone) than do the femurs; therefore, the lumbar vertebrae are more vulnerable to endogenous glucocorticoid damage.8 This is one possible reason for the differences among the various regions of BMD in patients with hypercortisolism, but further studies on this topic are needed.
There were some differences in the biochemical markers of bone metabolism between patients with hypercortisolism and healthy controls. In the present study, the serum calcium and phosphorus concentrations were significantly lower in the patients with ACS or CD than in the healthy controls. The serum calcium that we examined was the total serum calcium, which comprises both free calcium and protein-bound calcium, and the level of protein-bound calcium varies as does the level of serum albumin. Affected by the higher levels of cortisol, the serum albumin concentration in patients with hypercortisolism is lower than that in healthy people; therefore, the serum calcium concentration corrected by albumin was not significantly different among the groups in the present study. In patients with hypercortisolism, the serum ALP concentration is slightly higher than that in healthy people; but the concentration was not significantly different among the groups in this study. The ALP that we measured was the total ALP, not one of the bone isoenzymes of ALP.
The serum PTH concentration was significantly higher in the patients with ACS or CD than in the healthy controls; similarly, higher PTH concentrations were previously detected in patients with hypercortisolism than in healthy controls, and the authors suggested that this reflected active bone resorption and secondary hyperparathyroidism.9 Meng et al.10 showed that urinary calcium excretion was higher in patients with hypercortisolism and that hypercalciuria might decrease the serum calcium. Thus, the parathyroid glands were stimulated and the PTH secretion increased. Excess PTH stimulates bone resorption. Rozhinskaia et al.11 reported that secondary hyperparathyroidism was found in 25% of patients with hypercortisolism.
Of the bone turnover markers, OC is the most abundant in the bone matrix and is produced late in the bone formation process. It is synthesized by mature osteoblasts and then mixed into the bone matrix. Only a small fraction enters the circulation. Its function is not clear; it might affect bone mineralization and play a negative feedback role during bone remodeling. OC increases with bone absorption by osteoclasts; therefore, the OC concentration might reflect not only the reactionary state of bone formation but also the comprehensive state of bone transformation. CTX, a bone resorption marker, is a product of the cleavage of type I collagen due to osteoclast activity. PINP, a bone formation marker, is a metabolite of the pyrolysis of total type I tropocollagen (synthesized and secreted by osteoblasts) under the action of polypeptidase. Its serum concentration reflects the ability of osteoblasts to synthesize collagen. The serum OC and PINP concentrations in patients with hypercortisolism are lower and the CTX concentrations are higher than those in healthy people, suggesting that bone formation is suppressed and bone resorption is increased in hypercortisolism. The bone marker concentrations in the present study suggested significantly greater suppression of bone formation and bone resorption in the patients with ACS than in the patients with CD, which is supported by the lower lumbar BMD in patients with ACS than in those with CD. O’Brien et al.12 suggested that glucocorticoids directly or indirectly accelerate apoptosis of osteoblasts and osteocytes and reduce osteoclast apoptosis, causing loss of bone mass. Recent studies have revealed obviously lower OC concentrations in patients with hypercortisolism than in healthy people; the concentrations quickly recovered postoperatively, reaching peak values at 6 months.13,14
Regarding factors associated with BMD, there was a significant correlation between the ACTH concentration and lumbar BMD in the patients with CD; therefore, ACTH could potentially have a protective effect on lumbar BMD. However, the same relationship was not detected for the femoral neck and whole-body BMDs. ACTH reportedly stimulates proliferation of osteoblasts and increases collagen I mRNA in the osteoblastic cell line SaOs2 in vitro15,16; ACTH binds to a specific member of the melanocortin receptor family, MC2R, which is expressed in osteoblastic cells in vivo and then promotes osteoblast proliferation. In vitro exposure of bone marrow stromal cells to ACTH and leptin promotes osteoblast differentiation by increased gene expression of osterix and collagen type I alpha.17 Furthermore, ACTH might stimulate proliferation of osteoblasts in a dose-dependent manner; i.e., ACTH at 10 nM stimulates proliferation, while lower ACTH concentrations might oppose osteoblast differentiation.15,16 In the present study, ACTH was not associated with lumbar BMD in the patients with ACS, indicating that ACTH might not have a protective effect on lumbar BMD in patients with ACS; this finding might have been related to the low ACTH concentration in this group. ACTH might have a protective effect on bone; however, it is not sufficient to act against the adverse effects of high cortisol levels on bone metabolism in patients with CD.
Conclusions
Long-term exposure to excess glucocorticoids in patients with hypercortisolism results in bone loss, with loss of lumbar bone occurring earlier and more extensively. To enable early identification and timely intervention for bone loss, BMD examinations should be prioritized to prevent fractures. At the same time, it is important to conduct imaging of the vertebrae for early identification of fractures. Measurement of bone turnover markers (PTH, OC, CTX, and PINP) might help with early assessment of the influence of hypercortisolism on bone quality. ACTH might have a protective effect on bone; however, it is not sufficient to act against the adverse effects of high cortisol levels on bone metabolism. Because of the limited sample size and retrospective design in the present study, the effect of endogenous hypercortisolism on bone mass should be examined in a larger prospective cohort of patients.
Declaration of conflicting interest
The authors declare that there are no conflicts of interest.
Funding
This research received no specific grant from any funding agency in the public, commercial, or not-for-profit sectors.
References
- 1.Cushing H. The basophil adenomas of the pituitary body and their clinical manifestation (pituitary basophilism). Bull Johns Hopkins Hosp 1932; 50: 137–195 [Google Scholar]
- 2.Kaltsas G, Manetti L, Grossman AB. Osteoporosis in Cushing’s syndrome. Front Horm Res 2002; 30: 60–72. [DOI] [PubMed] [Google Scholar]
- 3.Vestergaard P, Lindholm J, Jørgensen JO, et al. Increased risk of osteoporotic fractures in patients with Cushing’s syndrome. Eur J Endocrinol 2002; 146: 51–56. [DOI] [PubMed] [Google Scholar]
- 4.Mancini T, Doga M, Mazziotti G, et al. Cushing’s syndrome and bone. Pituitary 2004; 7: 249–252. [DOI] [PubMed] [Google Scholar]
- 5.Arnaldi G, Angeli A, Atkinson AB, et al. Diagnosis and complications of Cushing’s syndrome: a consensus statement. J Clin Endocrinol Metab 2003; 88: 5593–5602. [DOI] [PubMed] [Google Scholar]
- 6.dos Santos CV, Vieira Neto L, Madeira M, et al. Bone density and microarchitecture in endogenous hypercortisolism. Clin Endocrinol (Oxf) 2015; 83: 468–474. [DOI] [PubMed] [Google Scholar]
- 7.Minetto M, Reimondo G, Osella G, et al. Bone loss is more severe in primary adrenal than in pituitary-dependent Cushing’s syndrome. Osteoporos Int 2004; 15: 855–861. [DOI] [PubMed] [Google Scholar]
- 8.Lacativa PG, de Farias ML. Office practice of osteoporosis evaluation. Arq Bras Endocrinol Metabol 2006; 50: 674–684. [DOI] [PubMed] [Google Scholar]
- 9.Chiodini I, Carnevale V, Torlontano M, et al. Alterations of bone turnover and bone mass at different skeletal sites due to pure glucocorticoid excess: study in eumenorrheic patients with Cushing’s syndrome. J Clin Endocrinol Metab 1998; 83: 1863–1867. [DOI] [PubMed] [Google Scholar]
- 10.Meng XW, Liu SQ, Zhang KQ. Metabolism of calcium and phosphorus in Cushing syndrome with osteoporosis. Zhonghua Nei Ke Za Zhi 1989; 28: 548–552. [PubMed] [Google Scholar]
- 11.Rozhinskaia LIa, Ermakova IP, Marova EI, et al. Phosphorus-calcium metabolism and calcium-regulating hormones in endogenous hypercorticism. Probl Endokrinol (Mosk) 1986; 32: 13–18. [PubMed] [Google Scholar]
- 12.O’Brien CA, Jia D, Plotkin LI, et al. Glucocorticoids act directly on osteoblasts and osteocytes to induce their apoptosis and reduce bone formation and strength. Endocrinology 2004; 145: 1835–1841. [DOI] [PubMed] [Google Scholar]
- 13.Szappanos A, Toke J, Lippai D, et al. Bone turnover in patients with endogenous Cushing’s syndrome before and after successful treatment. Osteoporos Int 2010; 21: 637–645. [DOI] [PubMed] [Google Scholar]
- 14.Kristo C, Jemtland R, Ueland T, et al. Restoration of the coupling process and normalization of bone mass following successful treatment of endogenous Cushing’s syndrome: a prospective, long-term study. Eur J Endocrinol 2006; 154: 109–118. [DOI] [PubMed] [Google Scholar]
- 15.Isales CM, Zaidi M, Blair HC. ACTH is a novel regulator of bone mass. Ann N Y Acad Sci 2010; 1192: 110–116. [DOI] [PubMed] [Google Scholar]
- 16.Zofková I, Matucha P. New insights into the physiology of bone regulation: the role of neurohormones. Physiol Res 2014; 63: 421–427. [DOI] [PubMed] [Google Scholar]
- 17.Martineau C, Martin-Falstrault L, Brissette L, et al. Gender- and region-specific alterations in bone metabolism in Scarb1-null female mice. J Endocrinol 2014; 222: 277–288. [DOI] [PubMed] [Google Scholar]


