Abstract
BACKGROUND. There are very few studies investigating metabolic biomarkers to predict acute graft-versus-host disease (aGVHD) after allogeneic hematopoietic stem cell transplantation (HSCT). Metabolic models can provide a framework for analyzing the information-rich omics data sets in this setting.
METHODS. Four hundred and fifty-six samples from one hundred and fourteen consecutive patients who underwent HSCT from January 2012 to May 2014 were collected for this study. The changes in serum metabolite levels were investigated using a gas chromatography–mass spectrometry–based metabolomics approach and underwent statistical analysis.
RESULTS. Significant metabolic changes were observed on day 7. The stearic acid/palmitic acid (SA/PA) ratio was effective in the diagnosis of grade II–IV aGVHD. Multivariate analysis showed that patients with high SA/PA ratios on day 7 after HSCT were less likely to develop II–IV aGVHD than patients with low SA/PA ratios (odds ratio [OR] = 0.06, 95% CI 0.02–0.18, P < 0.001). After the adjustment for clinical characteristics, the SA/PA ratio had no significant effect on overall survival (hazard ratio [HR] = 1.95, 95% CI 0.92–4.14, P = 0.08), and patients in the high SA/PA ratio group were significantly more likely to relapse than those in the low ratio group (HR = 2.26, 95% CI 1.04–4.91, P = 0.04).
CONCLUSION. Our findings suggest that the SA/PA ratio on day 7 after HSCT is an excellent biomarker to predict both aGVHD and relapse. The serum SA/PA ratio measured on day 7 after transplantation may improve risk stratification for aGVHD and relapse after allogeneic stem cell transplantation.
FUNDING. National Natural Science Foundation of China (81470346, 81773361), Priority Academic Program Development of Jiangsu Higher Education Institutions, Jiangsu Natural Science Foundation (BK20161204), Innovation Capability Development Project of Jiangsu Province (BM2015004), Jiangsu Medical Junior Talent Person award (QNRC2016707), and NIH (AI129582 and NS106170).
Keywords: Hematology
Keywords: Stem cell transplantation
The ratio of stearic acid to palmitic acid in the serum from patients undergoing hematopoietic stem cell transplantation predicts occurrence of acute graft-versus-host disease.
Introduction
Acute graft-versus-host disease (aGVHD) is a common complication contributing to the morbidity and mortality after allogeneic hematopoietic stem cell transplantation (HSCT). There are currently very few biomarkers available to identify patients at risk for aGVHD. Much work has been done to investigate aGVHD pathogenesis using proteomics approaches (1–5). Metabolomics aims to measure the global dynamic metabolic response of living systems to biological stimuli or genetic manipulation and focuses on understanding systemic changes over time in complex multicellular systems (6–8). It is a useful tool in the identification of disease biomarkers, investigation of pathogenesis, and treatment of diseases (9–12). aGVHD development and treatment inevitably affect metabolic processes. The aim of the present study was to investigate potential metabolic serum biomarkers associated with aGVHD and their potential value in prognosis.
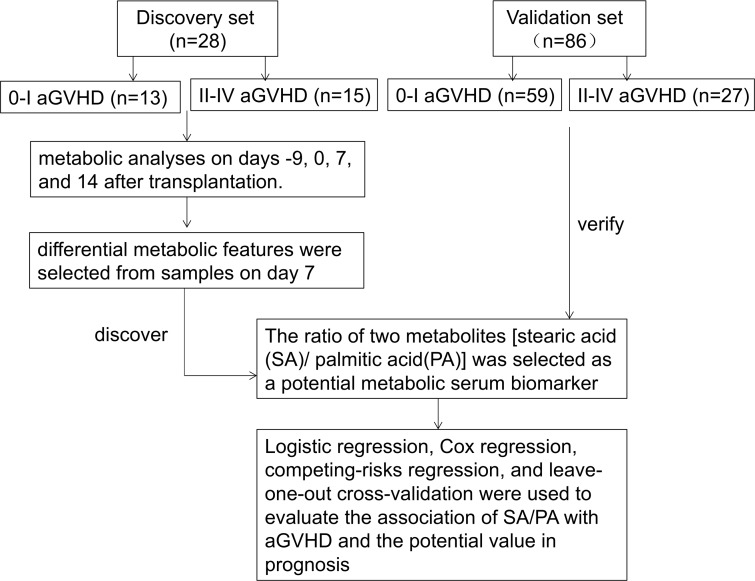
In this study, changes in serum metabolite levels on days –9, 0, 7, and 14 after transplantation were investigated using an untargeted gas chromatography–mass spectrometry (GC-MS) technique. Multivariate and univariate statistical analyses were used to select the differential metabolic features. The ratio of two metabolites (stearic acid/palmitic acid [SA/PA]) was considered as a single biomarker. We evaluated the potential of this biomarker in predicting aGVHD risk and relapse (Figure 1).
Figure 1. Study scheme of discovery and validation.
Clinical data and serum samples after hematopoietic stem cell transplantation were available from 114 patients transplanted at The First Affiliated Hospital of Soochow University. Serum samples were collected on days –9, 0, 7, and 14 after transplantation. We randomly selected 13 patients with 0–I aGVHD and 15 with II–IV aGVHD to set up a discovery set. The rest of the patients (59 with aGVHD 0–I and 27 with II–IV aGVHD) were included in the validation set. Our metabolic analyses always began with the discovery set. Significant metabolic changes were observed on day 7 (P < 0.001). The ratio of two metabolites (stearic acid/palmitic acid [SA/PA]) was considered as a single biomarker. Logistic regression, Cox regression, competing-risks regression, and leave-one-out cross-validation were used to evaluate the association of the potential metabolites with the occurrence of aGVHD, overall survival, progress-free survival, relapse, and mortality without relapse.
Results
Discovery and validation of aGVHD biomarkers.
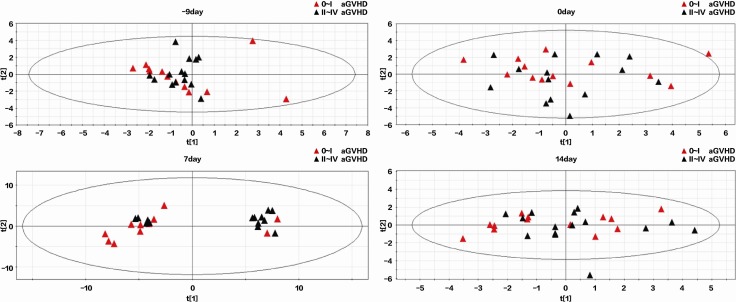
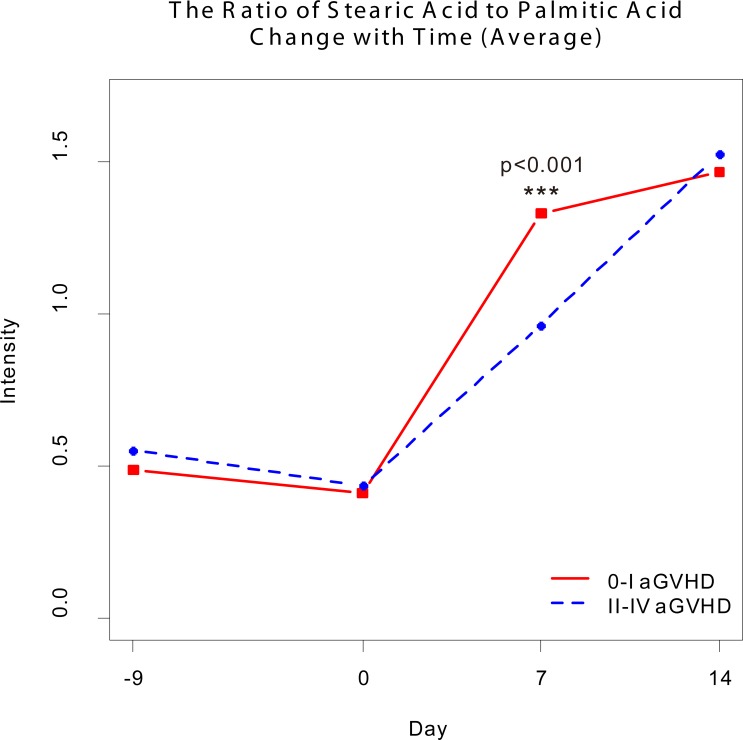
Changes in serum metabolites on days –9, 0, 7, and 14 after transplantation were investigated. Sixteen metabolites were detectable in patients with 0–I aGVHD or II–IV aGVHD (Supplemental Table 1; supplemental material available online with this article; https://doi.org/10.1172/jci.insight.99672DS1). Significant metabolic changes were observed on day 7 (Figure 2, P < 0.01). The t test and receiver operating characteristic (ROC) curve analyses showed differences in PA and SA between the two groups of patients (P < 0.05, AUC = 0.723; Figure 3, A and B, and Supplemental Table 1). PA levels were lower and SA levels were higher in the 0–I aGVHD group of patients) than in the II–IV aGVHD group of patients. The ratio of these two metabolites (i.e., SA/PA) was significantly different between the two groups of patients on day 7 (Figure 4). The SA/PA ratio was more effective in the diagnosis of II–IV aGVHD compared with either of the two metabolite biomarkers alone, indicating improved diagnostic performance (P < 0.01, AUC = 0.836, Figure 3C). Evaluation of a validation set of 86 patients (59 patients with 0–I aGVHD and 27 patients with II–IV aGVHD) confirmed the improved diagnostic performance (P < 0.01, AUC = 0.719, Figure 3D).
Figure 2. Principal component analysis score plots of GC-MS metabolic profiles in 0–I and II–IV aGVHD patients in the discovery data set on days –9, 0, 7, and 14 after transplantation.
The plots separating samples from 0–I (red triangles, n = 13) and II–IV (blue triangles, n = 15) aGVHD patients based on GC-MS metabolic profiling 9 days prior to transplantation (top left), on the day of transplantation (top right), and 7 (bottom left) and 14 (bottom right) days after transplantation. Compared with the other time points, an obvious separation trend was observed between the red and blue triangles in the scores plot on day 7 although slight overlapping was seen.
Figure 3. The t test and ROC curve analysis results from the 0–I and II–IV aGVHD groups of patients.
The t test and ROC curve analyses showed differences in PA, SA, and the SA/PA ratio between the two groups of patients in the discovery set (A, B, and C; n = 28; P < 0.05, AUC > 0.7). The SA/PA ratio was more effective in the diagnosis of II–IV aGVHD compared with each of the two metabolite biomarkers alone. These data are confirmed by the results from the validation data set (D; n = 86; P < 0.01, AUC = 0.719).
Figure 4. The ratio of stearic acid to palmitic acid changes with time.
The dynamic change in the ratio of stearic to palmitic acid observed in samples collected on different days before and after hematopoietic stem cell transplantation (0–I aGVHD, n = 72; II–IV aGVHD, n = 42). The ratio of these two metabolites was significantly different between the two groups of patients on day 7 after transplantation based on t test (***P < 0.001).
The model with the SA/PA ratio was superior to the model with PA or SA in predicting aGVHD on day 7 after transplantation.
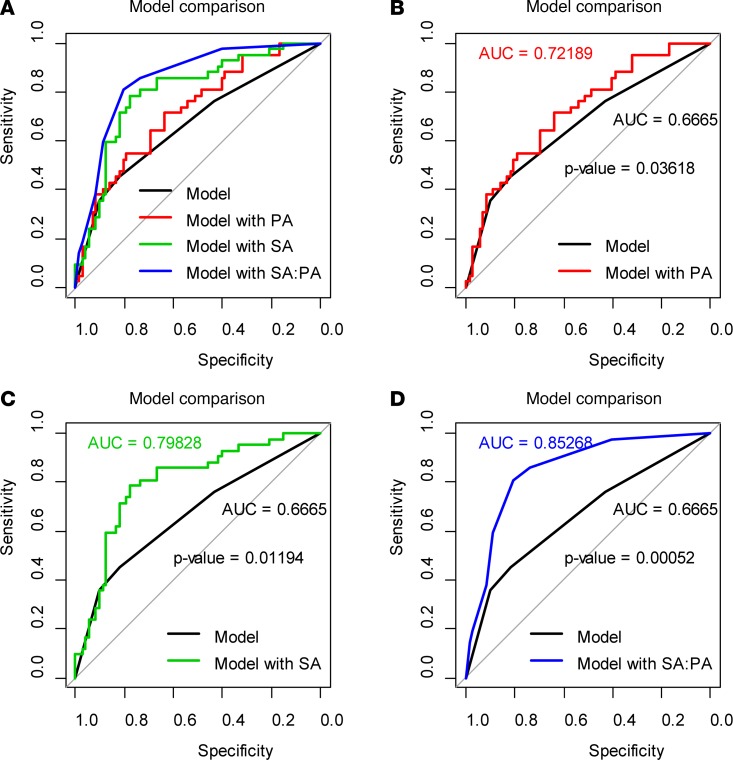
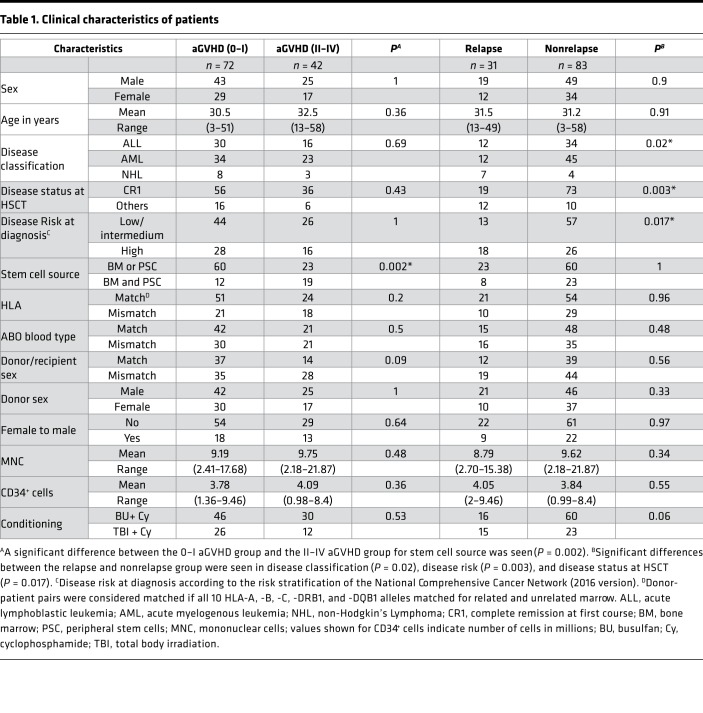
We next performed univariate analyses to predict the occurrence of aGVHD with SA, PA, and the SA/PA ratio as well as the following clinical characteristics: sex, age, disease type, disease status, risk stratification, stem cell source, HLA match, ABO blood type match, donor/recipient sex match, conditioning, and the number of reinfused mononuclear and CD34+ cells. Our data show that stem cell source and donor/recipient sex match, which were included in the subsequent models, were associated with the occurrence of aGVHD. We divided patients into low and high SA/PA groups on the basis of Youden index using a cutoff value of 0.731 (13). Multivariate analysis showed that both SA and the SA/PA ratio decreased, whereas PA increased, the likelihood of II–IV aGVHD. Compared with patients with low SA/PA, patients with high SA/PA were less likely to develop II–IV aGVHD (odds ratio [OR] = 0.06, 95%CI, 0.02–0.18, P < 0.001; Supplemental Table 2). Comparison of ROC curves for the clinical characteristics alone with those for the clinical characteristics combined with PA, SA, and the SA/PA ratio to predict aGVHD showed significant increases in the AUC in all markers when combined with clinical characteristics (Figure 5); the SA/PA ratio had a significantly larger AUC than PA (P = 0.006) or SA (P = 0.01). According to the leave-one-out cross validation, the prediction accuracy of the model with SA/PA was 0.807.
Figure 5. Models consisting of clinical characteristics alone or the clinical characteristics combined with PA, SA, or SA/PA ratios in predicting aGVHD.
The models consisting of clinical characteristics combined with PA, SA, or SA/PA were compared to the models consisting of clinical characteristics alone (0–I aGVHD, n = 72; II–IV aGVHD, n = 42) (A). The model with PA had a larger AUC compared with clinical characteristics alone (B, P = 0.03618). Models with clinical characteristics alone were inferior to models with SA (C, P =0.01194) or SA/PA (D, P =0.00052). All AUC comparisons were based on Delong’s test.
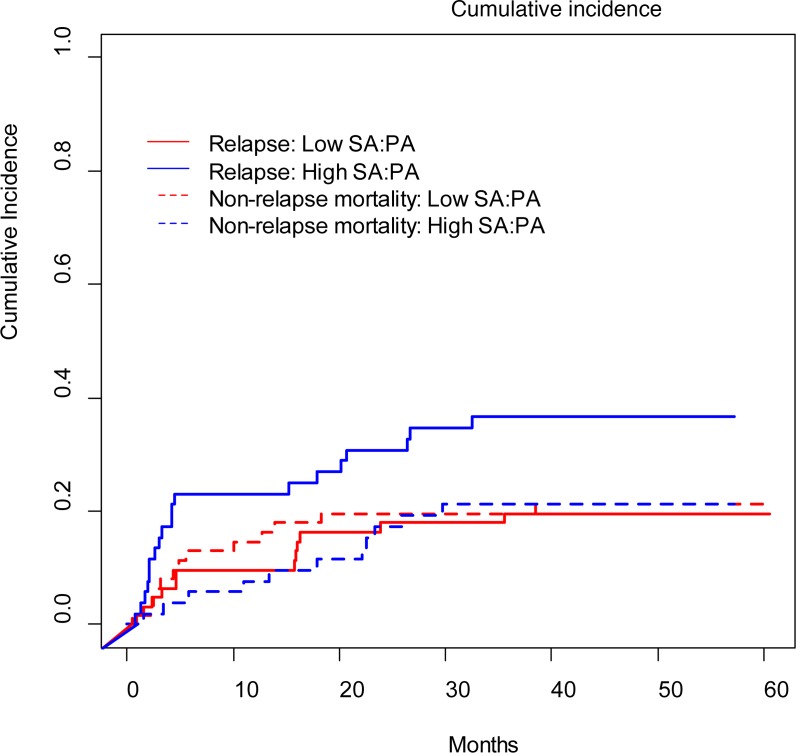
Patients with a high SA/PA ratio on day 7 after transplantation were more likely to experience relapse, although there was no significant difference in nonrelapse morality and overall survival between the high and low SA/PA groups.
Since aGVHD is one of the major causes of death after transplantation, we analyzed the association of the clinical characteristics and biomarkers with overall survival. In univariate analyses, disease type, disease status, risk stratification, HLA match, and conditioning were associated with overall survival (P < 0.05). After adjustment for these significant clinical characteristics, the SA/PA ratio had no significant effect on overall survival (hazard ratio [HR] = 1.95, 95% CI 0.92–4.14, P = 0.08; Supplemental Table 3).
We next investigated possible relationships between the biomarkers and the relapse rates because relapse and nonrelapse mortality were the most important factors in disease progression. Patients were divided into low and high SA/PA ratio groups. The cutoff point of 1.3667 was obtained by using a visual assessment of the functional form of the association of the SA/PA ratio with patients’ outcome (i.e., a plot of Martingale residuals from a null Cox model against the SA/PA ratio) (14). The cumulative incidence was analyzed based on this cutoff. Relapse was more frequent in the patients with high compared with low SA/PA ratios (P = 0.04), although there was no significant difference in nonrelapse mortality between the two groups (P = 0.89; Figure 6). However, some patients died without relapse, which could be considered as a competitive risk in relapse rate analysis. Therefore, we introduced competing risk regression to further explore the association of relapse and the SA/PA ratio. In all analyses, we treated nonrelapse mortality as a competing factor. The following clinical characteristics were included in the model based on the results from the univariate analyses: disease type, disease status, risk stratification, and conditioning. After adjustment for these variables, patients in the high SA/PA ratio group were significantly more likely to relapse than those in the low ratio group (HR = 2.26, 95% CI 1.04 to 4.91, P = 0.04; Supplemental Table 4). We also analyzed the potential association of the CMV and EBV reactivation and bacterial infection within 30 days after transplantation with the biomarkers. PA, SA, and the SA/PA ratio had no significant association with CMV or EBV reactivation or bacterial infection (Supplemental Table 5).
Figure 6. The cumulative incidence of relapse and nonrelapse mortality between patients with low and high SA/PA ratios.
According to Gray’s test, patients with high SA/PA ratios (n = 52) had greater chance to experience relapse (P = 0.04) compared with patients with low SA/PA ratios (n = 62). There was no significant difference in nonrelapse morality between the two groups (P = 0.89).
Discussion
It has been reported that the type of saturated fatty acid present in the diet can significantly affect lymphocyte functions and the immune system (15). In our untargeted metabolomics study, we found that patients with lower serum SA/PA ratios were more likely to develop aGVHD after transplantation, suggesting an important role of saturated fatty acid intake in the pathogenesis of aGVHD.
SA was reported to selectively inhibit T cell–dependent immune responses in vitro (17, 18), and SA accumulation in macrophages can induce Toll-like receptor 4/2–independent inflammation, resulting in endoplasmic reticulum stress–mediated apoptosis (19, 20), which could further help prevent aGVHD. However, in animal models, NK cell activity was lower in the spleens from animals fed SA than those fed PA (15). Olson et al. reported that NK cells can inhibit aGVHD (16). These observations indicate that SA may reduce aGVHD risk through T cells instead of NK cells.
PA has been thought to be related to inflammation since it can induce IL-6 mRNA expression and protein secretion, which may result in aGVHD (21, 22). A recent study showed that inhibition of the IL-6 signaling pathway attenuated aGVHD, and an increase in the absolute number of Tregs was also observed in this process (23). Therefore, PA may trigger aGVHD through an immune response involving elevated IL-6 levels. Fatty acids can also modulate secretion of other cytokines, such as IL-8, IL-1, IL-2, IL-10, TNF-β, and IFN-γ, as reported in several studies (24, 25). However, detailed mechanisms underlying the exact role of PA and SA, or their product-to-precursor ratios in predicting aGVHD risk, have not been fully studied.
Many human cancers are accompanied by increasing fatty acid synthesis and abnormal fatty acid utilization (26, 27). Fatty acids also have antitumor activity (28), although the relationship between fatty acid intake and leukemia relapse has not been fully understood. Nevertheless, our data are consistent with the previous reports suggesting that aGVHD lowers relapse rates in leukemia (29). This phenomenon is probably due to a durable antileukemic effect in patients with GVHD (30).
We believe that SA and PA may be important metabolites in the development of aGVHD, since their levels change very early in the process. In our study, nearly 50% of patients suffered aGVHD within 30 days after transplantation, whereas the disease occurred in 8 patients on or before day 14. It is possible that aGVHD had already started on day 7, resulting in increased biomarker levels, even though clinical symptoms were not obvious until days or weeks later. The SA/PA ratio in our study was not different between the aGVHD and non-aGVHD groups on day 14. Hartwell et al. also reported differences in biomarker levels in peripheral blood samples collected on day 7 after transplantation (31). Additionally, we found that SA, PA, and the SA/PA ratio were not useful in monitoring patients with existing GVHD. Although detailed mechanisms connecting aGVHD and SA or PA intake remain to be investigated, our preliminary data suggest that mechanisms of action of these metabolites are probably different from those of other known markers, such as ST-2 and Tim-3.
In conclusion, our findings suggest that the SA/PA ratio is an excellent biomarker to predict both aGVHD risk and relapse. The higher SA/PA ratio is associated with lower aGVHD risk and higher relapse rates. The serum SA/PA ratios measured on day 7 after transplantation may improve risk stratification for aGVHD and relapse after allogeneic HSCT.
Methods
Patient selection and sample collection.
All patients (n = 114) who underwent allogeneic HSCT at The First Affiliated Hospital of Soochow University from January 2012 to May 2014 were enrolled in this study. Serum samples were collected on days –9, 0, 7, and 14 after transplantation. aGVHD was graded according to the modified Glucksberg criteria. The characteristics of patients are summarized in Table 1, and the clinical outcomes have been summarized in the Supplemental Clinical Outcomes. All clinical venous blood samples were collected in the morning and centrifuged at 1,500 g for 15 minutes. Each serum sample was divided into equal aliquots and stored at −80°C until analysis.
Table 1. Clinical characteristics of patients.
Discovery set and validation set.
We randomly selected 13 patients with 0–I aGVHD and 15 with II–IV aGVHD to set up a discovery set. The rest of the patients (59 patients with 0–I aGVHD and 27 with II–IV aGVHD) were included in the validation set. Our metabolic analyses always began with the discovery set.
Sample preparation.
The sample preparation protocol for GC-MS analysis has been described previously (32). After thawing at room temperature, 100-μl serum samples were mixed with 400 μl cold acetonitrile, including 20 mg/ml 2, 4-dichlorobenzoic acid as internal standard. After vortexing, the mixture was centrifuged at 16,000 g at 4°C for 15 minutes to precipitate the proteins. The supernatant was transferred to a new tube and dried with vacuum. The dried samples were redissolved with 50 μl methoxyamine pyridine solution (15 mg/ml) and treated with an ultrasound for 15 minutes at room temperature. Subsequently, oximation reaction was conducted in a water bath at 70°C 1 hour, followed by 1 hour silylation with 50 μl N-Methyl-N-trimethylsilyl trifluoroacetamide in a water bath at 40°C. Finally, the derivatized samples were centrifuged at 16,000 g for15 minutes, and the supernatant was analyzed by GC-MS.
GC-MS.
Serum metabolite profiles were obtained by Agilent 7890/5975C GC-MS (Agilent Technologies). One microliter derivatized sample was injected into a DB-5 fused silica capillary column (30 mm × 0.25 mm × 0.25 μm, J&W Scientific) in a split mode (ratio 10:1). The carrier gas (99.9% helium) was operated with a constant flow rate of 1.1 ml/min. The initial column temperature of 80°C was maintained for 5 minutes and then increased to 170°C at 5°C per minute intervals and to 300°C at 10°C per minute intervals. The temperatures of inlet ion source and the electron ionization source were 280°C and 230°C, respectively. Mass spectra were acquired in the full scan mode with m/z 30–600. Serum metabolite identification was conducted using the NIST 11 Mass Spectral Database (https://www.nist.gov), followed by retention index and confirmation of authentic standards.
Statistics.
The metabolic peak extraction and detection were conducted at an Agilent GC-MS workstation. Raw MS data were imported into AMDIS 32 (NIST) for mass spectra detection, deconvolution, and identification. The metabolic variables with at least 80% missing values were removed (33). Afterward, the data matrix, including metabolic variables and peak areas, were stored in comma-separated values format and imported into the MetaboAnalyst (http://www.metaboanalyst.ca). Before data processing, sample normalization (row wise) by internal standard (2, 4-dichlorobenzoic acid) and feature normalization (column wise) by Pareto scaling was conducted. Finally, false discovery rate correction, performed using the Benjamini-Hochberg method (q < 0.10), was applied to all data involving multiple comparisons to reduce the false positive rate. Representative GC-MS total ion chromatograms and metabolite abundance quantified in serum samples over two quality control replicates are shown in Supplemental Figures 1 and 2, respectively.
In order to better visualize the plasma metabolite differences among these complex data sets, pattern recognition analysis–principal component analysis (PCA) was used to investigate the cluster data from the patients. Compared with other time points, an obvious separation trend was observed between these two groups (although slight overlapping was seen) in the PCA plots on day 7, which indicated that alternations of serum metabolome were relatively more evident at that time point. Therefore, differential metabolic features were selected from samples on day 7.
The main endpoints of this study were overall survival, disease-free survival, and relapse. The differential variables were selected based on P value from the 2-tailed t test (P < 0.05), false discovery rate (FDR) < 0.2, and AUC of the ROC analysis (AUC > 0.7). Logistic regression, Cox regression, competing-risks regression, and leave-one-out cross-validation were used to evaluate the association of the potential metabolites with the occurrence of aGVHD, overall survival, progress-free survival, relapse, and mortality without relapse. The models were compared with hazard ratio, AUC, and a continuous form of the net reclassification index. Cox regression was also used to evaluate the association of the potential metabolites with the occurrence of CMV or EBV reactivation or bacterial infection within 30 days after transplantation.
Study approval.
The study protocol followed the guidelines in the Declaration of Helsinki and was approved by the Hospital Ethics Committee at The First Affiliated Hospital of Soochow University. No commercial sponsor was involved in the study. Written informed consents were obtained from all patients.
Author contributions
XW and CW designed the project and performed experiments; collected, analyzed, and interpreted the data; and wrote the first version of the manuscript; YX performed statistical analysis; JZ analyzed and interpreted the data and tested data quality; AY, SM, and JX critically edited the manuscript and interpreted the data; HL, YJ, and BY conducted experiments and collected data; XB, SC, YH, JY, and DW designed the study and analyzed and interpreted the data; XW, YX, CW, YH, and XB contributed equally to this study. All authors read and approved the final version of the manuscript.
Supplementary Material
Acknowledgments
This work was supported by the National Natural Science Foundation of China (81470346, 81773361), the Priority Academic Program Development of Jiangsu Higher Education Institutions, the National Clinical Key Specialty Development Project and National Public Health Grand Research Foundation (201202017), the Network Hospital of Clinical Medicine Science and Technology Project, Jiangsu Science and Technology Department (BL2012005), Jiangsu Natural Science Foundation (BK20161204), Jiangsu “333” Talent Project (BRA2015497), the National Key Research and Development Program (2016YFC0902800), Innovation Capability Development Project of Jiangsu Province (BM2015004), Jiangsu Summit Six Top Talent Person project, and Jiangsu Medical Junior Talent Person award (QNRC2016707). This work was also supported by grants from the NIH (AI129582 and NS106170).
Version 1. 05/03/2018
Electronic publication
Footnotes
Conflict of interest: The authors have declared that no conflict of interest exists.
Reference information: JCI Insight. 2018;3(9):e99672. https://doi.org/10.1172/jci.insight.99672.
Contributor Information
Xiaojin Wu, Email: wuxiaojin@suda.edu.cn.
Yiyu Xie, Email: xie_yiyu@163.com.
Chang Wang, Email: wangchang177@126.com.
Yue Han, Email: hanyuesz@163.com.
Xiebing Bao, Email: baoxiebing1982@163.com.
Shoubao Ma, Email: mashoubao@126.com.
Ahmet Yilmaz, Email: ahmetyilmaz22@yahoo.com.
Bingyu Yang, Email: 20174032004@stu.suda.edu.cn.
Yuhan Ji, Email: 20155232054@stu.suda.edu.cn.
Hong Liu, Email: liuhong-1012@163.com.
Suning Chen, Email: chensuning@sina.com.
Jianying Zhang, Email: jianying.zhang@osumc.edu.
Jianhua Yu, Email: jianhua.yu@osumc.edu.
Depei Wu, Email: wudepei@suda.edu.cn.
References
- 1.McDonald GB, Tabellini L, Storer BE, Lawler RL, Martin PJ, Hansen JA. Plasma biomarkers of acute GVHD and nonrelapse mortality: predictive value of measurements before GVHD onset and treatment. Blood. 2015;126(1):113–120. doi: 10.1182/blood-2015-03-636753. [DOI] [PMC free article] [PubMed] [Google Scholar]
- 2.Ferrara JL, Levine JE, Reddy P, Holler E. Graft-versus-host disease. Lancet. 2009;373(9674):1550–1561. doi: 10.1016/S0140-6736(09)60237-3. [DOI] [PMC free article] [PubMed] [Google Scholar]
- 3.Ferrara JL, et al. Regenerating islet-derived 3-alpha is a biomarker of gastrointestinal graft-versus-host disease. Blood. 2011;118(25):6702–6708. doi: 10.1182/blood-2011-08-375006. [DOI] [PMC free article] [PubMed] [Google Scholar]
- 4.Paczesny S, et al. A biomarker panel for acute graft-versus-host disease. Blood. 2009;113(2):273–278. doi: 10.1182/blood-2008-07-167098. [DOI] [PMC free article] [PubMed] [Google Scholar]
- 5.Xiao B, et al. Plasma microRNA signature as a noninvasive biomarker for acute graft-versus-host disease. Blood. 2013;122(19):3365–3375. doi: 10.1182/blood-2013-06-510586. [DOI] [PMC free article] [PubMed] [Google Scholar]
- 6.Nicholson JK, Lindon JC. Systems biology: Metabonomics. Nature. 2008;455(7216):1054–1056. doi: 10.1038/4551054a. [DOI] [PubMed] [Google Scholar]
- 7.Budczies J, et al. Comparative metabolomics of estrogen receptor positive and estrogen receptor negative breast cancer: alterations in glutamine and beta-alanine metabolism. J Proteomics. 2013;94:279–288. doi: 10.1016/j.jprot.2013.10.002. [DOI] [PubMed] [Google Scholar]
- 8.Vernocchi P, et al. Integration of datasets from different analytical techniques to assess the impact of nutrition on human metabolome. Front Cell Infect Microbiol. 2012;2:156. doi: 10.3389/fcimb.2012.00156. [DOI] [PMC free article] [PubMed] [Google Scholar]
- 9.Büchel B, Rhyn P, Schürch S, Bühr C, Amstutz U, Largiadèr CR. LC-MS/MS method for simultaneous analysis of uracil, 5,6-dihydrouracil, 5-fluorouracil and 5-fluoro-5,6-dihydrouracil in human plasma for therapeutic drug monitoring and toxicity prediction in cancer patients. Biomed Chromatogr. 2013;27(1):7–16. doi: 10.1002/bmc.2741. [DOI] [PubMed] [Google Scholar]
- 10.Aurich MK, et al. Prediction of intracellular metabolic states from extracellular metabolomic data. Metabolomics. 2015;11(3):603–619. doi: 10.1007/s11306-014-0721-3. [DOI] [PMC free article] [PubMed] [Google Scholar]
- 11.Karlíková R, et al. Metabolite profiling of the plasma and leukocytes of chronic myeloid leukemia patients. J Proteome Res. 2016;15(9):3158–3166. doi: 10.1021/acs.jproteome.6b00356. [DOI] [PubMed] [Google Scholar]
- 12.Ghartey J, Bastek JA, Brown AG, Anglim L, Elovitz MA. Women with preterm birth have a distinct cervicovaginal metabolome. Am J Obstet Gynecol. 2015;212(6):776.e1–776.e12. doi: 10.1016/j.ajog.2015.03.052. [DOI] [PMC free article] [PubMed] [Google Scholar]
- 13.Youden WJ. Index for rating diagnostic tests. Cancer. 1950;3(1):32–35. doi: 10.1002/1097-0142(1950)3:1<32::AID-CNCR2820030106>3.0.CO;2-3. [DOI] [PubMed] [Google Scholar]
- 14.Viers BR, et al. Pretreatment neutrophil-to-lymphocyte ratio is associated with advanced pathologic tumor stage and increased cancer-specific mortality among patients with urothelial carcinoma of the bladder undergoing radical cystectomy. Eur Urol. 2014;66(6):1157–1164. doi: 10.1016/j.eururo.2014.02.042. [DOI] [PubMed] [Google Scholar]
- 15.Jeffery NM, Sanderson P, Newsholme EA, Calder PC. Effects of varying the type of saturated fatty acid in the rat diet upon serum lipid levels and spleen lymphocyte functions. Biochim Biophys Acta. 1997;1345(3):223–236. doi: 10.1016/s0005-2760(96)00174-9. [DOI] [PubMed] [Google Scholar]
- 16.Olson JA, Leveson-Gower DB, Gill S, Baker J, Beilhack A, Negrin RS. NK cells mediate reduction of GVHD by inhibiting activated, alloreactive T cells while retaining GVT effects. Blood. 2010;115(21):4293–4301. doi: 10.1182/blood-2009-05-222190. [DOI] [PMC free article] [PubMed] [Google Scholar]
- 17.Tebbey PW, Buttke TM. Molecular basis for the immunosuppressive action of stearic acid on T cells. Immunology. 1990;70(3):379–384. [PMC free article] [PubMed] [Google Scholar]
- 18.Buttke TM, Cuchens MA. Inhibition of lymphocyte proliferation by free fatty acids. II. Toxicity of stearic acid towards phytohaemagglutinin-activated T cells. Immunology. 1984;53(3):507–514. [PMC free article] [PubMed] [Google Scholar]
- 19.Anderson EK, Hill AA, Hasty AH. Stearic acid accumulation in macrophages induces toll-like receptor 4/2-independent inflammation leading to endoplasmic reticulum stress-mediated apoptosis. Arterioscler Thromb Vasc Biol. 2012;32(7):1687–1695. doi: 10.1161/ATVBAHA.112.250142. [DOI] [PMC free article] [PubMed] [Google Scholar]
- 20.Artwohl M, Roden M, Waldhäusl W, Freudenthaler A, Baumgartner-Parzer SM. Free fatty acids trigger apoptosis and inhibit cell cycle progression in human vascular endothelial cells. FASEB J. 2004;18(1):146–148. doi: 10.1096/fj.03-0301fje. [DOI] [PubMed] [Google Scholar]
- 21.Weigert C, et al. Palmitate, but not unsaturated fatty acids, induces the expression of interleukin-6 in human myotubes through proteasome-dependent activation of nuclear factor-kappaB. J Biol Chem. 2004;279(23):23942–23952. doi: 10.1074/jbc.M312692200. [DOI] [PubMed] [Google Scholar]
- 22.Chen X, et al. Blockade of interleukin-6 signaling augments regulatory T-cell reconstitution and attenuates the severity of graft-versus-host disease. Blood. 2009;114(4):891–900. doi: 10.1182/blood-2009-01-197178. [DOI] [PMC free article] [PubMed] [Google Scholar]
- 23.DiCarlo J, et al. Cytokine and chemokine patterns across 100 days after hematopoietic stem cell transplantation in children. Biol Blood Marrow Transplant. 2014;20(3):361–369. doi: 10.1016/j.bbmt.2013.11.026. [DOI] [PMC free article] [PubMed] [Google Scholar]
- 24.Stentz FB, Kitabchi AE. Palmitic acid-induced activation of human T-lymphocytes and aortic endothelial cells with production of insulin receptors, reactive oxygen species, cytokines, and lipid peroxidation. Biochem Biophys Res Commun. 2006;346(3):721–726. doi: 10.1016/j.bbrc.2006.05.159. [DOI] [PubMed] [Google Scholar]
- 25.Fernanda Cury-Boaventura M, Cristine Kanunfre C, Gorjão R, Martins de Lima T, Curi R. Mechanisms involved in Jurkat cell death induced by oleic and linoleic acids. Clin Nutr. 2006;25(6):1004–1014. doi: 10.1016/j.clnu.2006.05.008. [DOI] [PubMed] [Google Scholar]
- 26.Pizer ES, Wood FD, Pasternack GR, Kuhajda FP. Fatty acid synthase (FAS): a target for cytotoxic antimetabolites in HL60 promyelocytic leukemia cells. Cancer Res. 1996;56(4):745–751. [PubMed] [Google Scholar]
- 27.Arita K, et al. Mechanism of apoptosis in HL-60 cells induced by n-3 and n-6 polyunsaturated fatty acids. Biochem Pharmacol. 2001;62(7):821–828. doi: 10.1016/S0006-2952(01)00723-7. [DOI] [PubMed] [Google Scholar]
- 28.Gao P, Hirano T, Chen Z, Yasuhara T, Nakata Y, Sugimoto A. Isolation and identification of C-19 fatty acids with anti-tumor activity from the spores of Ganoderma lucidum (reishi mushroom) Fitoterapia. 2012;83(3):490–499. doi: 10.1016/j.fitote.2011.12.014. [DOI] [PubMed] [Google Scholar]
- 29.Kim HJ, et al. Anti-leukaemic role of acute GvHD after unrelated haematopoietic stem cell transplantation in intermediate- to high-risk acute myelogenous leukaemia. Bone Marrow Transplant. 2007;40(11):1069–1074. doi: 10.1038/sj.bmt.1705873. [DOI] [PubMed] [Google Scholar]
- 30.Sullivan KM, et al. Influence of acute and chronic graft-versus-host disease on relapse and survival after bone marrow transplantation from HLA-identical siblings as treatment of acute and chronic leukemia. Blood. 1989;73(6):1720–1728. [PubMed] [Google Scholar]
- 31.Hartwell MJ, et al. An early-biomarker algorithm predicts lethal graft-versus-host disease and survival. JCI Insight. 2017;2(3):e89798. doi: 10.1172/jci.insight.89798. [DOI] [PMC free article] [PubMed] [Google Scholar]
- 32.Zhao M, Lau KK, Zhou X, Wu J, Yang J, Wang C. Urinary metabolic signatures and early triage of acute radiation exposure in rat model. Mol Biosyst. 2017;13(4):756–766. doi: 10.1039/C6MB00785F. [DOI] [PubMed] [Google Scholar]
- 33.Bijlsma S, et al. Large-scale human metabolomics studies: a strategy for data (pre-) processing and validation. Anal Chem. 2006;78(2):567–574. doi: 10.1021/ac051495j. [DOI] [PubMed] [Google Scholar]
Associated Data
This section collects any data citations, data availability statements, or supplementary materials included in this article.


