Abstract
Functional recovery after stroke has been associated with brain plasticity; however, the exact relationship is unknown. We performed behavioral tests, functional MRI, and histology in a rat stroke model to assess the correlation between temporal changes in sensorimotor function, brain activation patterns, cerebral ischemic damage, and cerebrovascular reactivity. Unilateral stroke induced a large ipsilateral infarct and acute dysfunction of the contralateral forelimb, which significantly recovered at later stages. Forelimb impairment was accompanied by loss of stimulus-induced activation in the ipsilesional sensorimotor cortex; however, local tissue and perfusion were only moderately affected and cerebrovascular reactivity was preserved in this area. At 3 days after stroke, extensive activation-induced responses were detected in the contralesional hemisphere. After 14 days, we found reduced involvement of the contralesional hemisphere, and significant responses in the infarction periphery. Our data suggest that limb dysfunction is related to loss of brain activation in the ipsilesional sensorimotor cortex and that restoration of function is associated with biphasic recruitment of peri- and contralesional functional fields in the brain.
Stroke is one of the main causes of morbidity and invalidity in modern society. About 80–90% of stroke survivors exhibit motor weakness and 40–50% experience sensory disturbances (1). Yet, most patients show a certain degree of recovery of function over time. The prolonged time course of recovery after stroke holds promising opportunities for therapeutic intervention. Knowledge of the mechanisms underlying spontaneous functional recovery may help in the design of effective neurorehabilitative strategies.
Poststroke restitution of lost function may be explained by brain plasticity. Several animal and human studies on stroke recovery associate restoration of function with reorganization in the brain (2–6). Shifts of hand representations after focal ischemic lesions in monkeys' sensorimotor cortex have been demonstrated with intracortical microstimulation mapping techniques (7, 8). In addition, brain imaging studies in chronic stroke patients have shown enhanced bilateral activation of the sensorimotor cortex, increased activity in secondary or higher order sensorimotor areas, and recruitment of additional cortical areas during performance of a hand sensorimotor task (5). However, despite explicit demonstration of stroke-induced plastic changes in the brain, a clear causal link between cerebral reorganization and functional recovery, and its temporal characteristics, has not been established.
Our goal was to correlate temporal sensorimotor function alterations with the evolution of changes in brain activation patterns in relation to the cerebral pathophysiological status after stroke. To that end we used functional MRI methods (i) to map the complete brain network showing activation responses to sensory forelimb stimulation and (ii) to assess brain hemodynamics and tissue damage, at distinct time points in rats recovering from unilateral stroke.
Materials and Methods
Experimental protocols were institutionally approved in accordance with the National Institutes of Health Guide for the Care and Use of Laboratory Animals.
Stroke Induction.
Permanent focal cerebral ischemia was induced under anesthesia with 1.5% halothane in 70% N2O/30% O2, by electrocoagulation of the right middle cerebral artery (MCA) in adult male Sprague–Dawley rats (270–300 g; refs. 9 and 10).
Behavioral Study.
Beginning on the day of surgery and continuing every other day for 2 weeks, animals were examined by using a limb placing test to assess sensorimotor function in the forelimb (10, 11). Specifically, the forelimb placing test measures sensorimotor function in each forelimb as the animal places the limb on a tabletop in response to visual, tactile, and proprioceptive stimuli (total score = 0–12; 12 = maximally impaired).
MRI.
In two separate groups of animals, MRI experiments were performed at 3 days poststroke (n = 6), when sensorimotor function is severely disturbed (10), and 14 days poststroke (n = 6), when sensorimotor function has recovered to subnormal levels (10). Sham-operated rats served as controls (n = 6; three animals 3 days after sham operation; three animals 14 days after sham operation).
Before MRI, rats were tracheotomized and mechanically ventilated with 1% halothane in O2/air (1/1). The right femoral artery was catheterized for monitoring of arterial blood pressure and blood gases. The right femoral vein and jugular vein were cannulated for administration of anesthetic agent and NMR contrast agent, respectively. Thin copper wires were inserted just beneath the skin on opposite sides of each forelimb at the level of the wrist. Next, rats were paralyzed by an i.v. bolus of pancuronium (2 mg/kg) followed by continuous infusion (2 mg/kg/h). The anesthetic regime was changed to a continuous i.v. infusion of α-chloralose (40 mg/kg/h), preceded by a bolus injection (50 mg/kg). Stimulation experiments were delayed by at least 1 hour to allow the anesthetic transition.
MRI was done on a 2.0 T magnet system (SISCO/Varian Instruments), using a 3-cm surface radiofrequency coil. Body temperature, blood pressure, and blood gases were carefully controlled and maintained at normal values during the MRI experiments.
Multislice spin echo T2- [repetition time (TR)/echo time (TE) = 2000/70 ms] and diffusion-weighted MRI (TR/TE = 2000/40 ms; b = 150, 750, and 1350 s/mm2; diffusion-encoding gradients in three directions) were performed [field-of-view (FOV) = 25 × 25 mm2; 64 × 64 data matrix; nine 1.5-mm slices]. Two-dimensional maps of the mean trace of the apparent diffusion coefficient (ADC) of tissue water were calculated from the diffusion-weighted MRI data (12) .
Second, boluses of the intravascular contrast agent monocrystalline iron oxide nanocolloid (MION; up to a total amount of 10–15 mg/kg), injected through the jugular vein, were combined with single-slice dynamic susceptibility contrast-enhanced MRI [single-shot gradient recalled echo planar imaging (EPI); TR/TE = 175/22 ms; FOV = 25 × 25 mm2; 32 × 32 data matrix, zero-filled to 64 × 64; slice thickness 1.5 mm; 500 consecutive images]. Perfusion data were processed as described by Østergaard et al. (13), allowing mapping of the relative cerebral blood volume (rCBV) and relative cerebral blood flow index (rCBFi).
Multislice contrast-enhanced MRI (single-shot gradient recalled EPI; TR/TE = 2000/22 ms; 785 time points; FOV = 25 × 25 mm2; 32 × 32 data matrix, zero-filled to 64 × 64; nine 1.5 mm slices) was performed after the injections of MION. This method enables calculation of functional changes in CBV, by making use of the relationship between the change in signal intensity and the local rCBV (14, 15). Dynamic activation-induced rCBV changes were measured by acquiring contrast-enhanced functional MR images during electrical stimulation (4–5 V for 0.5 ms at 3 Hz during 60 s) first to the right and then (after 2 min) to the left forelimb (four runs, starting and ending with a stimulation off period). Functional activation maps were generated by a voxel-wise t test between the stimulated and nonstimulated conditions. P < 0.05 with Bonferroni correction was used as the statistical threshold for significant activation response. The total area of significant activation was calculated in each hemisphere. The laterality index, which expresses relative activity in the contralateral hemisphere as compared with the ipsilateral hemisphere, was defined as (C − I)/(C + I), where C and I are the total activation volumes in the hemisphere contralateral and ipsilateral to the stimulated forelimb, respectively. The time course of rCBV changes was averaged over four runs for each animal. Earlier studies have described a gradual rCBV rise to plateau in ≈30 s after onset of stimulation (15). In this study, the mean rCBV change during the last 30 s of the four stimulation runs (rCBVmax) was used as an index for the degree of activation.
Finally, the cerebrovascular reserve capacity was assessed by acquiring CBV-weighted images as described above, during 15–20 min inhalation of 5% CO2 (in balanced O2). We characterized rCBVmax as the mean rCBV change between 5 and 15 min after onset of 5% CO2 inhalation.
Histology.
After the MRI experiments, animals were killed and perfusion-fixed through the ascending aorta with heparinized saline, followed by 2% paraformaldehyde. Perfused brains were removed and postfixed overnight in 2% paraformaldehyde and 7.5% glycerol at 4°C, followed by storage in 15% glycerol and Tris-buffered saline at 4°C for 2 days. Coronal sections (50 μm) were cut on a vibrotome, mounted onto glass slides, and stained with hematoxylin and eosin (H&E). The infarct volume was determined from seven slices (from 4.7 to −7.3 mm from bregma) by means of a computer-interfaced imaging system (Bioquant, Nashville, TN), using the “indirect method,” and expressed as a percentage of the intact contralateral hemispheric volume (16). H&E-stained sections were also examined in specific regions-of-interest (ROIs; see below) to evaluate the local tissue status (17). Severe tissue damage (Grade 3) was characterized by tissue loss and/or diffuse pallor of the eosinophilic background. Moderate tissue damage (Grade 2) was characterized by vacuolation of the neuropil. Sponginess to entirely intact tissue, and/or scattered injured cells in predominantly intact tissue, was defined as mild tissue damage (Grade 1). Intact tissue with no signs of damage was classified as Grade 0.
Data Analysis.
ROI analyses were performed on MRI parameters by positioning ROIs [five voxels (1.14 mm3)] (i) in the area of most significant activation during stimulation of the unimpaired, right forelimb, (ii) in the ischemic core (area with Grade 3 tissue damage; i.e., the parietal cortex/lateral striatum), and (iii) in homologous contralateral regions. Histologic damage was measured in corresponding brain areas.
All values are expressed as mean ± SEM. Statistical comparisons were performed by using one-way analysis of variance (with repeated measures where appropriate) with post hoc Student–Newman–Keuls test. P values of less than 0.05 were considered significant.
Results
Stroke Location and Sensorimotor Function.
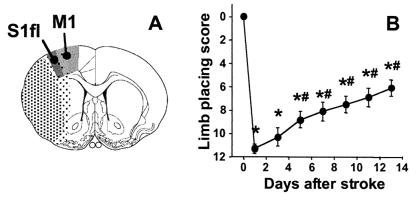
The Tamura model of unilateral occlusion of the middle cerebral artery (MCA) leads to infarction in the ipsilateral MCA territory, generally involving the lateral cortex and striatum (Fig. 1A). The sensorimotor cortex typically lies at the border of the ischemic lesion (9, 10), and becomes more or less affected depending on the severity of ischemia.
Figure 1.
(A) Schematic delineation of the location of cerebral infarction (stippled area) on an outline of a coronal rat brain section centered 0.7 mm from bregma [reproduced from Paxinos and Watson (18), with permission from Academic Press]. Dark stippling represents the ischemic core. The weakly stippled periphery, which includes the sensorimotor cortex, is irregularly affected. S1fl, forelimb region of the primary somatosensory cortex; M1, primary motor cortex (18). (B) Contralateral (left) forelimb placing scores as a function of time after unilateral (right) stroke (data from the 2 weeks animal group). *, P < 0.05 vs. before stroke; #, P < 0.05 vs. 1 day after stroke.
Unilateral stroke in the right cerebral hemisphere resulted in impairment of placing of the contralateral (left) forelimb. This sensorimotor dysfunction was maximal in the first 24 h after stroke onset and gradually returned to subnormal levels in the following 2 weeks (Fig. 1B). Beyond 5 days, sensorimotor function had significantly recovered from the impairment at day 1.
Ischemic Damage.
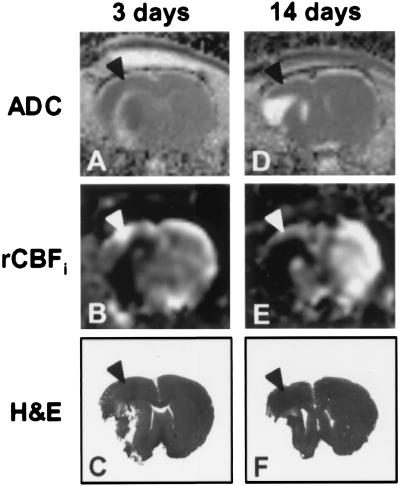
MRI and histology demonstrated a clear ischemic lesion in the right cerebral hemisphere involving the lateral cortex and underlying subcortical structures (Fig. 2). The infarct volume as determined from the histologic sections was 22.1% ± 1.4% of the contralateral hemisphere at 3 days, and 25.1% ± 2.7% at 14 days after stroke. The area of infarction exhibited increased T2-weighted signal intensity and low perfusion at both time points. At 3 days after stroke, ADC values in the lesion were usually reduced, pointing to cytotoxic edema (ref. 19; Fig. 2A). However, we also observed elevated ADC levels (e.g., along the white matter tracts), suggestive of cellular lysis (i.e., severe tissue degeneration) (20). It has been shown that initially reduced ADC values in ischemic lesions pseudonormalize around 3 days and increase thereafter (21). Accordingly, after 14 days the whole infarction had an elevated ADC (Fig. 2D).
Figure 2.
ADC maps (A and D), rCBFi maps (B and E), and hematoxylin and eosin (H&E)-stained sections (C and F) of a coronal rat brain slice at 3 (A–C) and 14 days after unilateral stroke (D–F). Each column represents data from a single animal. Note that M1/S1fl (arrowheads) was at the border of the lesion and relatively mildly affected.
Functional Activation.
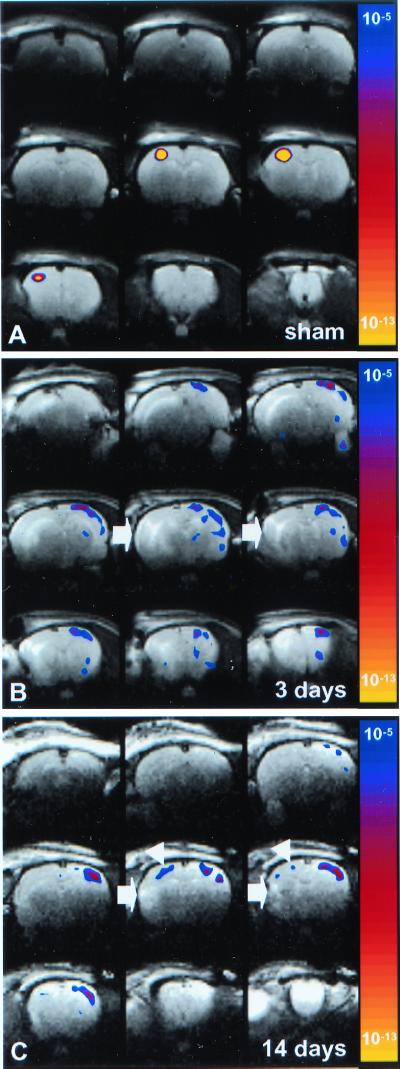
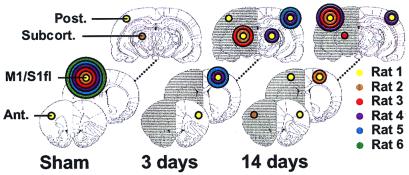
Stimulation of both the left and right limb in sham-operated rats, and stimulation of the unimpaired limb in rats with a stroke resulted in significant neuronal activation-induced rCBV changes in the forelimb region of the primary somatosensory cortex (S1fl) and the primary motor cortex (M1) (18), contralateral to the stimulated forelimb (Figs. 3A and 4). Occasionally, mild CBV responses were detected adjacent to S1fl. Nevertheless, the focus of activation was invariably in M1/S1fl. Fig. 5A demonstrates that overall activation in sham-operated rats was primarily in the contralateral hemisphere. Accordingly, the laterality indices were 1.00 ± 0.00 and 0.91 ± 0.06 for right and left forelimb stimulation, respectively. Stimulation of the unimpaired, right forelimb after stroke did not result in significantly different activation patterns as compared with sham-operated rats (Fig. 5 B and C; laterality indices: 0.81 ± 0.12 and 0.93 ± 0.05 at 3 and 14 days after stroke, respectively).
Figure 3.
T2-weighted images of coronal rat brain slices overlaid by statistical activation maps, calculated from the cross-correlation between the left (impaired) forelimb stimulation paradigm and local cerebral rCBV changes. The map of P values has been color-coded corresponding to the degree of significance. (A) 14 days after sham-operation (Rat 5); (B) 3 days after stroke (Rat 4); (C) 14 days after stroke (Rat 1). Left forelimb stimulation induced significant activation responses in the contralateral (right) M1/S1fl in sham-operated rats. At 3 days after stroke, no significant activation was detected in the right, ipsilesional M1/S1fl. However, clear responses were found in the contralesional hemisphere, extending over the entire neocortex. After 14 days, activation responses appeared both contralesional and ipsilesional; however, shifted from M1/S1fl (white arrowheads). The area of infarction is characterized by increased T2-weighted signal intensity (white arrows).
Figure 4.
Distribution of regions that exhibited significant activation responses on stimulation of the left (impaired) forelimb, schematically represented on coronal rat brain sections at 2.7, 0.7, and −5.3 mm from bregma. For the sake of clarity, regions are divided into four main areas: (i) M1/S1fl; (ii) anterior (Ant.) vicinity of M1/S1fl (i.e., face region of S1; cingulate cortex; insular cortex); (iii) posterior (Post.) vicinity of M1/S1fl (i.e., hindlimb, barrel field, dysgranular, and trunk region of S1; parietal association cortex; visual cortex); and (iv) subcortical (Subcort.) (thalamus; superior colliculus). The radius of the colored circles corresponds with the number of animals that showed significant activation responses in the specific brain region (P < 5 × 10⁻⁵ was considered significant). The different colors represent individual animals in the sham-operated group, the 3 days stroke group, and the 14 days stroke group. The ipsilesional (right) hemisphere is shaded.
Figure 5.
Total area of significant activation responses in the right (ipsilesional) hemisphere (gray bars) and left (contralesional) hemisphere (white bars) during stimulation of the right and left forelimb in sham-operated rats (A), and in rats at 3 (B) and 14 days (C) after stroke. *, P < 0.05 vs. sham-operated rats; #, P < 0.05 vs. 3 days after stroke. The right (R, ipsilesional; gray) and left (L, contralesional; white) hemispheres and the ischemic lesion (stippled) are schematically represented on inserted outlines of a coronal rat brain section.
At 3 days after stroke, there was no significant activation-induced response in the ipsilesional sensorimotor cortex (see Figs. 3B and 4). However, clear activation-induced responses were detected in the contralesional hemisphere—i.e., ipsilateral to the stimulated paw—in three of six animals (Figs. 3B, 4, and 5B). Areas of activation involved various cortical regions, including areas that are normally not involved with sensorimotor function of the forelimb (e.g., face, barrel field, hindlimb, and visual regions of S1). The significant involvement of the contralesional hemisphere, in combination with reduced ipsilesional activity, was also expressed by the negative mean laterality index (−0.30 ± 0.41, P < 0.05 vs. sham-operated rats). Ipsilesional activation was largely subcortical (see Fig. 4); distinct responses were found bilaterally in the thalamus and superior colliculus. Clear activation responses to impaired limb stimulation were absent in one animal.
At 14 days after stroke, modest but clear rCBV changes in response to stimulation of the impaired forelimb were detected in both the ipsi- and contralesional hemisphere (Figs. 3C and 4). Activation was still reduced in the affected hemisphere, but ipsilesional activity was now mainly found in the cortex (see Fig. 4). The focus of ipsilesional activation, however, was not in the forelimb region of the sensorimotor cortex. Remote areas, at the medial, anterior and/or posterior border of the ischemic lesion, exhibited significant responses. Activation in the contralesional hemisphere was less extensive than at 3 days after stroke. The laterality index (0.23 ± 0.45) was not significantly different as compared with sham-operated rats. In one animal, distinct activation responses to impaired limb stimulation were not detected.
Activation Response, Cerebrovascular Reactivity, and Tissue and Perfusion Status.
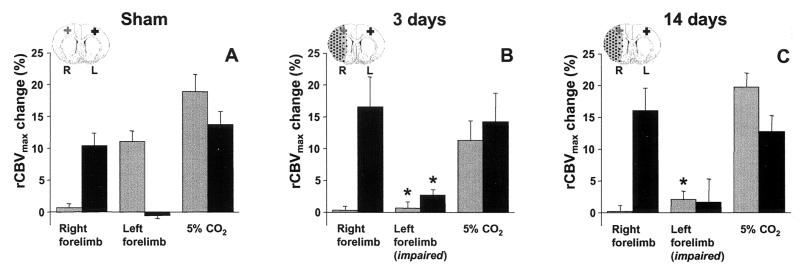
Stimulation of the right/unimpaired limb resulted in a rCBVmax of 10–20% in the left/contralesional M1/S1fl in all animal groups (Fig. 6). The CO2 challenge raised the arterial pCO2 from 35.4 ± 2.3 to 59.7 ± 2.2 mmHg (1 mmHg = 133 Pa), which led to a rCBV increase of ≈15% in this region (Fig. 6). In the right M1/S1fl of sham-operated rats, stimulation of the contralateral forelimb and the CO2 challenge resulted in similar responses. However, in rats with a stroke, stimulation-induced rCBVmax in the right, ipsilesional M1/S1fl was significantly reduced (Fig. 6 B and C). Nevertheless, the CO2-induced rCBVmax within the same region was not significantly different from contralateral. In the ischemic core, however, rCBVmax during CO2 inhalation was greatly diminished (2.9% ± 2.6% and 6.6% ± 7.9% after 3 and 14 days, respectively) as compared with sham-operated rats (15.0% ± 4.1%, P < 0.05). Finally, note that a significant rCBVmax raise in the contralesional M1/S1fl accompanied stimulation of the impaired forelimb at 3 days after stroke (Fig. 6B).
Figure 6.
Plateau rCBV change (rCBVmax) in the right (ipsilesional; gray bars) and left (contralesional; black bars) M1/S1fl during stimulation of the right (unimpaired) and left (impaired) forelimb, and during 5% CO2 inhalation, in sham-operated rats (A), and in rats at 3 (B) and 14 days (C) after stroke. *, P < 0.05 vs. sham-operated rats. ROIs in the right (R, ipsilesional; gray cross) and left (L, contralesional; black cross) M1/S1fl are schematically represented on inserted outlines of a coronal rat brain section. The ischemic lesion is stippled.
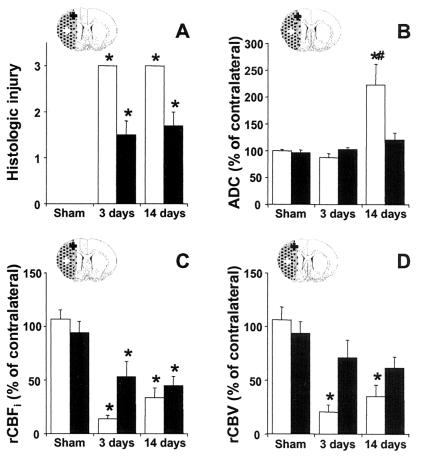
Results of ROI analysis of tissue and perfusion status are shown in Fig. 7. As expected, damage was severe in the infarcted ischemic core (Fig. 7A). The ADC was lowered after 3 days and highly elevated after 14 days (Fig. 7B). Histology confirmed that M1/S1fl was located in the periphery of the lesion as local tissue injury was mild to moderate (Fig. 7A). The rCBFi was reduced, but not as strong as in the ischemic core (Fig. 7C). The ADC and rCBV were not significantly altered (Fig. 7 B and D).
Figure 7.
Histologic tissue injury (A), relative ADC (B), rCBFi (C), and rCBV (D) in the ischemic core (white bars) and in ipsilesional M1/S1fl (black bars) at 3 and 14 days after stroke. *, P < 0.05 vs. sham-operated rats; #, P < 0.05 vs. 3 days after stroke. ROIs in the ipsilesional M1/S1fl (black cross) and ischemic core (white cross) are schematically represented on inserted outlines of a coronal rat brain section. The ischemic lesion is stippled.
Conclusions
In this study we used functional MRI to assess the spatial and temporal dynamics of brain reorganization in relation to functional recovery and cerebral pathophysiology after stroke in a rat model. Unilateral stroke resulted in infarction of the ipsilateral lateral cortex and underlying striatum, and led to loss of sensorimotor function of the contralateral forelimb. Dysfunction of the hemiplegic limb was associated with loss of brain activity in M1/S1fl, despite relatively mild tissue and perfusion impairment and normal cerebrovascular reactivity. Restoration of sensorimotor function was accompanied by contralesional activation and recruitment of perilesional cortical areas. Contralesional activity was particularly evident early after stroke when sensorimotor function was still seriously impaired. At later stages, the relative involvement of the ipsilesional cortex increased and sensorimotor function partially recovered. Yet, we were not able to detect a statistically significant correlation between the pattern of brain activation and the degree of functional recovery.
We measured activation responses by use of contrast-enhanced, CBV-weighted functional MRI. This method enables imaging of brain activation patterns with relatively high temporal and spatial resolution, and enhanced contrast-to-noise ratio (15, 22). Our findings exclude inadequate local delivery and concentration of contrast agent as main causes of diminished activation responses, because unaltered CBV and residual CBF in the ipsilesional M1/S1fl ensured accumulation of contrast agent. Also, with the CO2 challenge we found normal vasoreactivity, which needs to be preserved for neuronal activity-coupled vascular responses. Yet, this does not rule out possible derangements of neuronal–vascular coupling. Different, potentially interacting pathophysiological mechanisms may be responsible for the loss of stimulus-evoked activation responses in mildly affected M1/S1fl. Importantly, damage to remote sensorimotor areas with efferent and/or afferent projections may lead to denervation of M1/S1fl. In fact, the caudate putamen, internal capsule, and secondary somatosensory cortex, all part of the sensorimotor network, were regularly included in the lesion area. Other factors could be depression of M1/S1fl by massive tissue injury and edematous swelling in the adjacent parietal cortex and striatum, and selective neuronal necrosis in M1/S1fl (in intact neuropil). Finally, ischemia in M1/S1fl below the threshold level for irreversible damage but above the threshold for neuronal dysfunction may cause functional deterioration of surviving neurons. Interestingly, the latter corresponds with the ischemic penumbra—i.e., functionally inactive, but viable and potentially salvageable tissue (23, 24). Correspondingly, Schmitz et al. (25, 26) have reported loss of stimulus-evoked hemodynamic responses that slowly recovered but were still significantly suppressed up to 1 day after 10 min of cardiac arrest in rats, despite normal CO2 responsiveness and recovery of the ADC. In addition, in rats treated with isradipine after middle cerebral artery (MCA) occlusion, forelimb motor function, and brain activation responses remained impaired after 24 h, although the structural integrity of the sensorimotor cortex was apparently preserved (27). Dietrich et al. (28) observed a depressed cerebral metabolic rate of glucose utilization in the cortex during whisker stimulation in rats at postischemic days 1–3, which normalized after 5 days. Regained activation in M1/S1fl at 14 days after stroke, as seen in some of our animals, could reflect restoration of neuronal function, which may significantly contribute to sensorimotor functional recovery.
In correspondence with previous functional MRI studies in human stroke subjects (29, 30), we found extended contralesional activation and periinfarct activation foci during early and late stages of poststroke functional recovery. Our results are in close agreement with a recent functional MRI study in humans, in which enhanced contralesional activity was found early after stroke followed by a relative increase of ipsilesional activity at chronic stages (31). Two main mechanisms for reorganizational changes that may explain plastic changes in activation patterns after stroke have been considered: (i) unmasking or strengthening of existing pathways through disinhibition and/or potentiation, and (ii) formations of new neuronal circuitry by neuronal sprouting and/or synaptogenesis (2–6). First, electrophysiological recordings have revealed an increased excitability and increased long-term potentiation of synaptic efficacy in areas surrounding cortical ischemic lesions and in contralateral areas after focal cerebral ischemia in rats (32). Second, immunohistochemical studies in rats have provided evidence for sprouting of fibers from surviving neurons and formation of new synapses in periinfarct cortical zones and in the contralesional cortex following ischemic stroke (10, 33–35).
Our data suggest that the stimulation-evoked responses in the contralesional hemisphere relatively early after stroke are related to unmasking/potentiation of present neuronal circuitry, because the formation of new anatomic connections requires several days to develop and peaks weeks after stroke (33, 35). The acute increased excitability may be mediated by a decrease in GABAergic (γ-aminobutyric acid) inhibition and/or an increase in glutamatergic responses, which have been found in the contralesional hemisphere early after stroke (32). Functional changes in brain regions remote from the site of focal cerebral damage could be due to loss of transhemispheric axonal or metabolic input (36). Our study demonstrated serious injury to white matter tracts in the ipsilesional hemisphere. Degeneration of transcallosal cortical projections, which are predominantly inhibitory, could explain unmasking of lateral excitatory projections and consequent increased activity.
The role of this enhanced contralesional activation in functional recovery after stroke is unclear. It may directly aid in restoration of ipsilateral limb function, through potentiation of uncrossed corticospinal pathways. However, contralesional activity was maximal early after stroke, when sensorimotor function was still seriously impaired, and it was reduced at the stage of significant functional recovery. Nevertheless, contralesional responses were still present after 14 days. Reinforcement of the ipsilateral corticoreticulospinal pathway may be responsible for residual sensorimotor functions acutely after stroke. Also, the contralesional hemisphere may play a more indirect, adaptive role by supporting ipsilesional activity. Yet, activation responses nonspecific to the sensorimotor network might also reflect epiphenomenologic activity due to broad disinhibition.
In addition to the widespread contralesional responses, significant bilateral subcortical activity was detected in the thalamus and superior colliculus, particularly after 3 days. Involvement of the thalamus, which acts as a relay station processing sensorimotor information with bilateral connections to the cortex, and the superior colliculus, which is a multisensory integration center, could subserve cortical reorganization, both in the contra- and ipsilesional hemisphere.
After 2 weeks, sensorimotor function had recovered to subnormal levels. This was accompanied by increased involvement of ipsilesional cortical areas. Return of activation in M1/S1fl may reflect resumption of local neuronal function. However, most ipsilesional activity was found adjacent to M1/S1fl, suggesting redistribution of the sensorimotor network. Extended perilesional cortical activation may involve modification of existing neuronal circuitry, as well as growth of new connections, which may be the principle basis of long-term functional recovery after stroke.
In conclusion, this study demonstrates that cortical and subcortical reorganization after experimental stroke can be assessed with high sensitivity by use of contrast-enhanced functional MRI. Widespread activation responses in the unaffected hemisphere early after stroke did not appear to be straightforwardly associated with functional recovery. Our data suggest that restored function may be more directly correlated with gradual reinstatement of representational neuronal fields and/or recruitment of perilesional networks. These findings of biphasic cerebral rearrangements underlying functional reinstatement may give insights into the neurophysiological mechanisms through which neurorehabilitative therapies facilitate restoration of function, which could contribute to the optimization of therapeutic approaches to improve stroke recovery. With its potential to serially map recovery-related events, the experimental model described in this study may significantly contribute to preclinical evaluation of therapies targeting stroke recovery. Finally, to elucidate the relationship between brain reorganization and functional recovery in more detail, future studies should focus on measuring functional and neural responses on the same paradigm.
Acknowledgments
We thank Drs. John J. A. Marota and Hiroshi Nakajima for expert technical assistance, and Drs. Judith D. Schaechter and Ken K. Kwong for valuable discussions. This study was sponsored by National Institutes of Health Grants P50-NS10828, RO1-HL39810, P01-CA48729, P41-RR14075, and RO1-NS38477. R.M.D. was supported by a stipend from the Netherlands Organization for Scientific Research (NWO) and part of this work was done during the tenure of a fellowship from the American Heart Association, New England Affiliate.
Abbreviations
- MRI
magnetic resonance imaging
- ADC
apparent diffusion coefficient
- rCBV
relative cerebral blood volume
- rCBFi
relative cerebral blood flow index
- rCBVmax
plateau rCBV change
- ROI
region-of-interest
- S1fl
forelimb region of the primary somatosensory cortex
- M1
primary motor cortex
Footnotes
This paper was submitted directly (Track II) to the PNAS office.
References
- 1.Bogousslavsky J, Van Melle G, Regli F. Stroke. 1988;19:1083–1092. doi: 10.1161/01.str.19.9.1083. [DOI] [PubMed] [Google Scholar]
- 2.Lee R G, van Donkelaar P. Can J Neurol Sci. 1995;22:257–263. doi: 10.1017/s0317167100039445. [DOI] [PubMed] [Google Scholar]
- 3.Seil F J. Curr Opin Neurol. 1997;10:49–51. [PubMed] [Google Scholar]
- 4.Steinberg B A, Augustine J R. Brain Res Brain Res Rev. 1997;25:125–132. doi: 10.1016/s0165-0173(97)00013-1. [DOI] [PubMed] [Google Scholar]
- 5.Weiller C. Exp Brain Res. 1998;123:13–17. doi: 10.1007/s002210050539. [DOI] [PubMed] [Google Scholar]
- 6.Johansson B B. Stroke. 2000;31:223–230. doi: 10.1161/01.str.31.1.223. [DOI] [PubMed] [Google Scholar]
- 7.Jenkins W M, Merzenich M M. Prog Brain Res. 1987;71:249–266. doi: 10.1016/s0079-6123(08)61829-4. [DOI] [PubMed] [Google Scholar]
- 8.Nudo R J, Milliken G W. J Neurophysiol. 1996;75:2144–2149. doi: 10.1152/jn.1996.75.5.2144. [DOI] [PubMed] [Google Scholar]
- 9.Tamura A, Graham D I, McCulloch J, Teasdale G M. J Cereb Blood Flow Metab. 1981;1:53–60. doi: 10.1038/jcbfm.1981.6. [DOI] [PubMed] [Google Scholar]
- 10.Kawamata T, Dietrich W D, Schallert T, Gotts E, Cocke R R, Benowitz L I, Finklestein S P. Proc Natl Acad Sci USA. 1997;94:8179–8184. doi: 10.1073/pnas.94.15.8179. [DOI] [PMC free article] [PubMed] [Google Scholar]
- 11.De Ryck M, Van Reempts J, Duytschaever H, Van Deuren B, Clincke G. Brain Res. 1992;573:44–60. doi: 10.1016/0006-8993(92)90112-m. [DOI] [PubMed] [Google Scholar]
- 12.van Gelderen P, de Vleeschouwer M H, DesPres D, Pekar J, van Zijl P C, Moonen C T. Magn Reson Med. 1994;31:154–163. doi: 10.1002/mrm.1910310209. [DOI] [PubMed] [Google Scholar]
- 13.Østergaard L, Weisskoff R M, Chesler D A, Gyldensted C, Rosen B R. Magn Reson Med. 1996;36:715–725. doi: 10.1002/mrm.1910360510. [DOI] [PubMed] [Google Scholar]
- 14.Hamberg L M, Boccalini P, Stranjalis G, Hunter G J, Huang Z, Halpern E, Weisskoff R M, Moskowitz M A, Rosen B R. Magn Reson Med. 1996;35:168–173. doi: 10.1002/mrm.1910350207. [DOI] [PubMed] [Google Scholar]
- 15.Mandeville J B, Marota J J, Kosofsky B E, Keltner J R, Weissleder R, Rosen B R, Weisskoff R M. Magn Reson Med. 1998;39:615–624. doi: 10.1002/mrm.1910390415. [DOI] [PubMed] [Google Scholar]
- 16.Swanson R A, Morton M T, Tsao-Wu G, Savalos R A, Davidson C, Sharp F R. J Cereb Blood Flow Metab. 1990;10:290–293. doi: 10.1038/jcbfm.1990.47. [DOI] [PubMed] [Google Scholar]
- 17.Li Y, Powers C, Jiang N, Chopp M. J Neurol Sci. 1998;156:119–132. doi: 10.1016/s0022-510x(98)00036-7. [DOI] [PubMed] [Google Scholar]
- 18.Paxinos G, Watson C. The Rat Brain in Stereotaxic Coordinates. San Diego: Academic; 1997. [DOI] [PubMed] [Google Scholar]
- 19.Moseley M E, Cohen Y, Mintorovitch J, Chileuitt L, Shimizu H, Kucharczyk J, Wendland M F, Weinstein P R. Magn Reson Med. 1990;14:330–346. doi: 10.1002/mrm.1910140218. [DOI] [PubMed] [Google Scholar]
- 20.Pierpaoli C, Righini A, Linfante I, Tao-Cheng J H, Alger J R, Di Chiro G. Radiology. 1993;189:439–448. doi: 10.1148/radiology.189.2.8210373. [DOI] [PubMed] [Google Scholar]
- 21.Jiang Q, Chopp M, Zhang Z G, Knight R A, Jacobs M, Windham J P, Peck D, Ewing J R, Welch K M. J Neurol Sci. 1993;120:123–130. doi: 10.1016/s0022-510x(96)00286-9. [DOI] [PubMed] [Google Scholar]
- 22.van Bruggen N, Busch E, Palmer J T, Williams S P, de Crespigny A J. J Cereb Blood Flow Metab. 1998;18:1178–1183. doi: 10.1097/00004647-199811000-00003. [DOI] [PubMed] [Google Scholar]
- 23.Astrup J, Siesjo B K, Symon L. Stroke. 1981;12:723–725. doi: 10.1161/01.str.12.6.723. [DOI] [PubMed] [Google Scholar]
- 24.Siesjö B K. J Neurosurg. 1992;77:169–184. doi: 10.3171/jns.1992.77.2.0169. [DOI] [PubMed] [Google Scholar]
- 25.Schmitz B, Bottiger B W, Hossmann K A. J Cereb Blood Flow Metab. 1997;17:1202–1209. doi: 10.1097/00004647-199711000-00009. [DOI] [PubMed] [Google Scholar]
- 26.Schmitz B, Bock C, Hoehn-Berlage M, Kerskens C M, Bottiger B W, Hossmann K A. Magn Reson Med. 1998;39:783–788. doi: 10.1002/mrm.1910390516. [DOI] [PubMed] [Google Scholar]
- 27.Reese T, Porszasz R, Baumann D, Bochelen D, Boumezbeur F, McAllister K H, Sauter A, Bjelke B, Rudin M. NMR Biomed. 2000;13:361–370. doi: 10.1002/1099-1492(200010)13:6<361::aid-nbm654>3.0.co;2-c. [DOI] [PubMed] [Google Scholar]
- 28.Dietrich W D, Ginsberg M D, Busto R. J Cereb Blood Flow Metab. 1986;6:405–413. doi: 10.1038/jcbfm.1986.73. [DOI] [PubMed] [Google Scholar]
- 29.Cramer S C, Nelles G, Benson R R, Kaplan J D, Parker R A, Kwong K K, Kennedy D N, Finklestein S P, Rosen B R. Stroke. 1997;28:2518–2527. doi: 10.1161/01.str.28.12.2518. [DOI] [PubMed] [Google Scholar]
- 30.Cao Y, D'Olhaberriague L, Vikingstad E M, Levine S R, Welch K M. Stroke. 1998;29:112–122. doi: 10.1161/01.str.29.1.112. [DOI] [PubMed] [Google Scholar]
- 31.Marshall R S, Perera G M, Lazar R M, Krakauer J W, Constantine R C, DeLaPaz R L. Stroke. 2000;31:656–661. doi: 10.1161/01.str.31.3.656. [DOI] [PubMed] [Google Scholar]
- 32.Witte O W, Bidmon H J, Schiene K, Redecker C, Hagemann G. J Cereb Blood Flow Metab. 2000;20:1149–1165. doi: 10.1097/00004647-200008000-00001. [DOI] [PubMed] [Google Scholar]
- 33.Jones T A, Schallert T. Brain Res. 1992;581:156–160. doi: 10.1016/0006-8993(92)90356-e. [DOI] [PubMed] [Google Scholar]
- 34.Stroemer R P, Kent T A, Hulsebosch C E. Stroke. 1995;26:2135–2144. doi: 10.1161/01.str.26.11.2135. [DOI] [PubMed] [Google Scholar]
- 35.Jones T A, Kleim J A, Greenough W T. Brain Res. 1996;733:142–148. doi: 10.1016/0006-8993(96)00792-5. [DOI] [PubMed] [Google Scholar]
- 36.Andrews R J. Stroke. 1991;22:943–949. doi: 10.1161/01.str.22.7.943. [DOI] [PubMed] [Google Scholar]


