

Summary
α-Synuclein (α-Syn) aggregation is a key event in Parkinson's disease (PD). Mutations in glycosphin-golipid (GSL)-degrading glucocerebrosidase are risk factors for PD, indicating that disrupted GSL clearance plays a key role in α-Syn aggregation. However, the mechanisms of GSL-induced aggregation are not completely understood. We document the presence of physiological α-Syn conformers in human midbrain dopamine neurons and tested their contribution to the aggregation process. Pathological α-Syn assembly mainly occurred through the conversion of high molecular weight (HMW) physiological α-Syn conformers into compact, assembly-state intermediates by glucosylceramide (GluCer), without apparent disassembly into free monomers. This process was reversible in vitro through GluCer depletion. Reducing GSLs in PD patient neurons with and without GBA1 mutations diminished pathology and restored physiological α-Syn conformers that associated with synapses. Our work indicates that GSLs control the toxic conversion of physiological α-Syn conformers in a reversible manner that is amenable to therapeutic intervention by GSL reducing agents.
Graphical abstract
Zunke et al. found that glycosphingolipids that accumulate in Gaucher disease cause a reversible structural change in Parkinson's protein α-Synuclein, promoting its aggregation and toxicity. In patient-derived midbrain dopamine neurons, glycosphingolipid reduction restored physiological α-Synuclein conformers and diminished pathology.
Introduction
Protein inclusions made of insoluble amyloid aggregates are characteristic pathological features of several degenerative diseases (Eisele et al., 2015). In Parkinson's disease (PD), α-Synuclein (α-Syn) converts from a soluble synaptic protein into insoluble amyloid fibrils found within affected neurites and cell bodies of midbrain dopamine neurons (Goedert et al., 2013). In vitro studies using recombinant purified α-Syn have indicated that the protein exists as an unstructured monomer in solution (Weinreb et al., 1996). The conversion of unfolded monomers into amyloid fibrils occurs through a nucleated polymerization mechanism characterized by a lag time before amyloid is detectable, when soluble monomers convert into soluble oligomeric intermediates (Han et al., 1995; Wood et al., 1999). Oligomeric intermediates serve as nuclei that subsequently seed amyloid fibril growth (Lansbury, 1997). More recent in vitro studies have indicated that polymerization occurs through a two-step nucleation process in which aggregation-prone monomers can initially form a less-structured pre-nucleus, which slowly rearranges into stable, protease-resistant, and aggregation-competent nuclei (Cremades et al., 2012). However, it is unknown if α-Syn aggregation proceeds in a similar way in human midbrain neurons.
While studies using recombinant α-Syn purified from sources such as E. coli have provided valuable insight into the aggregation mechanism in vitro, the structure of the isolated recombinant protein may differ from physiological forms found within human neurons. For example, monomers and higher-order conformers of α-Syn have been documented under physiological conditions, some with defined quaternary structure (Bartels et al., 2011; Burré et al., 2014; Cole et al., 2002; Gould et al., 2014; Wang et al., 2011, 2014). Interestingly, in vitro experiments have shown that α-Syn mutations that cause familial PD, such as A53T, reduce the multimer/monomer ratio, elevating levels of aggregation-prone monomers (Dettmer et al., 2015; Wang et al., 2011). Our previous in vivo studies using synucleinopathy animal models indicated that both monomers and innocuous high molecular weight (HMW) α-Syn assemblies exist in healthy brain regions, while structurally distinct, assembly-competent oligomers of the same molecular radius are found in pathological regions (Tsika et al., 2010). The state of α-Syn under physiological conditions likely depends on cellular environments such as the presence of lipid vesicles (Cole et al., 2002; Davidson et al., 1998) and physiological protein concentration (Luth et al., 2015), which can only be achieved in a natural cellular context of endogenously controlled synthesis and degradation machinery. The dynamic structural nature of α-Syn under physiological conditions necessitates an accurate cellular model to define the critical initial steps in the conversion process that ultimately lead to pathological aggregation.
Here, we document the presence of distinct physiological α-Syn conformers within human midbrain neurons and investigate their role in the mechanism of aggregation using induced pluripotent stem cell (iPSC)-derived neuronal models that accumulate glycosphingolipids (GSLs), such as glucosylceramide (GluCer) and glucosylsphingosine (GluSph). GSL accumulation occurs in the lysosomal storage disorder Gaucher disease (GD) from loss-of-function mutations in glucocerebrosidase (GCase) (Grabowski, 2008). The link of PD with GD was first noted through clinical observations of patients with type I GD, where GD patients were occasionally noted to develop PD symptoms (Neudorfer et al., 1996). First degree relatives of these patients that carry GBA1 mutations were also found to develop PD at a higher than expected frequency (Goker-Alpan et al., 2004). Subsequently, a large genetic study was performed on idiopathic PD patients, demonstrating that GCase mutations are strong genetic risk factors for developing the disease (Sidransky et al., 2009). All of the disease-causing GBA1 mutations result in loss of enzyme function through mutations that either destabilize the protein fold (such as L444P or N370S) or prevent synthesis of the full-length protein through frameshifts (such as c.dup84G). However, the contribution of these mutations to neuronal dysfunction is not completely understood (Siebert et al., 2014). Previous studies have indicated that GluCer leads to pathogenic insoluble α-Syn through promoting aggregation under acid conditions of the lysosome, leading to neurotoxicity (Mazzulli et al., 2011). Lewy bodies have been documented in Gaucher brain (Wong et al., 2004), suggesting that α-Syn aggregation is involved in neurotoxicity induced by GBA1 mutations. Reduced GCase activity and GSL accumulation have been documented in sporadic PD patients expressing wild-type (WT) GCase (Alcalay et al., 2015; Gegg et al., 2012; Mazzulli et al., 2011; Murphy et al., 2014; Rocha et al., 2015), possibly through α-Syn accumulation (Mazzulli et al., 2011; Yap et al., 2013), suggesting a more general role for GSLs in sporadic synucleinopathies. Despite the critical importance of GCase function in synucleinopathies, the mechanism of GSL-induced aggregate formation in human neurons is not known. Here, we utilized a combination of cell-free in vitro models and iPS neurons (iPSns) to study the mechanism of this process.
Results
Establishment of a Human Midbrain Model of GSL-Induced α-Syn Aggregation
To study the mechanism of GSL-induced α-Syn aggregation in a context that preserves the physiological state of α-Syn, we established a human iPSC-derived midbrain culture model (iPSn) that permitted control over the initiation of aggregation through pharmacological inhibition of GCase. Treatment of iPSns derived from healthy controls expressing WT GCase with GCase inhibitors conduritol-b-epoxide (CBE) or isofagomine (IFG) resulted in accumulation of GCase substrates with little secondary accumulation, indicating compound specificity (Figures S1A–S1F). Assessment of aggregated α-Syn by sequential extraction/western blot at different times after inhibitor addition showed that insoluble α-Syn was elevated at 7 days, while no change was observed in total soluble levels at any time point examined (Figure 1A). Consistent with the presence of insoluble α-Syn at 7 days, fixed CBE-treated neurons stained positive for thioflavin S with either diffuse cytosolic staining (Figure 1Bi) or large juxta-nuclear inclusions (Figure 1Bii), indicating the presence of amyloidogenic α-Syn. At the ultrastructural level, accumulation of enlarged electron-lucent vacuoles in the cytoplasm of 7 day CBE-treated neurons was apparent, including multi-lamellar membranous components (Figure 1C, right, white arrow) and pseudotubular structures (Figure 1Di). These data are consistent with lipid accumulation and are thought to occur from lipid-laden lysosomes (Farfel-Becker et al., 2014; Lee, 1968; Takahashi and Naito, 1985; Willemsen et al., 1995). Fibrillogranular inclusions of ca. 10 nm in diameter were noted within vacuoles of CBE-treated neurons (Figures 1Cii, 1Dii, and 1Diii), as well as accumulations of annular structures of 20 nm in diameter containing a 2 nm pore, which were not observed in control neurons (Figures S1Gi–S1Giv). Annular structures were occasionally observed to coalesce in a linear manner that protruded from membranous fragments, resembling a loosely assembled fibril (Figure S1Gi and S1Gv). Analysis of CBE-treated cells depleted of α-Syn eliminated the presence of vacuoles containing fibrillar structures, although membrane accumulations persisted in the absence of α-Syn (Figures S1H and S1I). Comparison of the CBE model with GD neurons (N370S/c.84dupG) showed similar features of multivesicular bodies and fibrillar inclusions within disrupted vacuoles (Figure S1J). Biochemical analysis showed accumulation of insoluble α-Syn in GD neurons at a similar level to CBE-treated WT neurons (Figures 1A and S1K). Together, these data indicate that the pharmacological model recapitulates key pathological features of GD neurons. α-Syn accumulation by CBE in the absence of GBA1 mutations indicates that loss of activity and lipid accumulation are sufficient to induce pathologic changes in human neurons.
Figure 1. GSL Accumulation Induces Pathological α-Syn Aggregates in Human Midbrain iPSns.
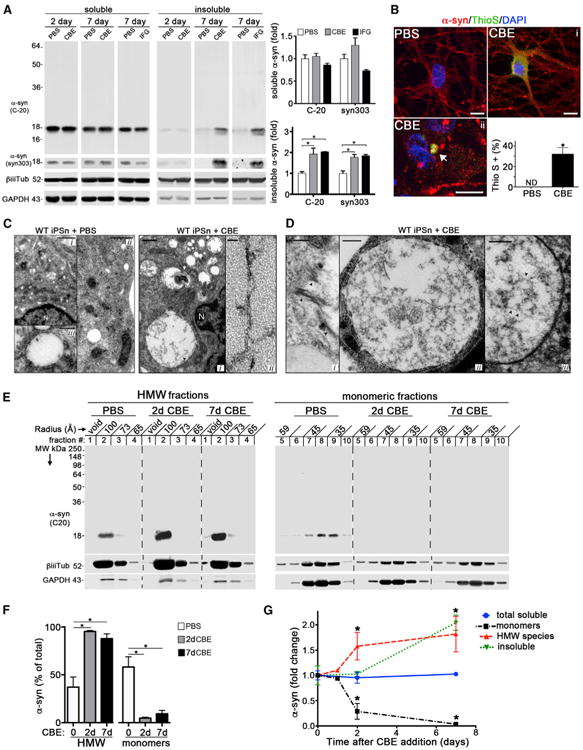
(A) iPSC-derived midbrain dopamine neurons from healthy control lines were treated for 2 or 7 days with GCase inhibitors CBE or IFG (50 μM) and phosphate buffered saline (PBS) as a control. Neurons were subjected to sequential extraction followed by western blot using α-Syn antibodies C-20 and syn303. β-iii-tubulin (tub) and GAPDH were used as loading controls. Right: quantification of the blots (n = 4).
(B) Immunofluorescence analysis of α-Syn- (red) or thioflavin S- (Thio S, green) positive neurons as diffuse (i) or punctated inclusions (ii) after a 7 day treatment with 50 μM CBE. Nuclei were detected with DAPI (blue). The arrow indicates a representative amyloidogenic inclusion. Scale bars, 5 μm.
(C) Left: electron microscopy (EM) analysis of WT control iPSns showing normal morphology of vesicles in the cytoplasm (i and ii) and a close-up of membrane delimited electron lucent vesicles (iii). Scale bars, 1 (i), 0.5 (ii), and 0.25 μm (iii). N, nucleus. Right: EM analysis of 7 day CBE-treated WT iPSns showing accumulation of vesicles and multilamellar membrane inclusions (i, white arrow) or fibrillogranular material accumulating in enlarged vacuoles. (ii) shows a close-up of the fibrillar material indicated with the black arrow in (i). Scale bars, 200 (i) and 25 nm (ii).
(D) Tubular (i) or fibrillar (ii and iii) accumulations indicated by black arrows within enlarged vacuoles of 7 day CBE-treated iPSns. Scale bars, 100 (i and iii) and 200 nm (ii).
(E) Soluble lysates were analyzed by native SEC (inputs shown in A). HMW (#1–4) and monomeric fractions (#5–10) were analyzed by western blot. Molecular radius is shown horizontally in angstroms (Å).
(F) Quantification of western blot in (E) (n = 5).
(G) Measurement of α-Syn from CBE-treated iPSns by SEC/ELISA (soluble monomers or HMW species) or sequential extraction (total soluble or insoluble) (n = 4).For all quantifications, values are the mean ± SEM, *p < 0.05. For all blots, MW is shown vertically in kilodaltons (kDa).
Human Midbrain iPSns Contain Distinct α-Syn Conformers under Physiological Conditions
We next examined the size exclusion properties of α-Syn in soluble lysates of iPSns from healthy controls by size exclusion chromatography (SEC) analysis. Using native extraction methods, we documented the presence of two distinct α-Syn forms eluting as either a 100 Å radius-sized HMW species, or a low molecular weight (LMW) species of 35 Å in radius consistent with an unfolded monomer (Weinreb et al., 1996) (Figure S2A). Analysis of control proteins with well-established native structures, including neuron-specific enolase (NSE) and glyceraldehyde 3-phosphate dehydrogenase (GAPDH), showed the expected MW, indicating that the lysis procedure did not induce MW changes in these proteins(Figure S2A).The HMW α-Syn form occurred as a cellular process, since it was not detected when purified monomeric α-Syn was incubated with lysis buffer in vitro (Figure S2B),or when monomers were incubated with iPSn lysate of α-Syn knockout (KO) lines (Figure S2C). To further probe the nature of the two α-Syn species, we established an immunofluorescence resonance energy transfer (FRET) assay using a validated monoclonal antibody against α-Syn (syn211) conjugated to either Alexa 488 or 647. Since syn211 can only bind once per α-Syn molecule (residues 121–125), FRET only occurs when monomers are coalesced or closely associated. We tested this method with recombinant α-Syn fibrils and detected a strong FRET signal, reflecting the tightly packed, polymerized structure of the protein (Figure S2D). However, no signal was observed from recombinant purified monomers, or when fibrils were incubated with donor antibody alone (Figure S2D). We then tested HMW fractions from human iPSns containing α-Syn and found a significant FRET signal, while little signal was detected in LMW fractions (Figure S2D). These data indicate that the HMW fraction contains multiple copies of α-Syn, some of which may be self-associated oligomers, while the 35 Å-sized species likely represents a natively unfolded monomer as previously noted (Weinreb et al., 1996). The presence of multiple α-Syn conformers of distinct sizes within human iPS midbrain neurons is in agreement with previous studies (Dettmer et al., 2016).
GSL-Induced HMW α-Syn Is Structurally Distinct from Physiological Conformers
We next examined changes in soluble conformers that occur at different stages of GSL-induced aggregation in human neurons. We first measured the kinetics of lipid accumulation upon CBE treatment and found that lipid elevations occurred as early as 1 day post-treatment and persisted for 7 days (Figure S2E). Next, soluble α-Syn conformers were measured by SEC/western blot at the initial stages of GSL-induced aggregation (2 day CBE treatment), prior to the formation of insoluble α-Syn. We found that HMW species were elevated at 2 days while monomers were completely depleted, an effect that endured for 7 days when insoluble α-Syn was detected (Figures 1A, 1E, and 1F). Analysis of the kinetic behavior of aggregation in iPSns by a distinct SEC/ELISA assay confirmed that monomer depletion occurred prior to the formation of insoluble α-Syn (Figure 1G). Since monomer depletion did not temporally correlate with insoluble α-Syn accumulation, this suggests that monomers were not directly incorporated into insoluble species but instead were converted into soluble HMW species during the initial stages of aggregation. Comparing the CBE model to GD patient neurons showed a similar elevation of HMW species and monomer depletion, indicating that GSLs alter the state of physiological α-Syn with or without GBA1 mutations (Figure S2F). Finally, α-Syn was similarly affected in human H4 cells treated with CBE, indicating a reproducible effect in different cell types (Figure S2G).
We noted that both the HMW physiological conformers (HMW-ctrl) and those formed under GSL-accumulating conditions (HMW-GSL) had an identical molecular radius of 100 Å by SEC (Figure 1E). The HMW-GSL species accumulated prior to the formation of insoluble α-Syn (Figures 1E–1G), suggesting they could be aggregation competent and therefore structurally distinct from HMW-ctrl species. To determine this, we isolated HMW fractions by SEC from neurons that were cultured with PBS or CBE for 7 days and probed for structural differences in α-Syn by several distinct assays. First, immuno-FRET analysis showed a significantly higher signal in the HMW-GSL species compared to equal amounts of HMW-ctrl species (Figure 2A). This indicates that the distance between the donor and acceptor antibodies is in closer proximity, reflecting a more compact structure. No significant FRET signal was obtained from LMW monomeric fractions of either condition (Figure 2A). Analysis of HMW fractions obtained from GD iPSns (L444P/L444P; Schöndorf et al., 2014) also showed increased FRET efficiency, validating structural differences in patient neurons that carry GBA1 mutations (Figure 2A). To determine if GSLs induced structure changes inside cells, we used inducible H4 cells that were fixed and stained with syn211-FRET antibodies. The response of the FRET assay in fixed culture conditions was tested through several controls, including treatment with preformed fibrils (PFFs) to determine the maximum achievable signal and incubation with donor-alone or acceptor-alone antibodies to measure background signal (Figures 2B, 2C, and S2H). Antibody specificity was confirmed in H4 cells depleted of α-Syn (+doxycycline [dox]), while specificity for self-associated α-Syn was shown by lack of FRET signal in cells expressing aggregation-incompetent Δ71–82 (Figures 2C and S2H) (Giassonet al., 2001). Examination of 2 day CBE-treated cells showed that GSL accumulation increased FRET efficiency compared to controls, while total α-Syn levels did not change (Figures 2B and 2C). This effect was confirmed by quantification of FRET efficiency in CBE-treated iPSns over time, where FRET elevation was observed at 2 and 4 days with no change in total α-Syn until 7 days post-CBE (Figure 2D), consistent with elevation of insoluble α-Syn at 7 days (Figure 1A). Elevated FRET efficiency at initial stages of GSL-induced aggregation, prior to an elevation of total α-Syn, indicates that structural conversion occurs within H4 cells and iPSns.
Figure 2. HMW Physiological Conformers Are Structurally Distinct from GSL-Induced Conformers.
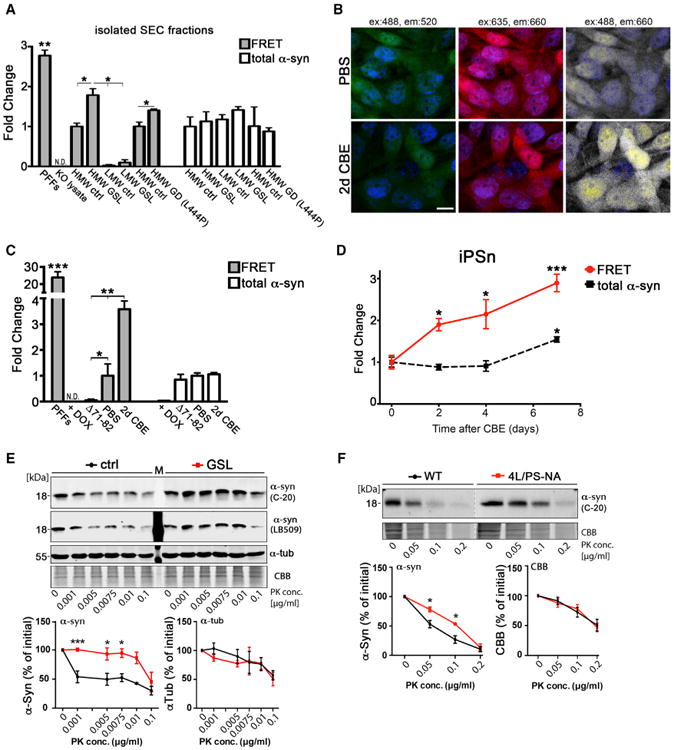
(A) Isolated SEC fractions from PBS control (HMW-ctrl) or CBE-treated (HMW-GSL) iPSns were analyzed by immuno-FRET. α-Syn KO lysate was used as a negative control, whereas pre-formed fibrils (PFFs) were used as a positive control. HMW GD species were obtained from L444P/L444P patient neurons and compared to a distinct control line. Direct excitation of the acceptor antibody (647) was used to quantify total α-Syn (n = 5).
(B) H4 cells were treated with CBE for 2 days, fixed, and analyzed by immuno-FRET (ex = 488 nm, em = 660 nm; white). Direct excitation of donor (green) or acceptor (red) and dapi (blue) are shown as controls. Scale bar, 10 μm.
(C) Quantification of (B) (n = 3).
(D) iPSns were treated with CBE for indicated times and FRET efficiency was measured as in (B) and (C) (n = 4).
(E) HMW conformers were isolated from either PBS- or CBE-treated H4 cells by SEC, digested with PK, and analyzed by western blot. Quantification is shown below (C-20). α-Tubulin (α-Tub) and Coomassie brilliant blue (CBB) were used as loading controls (n = 6). M, marker lane.
(F) HMW conformers isolated from soluble brain lysates of WT or Gaucher mice (4L/PS-NA) were analyzed as in(E). Quantification is shown below (n=3 mice). For all quantifications, values are the mean ± SEM, *p < 0.05, **p < 0.01, ***p < 0.001.
We next measured Proteinase K (PK) sensitivity of each species since PK resistance has been used previously to discriminate between distinct α-Syn structures (Cremades et al., 2012; Guo et al., 2013) and is a well-established method for detecting distinct prion strains (Bessen et al., 1995). PK digestion of equivalent amounts of HMW-ctrl and HMW-GSL followed by western blot demonstrated that HMW-GSL species were significantly more PK resistant (Figure 2E). This indicates increased stability of the HMW-GSL species and is consistent with increased compactness suggested by FRET experiments (Figure 2A).
To determine if distinct HMW α-Syn species occur in vivo, HMW fractions were isolated from a previously characterized GD mouse model (Mazzulli et al., 2011) and digested with PK. Previous studies have found HMW species in both control and GD mice at levels similar to those found in iPSns (Mazzulli et al., 2011). Consistent with the culture model, we found that HMW α-Syn fractions isolated from GD mouse brain were PK resistant compared to healthy control mice (Figure 2F). Importantly, the PK sensitivity of tubulin or total protein was not different between control and GSL-elevated conditions, indicating that α-Syn was specifically affected in these models (Figures 2E and 2F). These data indicate that GSLs can induce structural conversions of α-Syn in vivo.
To determine stability differences between HMW-ctrl and HMW-GSL species, we treated equal amounts of each species isolated from iPSns with the chaotropic agent sodium do-decyl sulfate (SDS) and found that HMW-GSL species were completely SDS resistant while physiological forms were broken down under parallel conditions (Figure 3A). Next, structure was examined by assessing solvent-exposed residues under native conditions using a panel of α-Syn antibodies. Native dot blots indicated that C-terminal regions detected by syn211 and C-20 were equally exposed in iPSn-derived HMW-ctrl and HMW-GSL species, while the middle region detected by 5C2 and syn-1 (residues 61–95 and 91–99, respectively) was equally buried (Figure 3B). This observation was confirmed by measuring the change in antibody reactivity upon denaturation of the same blots followed by re-probing. We found no change in reactivity with C-terminal antibodies and an equally significant increase in reactivity of middle-region antibodies (Figure 3B). Using the same method, we found that residues 15–55 of the N terminus, and a small part of the C terminus (around residue 130), were buried in HMW-GSL species, but solvent-exposed in physiological forms (Figure 3B). Next, we dot-blotted equivalent levels of HMW α-Syn (calculated by C-20 reactivity) under native conditions and found that the HMW-GSL species prominently reacted with N-terminal anti-α-Syn antibodies that preferentially detect pathological conformations, including syn303 and syn505 (Duda et al., 2002; Waxman et al., 2008) (Figure 3C). Differences in antibody reactivity toward syn505 and LB509 (generated against Lewy bodies; Baba et al., 1998) were also observed in denaturing western blot analysis, indicating conformational modifications that are stable to SDS and heat (Figure 3D). We also found that HMW-GSL species reacted with well-established conformational antibodies that detect toxic oligomers, including A11, which detects out-of-register beta sheets, and OC, which detects in-register beta sheets (Kayed et al., 2003; Glabe, 2008; Liu et al., 2012; Stroud et al., 2012) (Figure 3C). A11 reactivity was confirmed in HMW fractions obtained from GD iPSns (L444P/L444P), indicating that similar structure changes occur in neurons expressing GBA1 mutations (Figure 3E). These data identify unique beta sheet conformations and buried amino acid regions of HMW-GSL species (Figure 3F) and further indicate that structural differences exist between HMW-ctrl and HMW-GSL species.
Figure 3. Characterization of the Structural Differences of HMW Physiological and GSL-Induced Species.
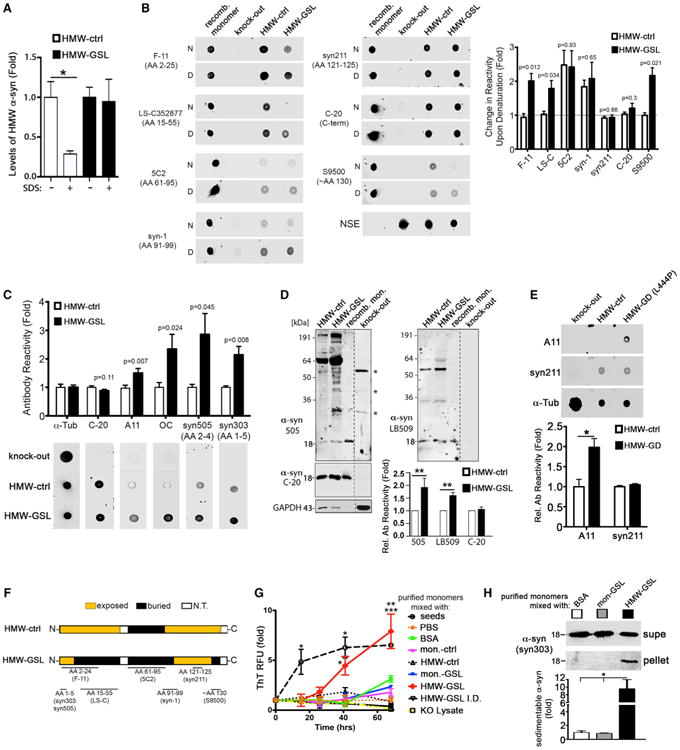
(A) Soluble HMW fractions (#1–3) containing α-Syn were isolated from iPSn cultures treated with either PBS control (HMW-ctrl) or CBE (HMW-GSL). Equivalent amounts of HMW species from each condition were incubated with 0.1% SDS in vitro, and breakdown of the HMW species was determined by SEC/ELISA (n = 3).
(B) HMW-ctrl or HMW-GSL α-Syn were dot-blotted under native conditions (N) followed by western blot. The same blots were denatured (D) by boiling for 10 min in SDS, then re-probed with the same antibodies to determine exposed or buried regions. α-Syn KO lysate was used to determine antibody specificity. Fully denatured recombinant monomers were used as a control, showing no difference between N and D conditions. Neuron-specific enolase (NSE) was used as a loading control. Right: quantification of changes in antibody reactivity after denaturation (n = 3).
(C) Native dot blot/western analysis of HMW species using conformational specific antibodies (n = 3).
(D) Equivalent amounts of HMW-ctrl and HMW-GSL isolated from H4 cells were analyzed by western blot. C-20 immunoreactivity was used to measure total α-Syn found in each HMW fraction. Recombinant (recomb) purified α-Syn was used as a standard, and α-Syn KO lysate was used to determine antibody specificity. Asterisks indicate non-specific bands. Below: quantification of western blots.
(E) Native dot blot/western analysis of HMW α-Syn derived from GD patient neurons (L444P/L444P) compared to controls using oligomer-specific antibody A11 (n = 3). Syn211 and α-Tub were used as loading controls.
(F) Diagram summarizing the buried and exposed regions of HMW-ctrl and HMW-GSL. N.T., not tested.
(G) HMW and LMW (monomer [mon.]) species were isolated by SEC and mixed with purified recombinant α-Syn monomers in vitro at pH 7.4 under quiescent conditions, and amyloid formation was determined by thioflavin T (ThT) fluorescence. RFU, relative fluorescence units. PBS, bovine serum albumin (BSA), α-SynKO lysate, or HMW GSL-induced species immunodepleted (I.D.) of α-Syn were used as negative controls (n = 4). Pre-formed seed fibrils were used as a positive control (*p < 0.05 seeds and HMW-GSL versus all control conditions, **p < 0.01 HMW-GSL versus BSA and GSL mon., ***p < 0.001 HMW-GSL versus PBS control).
(H) Purified recombinant monomers were mixed with BSA as a control, GSL monomers, or HMW-GSL and aggregation was assessed at 68 hr by sedimentation/ western blot. Supe, supernatant (n = 4, *p < 0.05). For all quantifications, values are the mean ± SEM.
Since the HMW-GSL-induced species accumulated prior to the formation of insoluble α-Syn, we next examined their ability to seed the aggregation of recombinant monomeric α-Syn in vitro using the amyloid-binding dye thioflavin T (ThT). Importantly, these incubations were done under quiescent conditions at pH 7.4, where conversion of monomers into fibrils cannot occur without seeds to serve as templates of fibril growth or sample agitation to stimulate nucleation (Buell et al., 2014). We found that HMW-GSL species were able to convert recombinant monomers into ThT-positive aggregates in vitro, while α-Syn KO lysate or HMW fractions immuno-depleted (I.D.) of α-Syn had no effect (Figure 3G). HMW-ctrl or cell-derived LMW monomers from either condition could not seed fibril formation, further demonstrating the unique property of the HMW-GSL species (Figure 3G). We confirmed this effect with a separate sedimentation assay, which indicated a significant increase in aggregated α-Syn within pellet fractions (Figure 3H). These data indicate that HMW-GSL α-Syn can directly recruit and convert soluble monomers into ThT-positive, insoluble aggregates. Together, this demonstrates that HMW-GSL species, while exhibiting identical size exclusion properties of HMW-ctrl species, have unique structural properties associated with pathogenic conformations of α-Syn.
Glucosylceramide Directly Converts Physiological α-Syn into HMW Assembly-State Species
We next sought to determine if GSLs could directly influence the structure of physiological α-Syn species documented in iPSns. Since α-Syn was found as both monomers and HMW species under physiological conditions, we tested if GSLs preferentially interacted with either species to initiate aggregation. We first considered that GSLs may directly interact with monomers to convert them into assembly-competent oligomers. To test this, we isolated monomeric α-Syn from iPSns, incubated it with purified GluCer or the control lipid phosphatidylcholine (PC), and measured the formation of soluble HMW α-Syn by SEC. This assay was also performed under quiescent conditions to eliminate oligomerization that may occur from sample agitation alone. We found that the addition of GluCer to iPSn-derived monomers significantly elevated levels of HMW forms of 100 Å radius in size, but by a subtle amount of 0.85%, and the majority of the protein remained monomeric (Figure 4A). Under the same conditions, measurement of monomer self-association by FRET similarly demonstrated a mild but significant elevation upon addition of GluCer (Figure 4B). This indicates that GluCer can directly induce mild structure changes of iPSn-derived monomers under quiescent conditions tested here.
Figure 4. GluCer Converts Physiological α-Syn Conformers into Pathogenic Species.
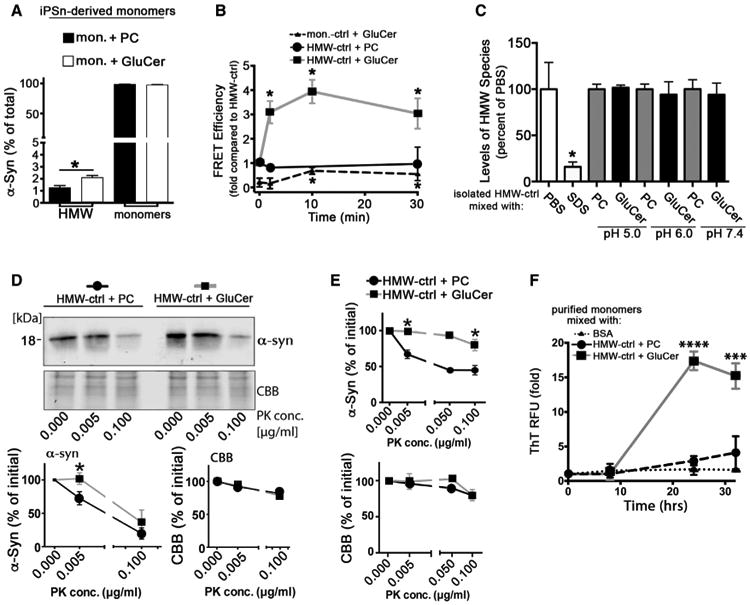
(A) iPSn-derived monomers isolated from control neurons were incubated with phosphatidylcholine (PC) as a control, and GluCer under quiescent conditions at pH 5.5, followed by SEC/ELISA to monitor conversion into HMW species (n = 4).
(B) Physiological conformers (HMW-ctrl or mon.-ctrl) were isolated from iPSns and mixed with PC or GluCer in vitro as in (A), followed by immuno-FRET analysis (n = 4, *p < 0.05 compared to time = 0).
(C) HMW-ctrl was isolated and mixed with PC or GluCer in vitro at pH 5.0, 6.0, or 7.4 for 30 min at 37°C followed by SEC/ELISA. SDS (0.1%) was used as a control to disrupt HMW conformers (n = 4).
(D) HMW-ctrl fractions from iPSns were treated with PC or GluCer as in (B) for 30 min, followed by PK digest/western blot (C-20)(n = 3). CBB was used as a loading control.
(E) HMW-ctrl from H4 cells was mixed with PC or GluCer in vitro and analyzed as in (D) (n = 3).
(F) HMW-ctrl from iPSns was incubated with BSA, PC, or GluCer in vitro as in (D), then mixed with purified recombinant monomers. Amyloid formation was monitored over time under quiescent conditions at pH 7.4 by ThT (n = 4). For all quantifications, values are the mean ± SEM (*p < 0.05, ***p < 0.0002,****p < 0.0001).
We next tested if GluCer could directly alter the structure of HMW-ctrl species obtained from control iPSns. We first hypothesized that GSLs may destabilize HMW species of iPSns into aggregation-prone monomers in vitro that subsequently form pathogenic aggregates. To test this, we isolated HMW-ctrl species and incubated them with GluCer or PC under identical conditions used for monomer incubations. Disruption of the HMW species into 35 Å-sized monomers was measured by re-injecting the sample on an SEC column followed by ELISA detection of α-Syn. We found that GluCer could not disrupt HMW species into monomers in vitro under multiple pH conditions tested; however, 0.1% SDS efficiently broke the species down into monomers (Figure 4C). We then utilized FRET to assess structure changes of the HMW-ctrl species in vitro. Interestingly, addition of GluCer did not decline FRET as it would be expected with HMW disassembly, but instead rapidly increased FRET efficiency within 2 min and sustained throughout the 30-min incubation period of the assay (Figure 4B). No change was observed in parallel reactions treated with the control lipid PC (Figure 4B). This indicates that GluCer does not induce breakdown of HMW-ctrl species but directly converts it into a distinct, more compact conformation.
The effect of GluCer on the structure of HMW-ctrl species was further monitored by PK resistance and aggregation assays. Similar to HMW-GSL species produced within iPSns, we found that HMW-ctrl species treated with GluCer acquired PK resistance compared to samples treated with PC (Figures 4D and 4E). Finally, we found that while HMW-ctrl species treated with PC did not stimulate in vitro fibril growth of recombinant monomers, the GluCer-converted species were now able to seed polymerization (Figure 4F). Together, these data suggest that GluCer directly converts HMW-ctrl species into assembly-competent species without destabilization. The resemblance of the biochemical properties of the in vitro-made HMW-GSL species with those produced inside midbrain neurons indicates that the two species share structural similarities.
We next determined if GSLs can directly alter the conformation of purified α-Syn in vitro through biochemical analysis. Similar to the neuron-derived species, we found that in vitro-produced GluCer oligomers made under shaking conditions were PK resistant compared to samples incubated without lipids or with equimolar GluSph (Figure S3A). Furthermore, GluCer increased reactivity of recombinant oligomers with syn505 similar to that of neuron-produced HMW species (Figure S3B). The similar biochemical properties of in vitro-produced oligomers to those derived from iPSns suggest that the two species share structural similarities, and further indicate that GluCer and α-Syn interact to cause a structural conversion into a pathogenic conformation.
To further probe an association of GluCer and α-Syn inside neurons, we immunostained fixed CBE-treated iPSns with syn505 and anti-GluCer antibodies. In controls, low levels of syn505 and diffuse GluCer staining were detected, while 2 day CBE-treated neurons demonstrated punctated α-Syn accumulations that partially co-localized with punctated GluCer (Figures S3C–S3E). Only limited co-localization was noted after 7 days; however, large GluCer puncta were closely associated with surrounding α-Syn accumulations, consistent with the notion that GluCer-α-Syn oligomers can template aggregates that extend beyond the initial interaction site (Figure S3C). Co-localized GluCer-α-Syn puncta at 2 day CBE treatment were confirmed using LB509 (Figures S3D and S3E), as well as by immunoelectron microscopy (immuno-EM) with syn505 and anti-GluCer antibodies (Figure S3F). Since syn505 preferentially detects distinct pathological conformations of α-Syn, these data indicate that GluCer and α-Syn associate inside iPSns and result in a toxic conformational change.
Soluble HMW-GSL α-Syn Species Directly Result in Cellular Degeneration
We next wanted to determine if GSL-induced α-Syn accumulation was associated with neuronal toxicity. iPSns were treated with CBE for 7 days and viability was assessed by immunostaining analysis to quantify neurofilament protein, which detects neurite degeneration prior to more severe cell-body toxicity (Mazzulli et al., 2011). We found that CBE treatment reduced neuron viability by >50% (Figures 5A and 5B). This toxicity was dependent on α-Syn, since α-Syn reduction by lentiviral-mediated short hairpin RNA (shRNA) improved viability of CBE-treated neurons (Figures 5A and 5B). To confirm these results in a distinct model that does not require lentiviral infection, α-Syn KO lines were generated from control iPSCs by CRISPR/ Cas9 and differentiated into midbrain dopamine neurons (Figure S4). Assessment of neurotoxicity in control and α-Syn KO iPSns treated with CBE confirmed that reduction of α-Syn improved neuron viability (Figures 5C and 5D). This indicates that GSL-induced neurotoxicity can occur independently of GBA1 mutations, and partly involves α-Syn in iPSns.
Figure 5. GSLs Induce Toxicity through α-Syn.
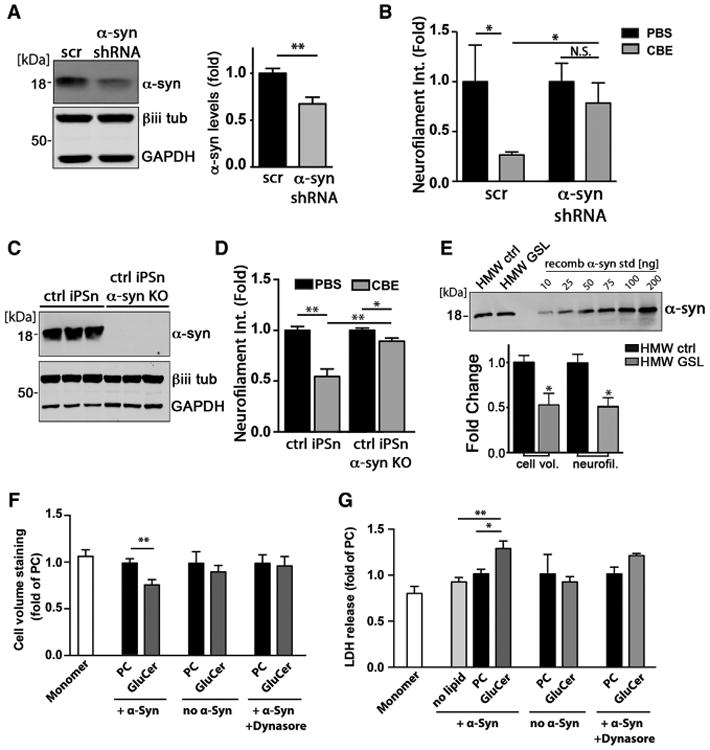
(A) iPSns were infected with lentiviral particles that express either scrambled (scr) or shRNA to knock down α-Syn (7 days, MOI = 5). Western blot shows knockdown efficiency. β-iii-tubulin and GAPDH were used as loading controls. Quantification is shown to the right (n = 3).
(B) Neuron viability was determined by neurofilament quantification in iPSns treated with PBS or CBE (n = 4).
(C) Western blot of α-Syn demonstrating an efficient KO in three replicates. β-iii-tubulin (βiii tub) and GAPDH were used as loading controls.
(D) Neuron viability was determined as in (B) from ctrl of α-Syn KO iPSns treated with 50 μM CBE for 7 days (n = 4).
(E) HMW-ctrl or HMW-GSL was isolated and quantified against recombinant α-Syn standards. Equal amounts were applied into the culture media of control iPSns and neurotoxicity was determined by neurofilament and cell volume quantification (n = 4).
(F) Recombinant α-Syn was incubated with GluCer to generate HMW-GSL species in vitro, then applied to H4 cultures. Cultures were treated with α-Syn monomers alone, α-Syn + PC, or PC/GluCer lipids without α-Syn as controls, and viability was assessed as in (E). Dynasore, endocytosis inhibitor.
(G) H4 cells were incubated using the same conditions described in (F), and cellular toxicity was assessed through release of lactate dehydrogenase (LDH) into the culture media (n = 4). Values are expressed as fold change compared to PC + α-Syn for (F) and (G). For all quantifications, values are the mean ± SEM (*p < 0.05, **p < 0.01).
To determine if HMW-GSL species play a direct role in toxicity, HMW fractions from iPSns were isolated from control or GSL-accumulating conditions, and equivalent amounts of each species were applied to healthy control midbrain cultures. Quantification of neurofilament indicated that HMW-GSL species resulted in a 50% decline in viability compared to HMW-ctrl species (Figure 5E). We also found that GluCer-induced oligomers generated in vitro from the recombinant protein were directly toxic to H4 cells, compared to cells treated with monomers or lipids alone (Figures 5F and 5G). Toxicity was abolished when α-Syn-GluCer was co-administered with an endocytosis inhibitor, indicating that intracellular uptake of α-Syn was required (Figures 5F and 5G). Together, the data suggest that GSL-induced oligomers are capable of directly inducing cellular degeneration when either exogenously applied or produced endogenously within human iPSns and cell lines.
GSL Reduction Reverses the Toxic Conversion of α-Syn in Cell Lines and PD Patient iPSns
Our data thus far indicate that GSL accumulation in iPSns promotes the conversion of physiological α-Syn species into toxic conformations. To determine if this pathological process can be reversed, we treated GD and PD patient iPSns with a previously established glucosylceramide synthase inhibitor (GCSi) to reduce GSLs (McEachern et al., 2007). These models have previously been documented to accumulate GSLs through mutations in either GBA1 or SNCA (Mazzulli et al., 2016a). We first determined if GCSi affected the viability of healthy control cells by neurofilament staining and found no effect (viability [%], DMSO control = 100% ± 14.3%; GCSi = 101.8% ± 9.5%). GCSi treatment of GD iPSns with pre-existing GSL and α-Syn accumulation resulted in an ∼70% decline in GluCer, while the levels of GluSph or other related sphingolipids showed little change (Figures S5A-S5D). Analysis of α-Syn by western blot showed that GCSi treatment did not alter the total levels of soluble α-Syn, but significantly reduced insoluble α-Syn (Figure 6A). We found a similar effect when GCSi was added to cells that express WT GBA1, but exhibit reduced GCase activity and GSL accumulation as a result of α-Syn accumulation (Figures 6B and 6C). We confirmed insoluble α-Syn reduction by GCSi in an additional GD iPSC-derived patient line (L444P/L444P), as well as a familial PD patient expressing A53T α-Syn (Figures S5E and S5F). To determine if GCSi could reduce amyloidogenic α-Syn, GD and PD iPSns were analyzed by immunofluorescence using LB509 and thioflavin S. This indicated a significant reduction in the number of neurons containing amyloidogenic accumulations within neurites or the cell body (Figure 6D). These data demonstrate that reducing GSLs lowers pathological α-Syn. Importantly, this occurs while the mutant N370S or L444P GCase protein is continuously expressed as demonstrated by rescue of GD iPSns.
Figure 6. Reduction of Intracellular GSLs Diminishes Pathological α-Syn.
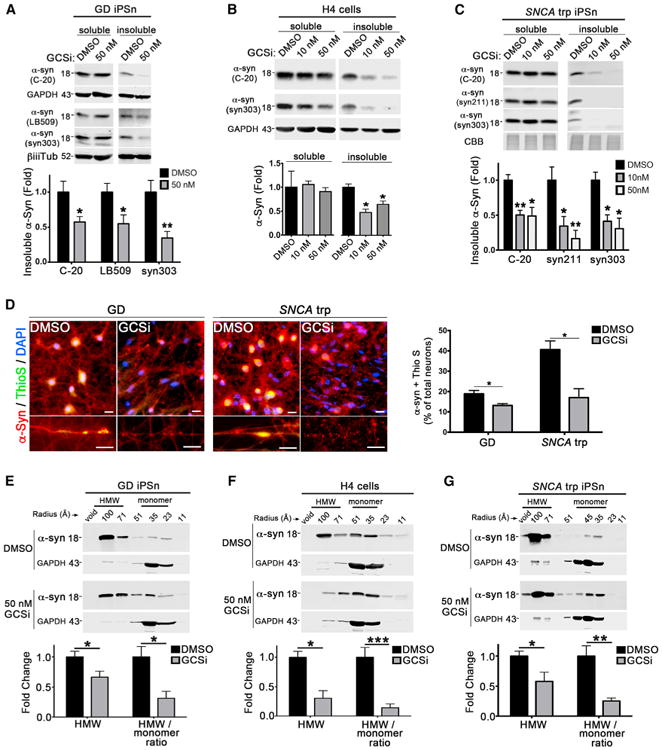
(A–C) Measurement of soluble and insoluble α-Syn by sequential extraction/western blot of GD iPSns (N370S/c.84dupG) (A), H4 α-Syn cells (B), or SNCA triplication (trp) iPSns (C), with pre-existing pathology, treated with a glucosylceramide synthesis inhibitor (GCSi,50 nM). DMSO was used as a control. Quantification is shown below (n = 4). β-iii-tubulin, GAPDH, or CBB was used as loading control.
(D) Analysis of amyloidogenic α-Syn aggregates in cell bodies (top) or neurites (bottom) of fixed patient iPSns treated with GCSi by immunostaining (LB509, red) and thioflavin S (ThioS, green). Nuclei were detected with DAPI (blue). Scale bars, 10 μm. Right: quantification of cells containing ThioS-positive α-Syn in cell bodies (n = 4).
(E–G) SEC/western blot of GD patient iPSns (N370S/c.84dupG) (E), H4 α-Syn cells (F), and SNCA trp patient iPS midbrain neurons (G). Quantification is shown below (n = 3). For all quantifications, values are the mean ± SEM, *p < 0.05, **p < 0.01, ***p < 0.001.
Since we noted that total soluble α-Syn did not change in response to GCSi, we next measured soluble HMW species and monomers in GD patient iPSns. SEC/western blot analysis indicated that treatment with the GCSi partially reduced the total levels of HMW α-Syn while slightly elevating monomeric forms (Figure 6E). The GCSi treatment resulted in a similar shift of α-Syn forms in line with WT GBA1, including H4 cells and SNCA trp iPSns (Figures 6F and 6G). Treatment of a separate PD patient line expressing A53T α-Syn also demonstrated reduction of HMW α-Syn by GCSi (Figure S5F, right). Finally, to confirm that GSL reduction and not inhibition of GCS per se could affect the soluble forms of α-Syn, we utilized an alternate strategy to reduce GSL through activation of lysosomal GCase with an established small molecule, 758. Previous studies have shown that 758 could reduce GSLs and pathological α-Syn in GD and PD iPSns (Mazzulli et al., 2016b). SEC analysis of 758-treated GD iPSns indicated a similar shift in HMW:monomer ratios as observed with GCSi treatment (Figure S5G), suggesting that the effect is a result of GSL reduction.
We next determined ifGSL reduction could reverse the conformational conversion of HMW pathological α-Syn and convert it back into physiological forms. We first converted HMW-ctrl species into assembly-state species in vitro by incubation with GluCer for 10 min, then added anti-GluCer antibodies to remove GluCer from the same reaction. Samples cleared of GluCer were then incubated under physiological conditions and conformational changes were monitored by FRET. Kinetic analysis indicated that FRET efficiency was significantly reduced after 10 min and persisted until the 30-min end point of the assay (Figure 7A), indicating that the GSL-induced species can partially regain properties associated with its original physiological conformation when GluCer is removed. To determine if GSL-induced conversion can be reversed inside human cells, H4 cells were treated with CBE for 2 days followed by the addition of GCSi and then analyzed by FRET. Consistent with the in vitro data, cellular reduction of GSLs decreased the FRET efficiency, indicating that reversal can also occur as a cellular process (Figure 7B).
Figure 7. Restoration of Physiological α-Syn Conformers by GSL Reduction in Patient-Derived iPSns.
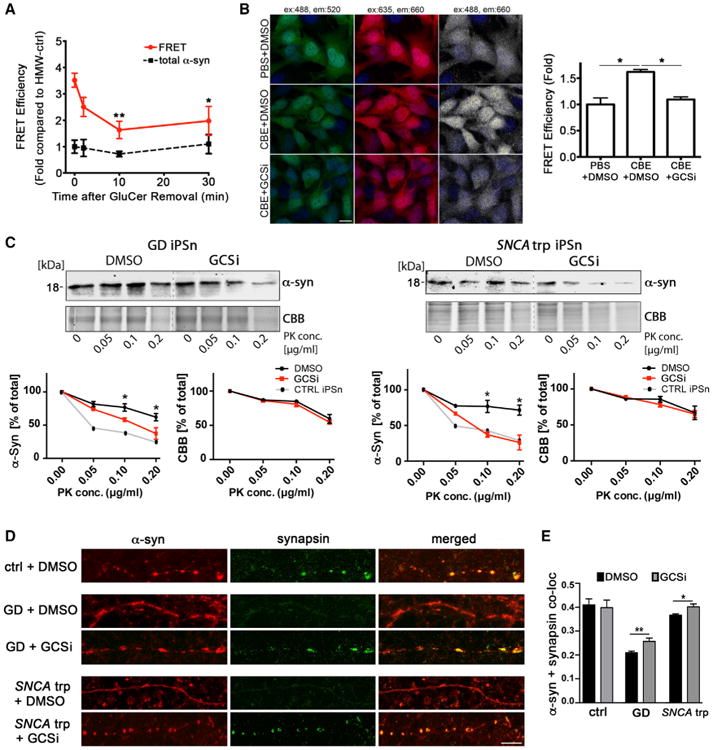
(A) HMW-ctrl was converted into pathogenic species by GluCer, followed by the removal of GluCer with anti-GluCer antibodies (time = 0). Samples were then incubated for 30 min under physiological conditions and structural conversion was analyzed by FRET. Total α-Syn was measured by direct excitation of the acceptor antibody (n = 5, **p < 0.01, *p < 0.05 compared to time = 0).
(B) H4 cells were treated with CBE for 2 days followed by a 2 day treatment with GCSi, fixed, and analyzed by immuno-FRET. FRET is shown in white, while direct excitation of donor or acceptor is shown in green and red, respectively. Dapi is shown in blue. Scale bar, 10 μm. Quantification is shown on the right (n = 3).
(C) HMW α-Syn species were isolated by SEC from GCSi-treated GD (N370S/c.84dupG) or SNCA trp patient iPSns and analyzed by PK digestion/western blot. Quantification is shown below. CBB was used as a loading control (n = 3, *p < 0.05 DMSO compared to GCSi).
(D) Immunofluorescence analysis of GD and SNCA trp iPSns showing localization of α-Syn (red) and the synaptic marker synapsin (green) within neurites. Scale bar, 5 μm.
(E) Quantification of α-Syn/synapsin co-localization (Pearson's coefficient) (n = 3, *p < 0.05, **p < 0.01). For all quantifications, values are the mean ± SEM.
Next, patient iPSns with pre-existing pathology were treated with the GCSi, and SEC-isolated HMW α-Syn species were subjected to PK digestion. HMW species from GCSi-treated patient cultures were significantly more PK sensitive compared to cultures treated with vehicle control, indicating that GSL reduction could partially reverse the conversion into toxic species (Figure 7C). Since α-Syn is known to associate with synapses in neurons under physiological conditions, we next determined if GCSi treatment could increase synaptic location. While GCSi had no effect on the synaptic location of α-Syn in control iPSns, immunostaining analysis indicated a significant elevation in the co-localization of α-Syn with the synaptic marker synapsin, in patient neurons (Figures 7D and 7E). Together, these data suggest that GSL levels control the conversion of HMW physiological conformers into assembly-state species in vitro and in patient iPSns. Restoration of physiological α-Syn conformers by GSL reduction also improves synaptic localization, where it is thought to perform its normal physiological function.
Discussion
We establish a previously unrecognized relationship between distinct physiological α-Syn conformers and cellular GSLs that accumulate in GD. Under physiological conditions, we find that α-Syn exists in equilibrium between 35 Å-sized species and 100 Å HMW conformers in iPSns. FRET analysis of each SEC fraction indicated that while 35 Å-sized α-Syn is likely monomeric, the HMW fraction contains multiple copies of α-Syn that are closely associated and possibly oligomeric. Although the notion of a physiological oligomer has been previously suggested (Dettmer et al., 2016), it is possible that other molecules may be associated with the HMW species documented here and further studies are required to fully characterize their structure. Nevertheless, the role of distinct physiological α-Syn conformers in the aggregation process was previously unexplored in human neurons. We hypothesized that GSLs would induce aggregation through destabilizing the HMW-ctrl species into LMW aggregation-prone monomers. However, our in vitro data indicate that GSLs do not disassemble HMW-ctrl species into monomeric components, but instead directly convert them into a stable, assembly-competent form (Figures 2B–2D, 4B, and 4C). Importantly, we find this conversion to be reversible when GSLs are reduced in vitro or in human neurons (Figures 7A–7C).
Our data indicate that GluCer and α-Syn co-localize in iPSns as indicated by immunofluorescence and immuno-EM, suggesting that direct interactions may mediate conformational conversion inside neurons. This is supported by reactivity of co-localized GluCer puncta with syn505, an antibody that preferentially detects pathogenic conformations, and LB509, which was generated against Lewy body inclusions (Figures S3C–S3F). Studies using purified recombinant α-Syn showed that GluCer directly induces PK resistance and enhances syn505 reactivity (Figures S3A and S3B). While collectively these data suggest that GluCer and α-Syn interact to induce a conformational change, further biophysical studies will be required to precisely define the nature of the interaction and the consequence on α-Syn conformation.
Our data indicate that HMW species induced by GSLs are structurally distinct from physiological conformers, although with an identical molecular radius of ca. 100 Å. Several different assays in addition to FRET were used to validate their unique structural properties. PK resistance and stability in SDS that characterize the GSL-induced species are consistent with the stable properties of in vitro synthesized oligomeric intermediates that form directly prior to fibril formation (Cremades et al., 2012). Reaction with antibodies such as syn505 and syn303, which preferentially detect pathogenic forms of α-Syn documented in human brain (Duda et al., 2002), suggests the conversion results in a toxic conformation. Toxicity of these species was directly demonstrated through exogenous application of HMW-GSL-induced species to iPSns, or through endogenous-produced species in CBE-treated human neurons (Figure 5). Further, HMW-GSL-induced species reacted with conformation-dependent antibodies that detect beta sheet structures associated with toxicity (Figures 3C and 3E), and have distinct solvent-exposed regions under native conditions (Figures 3A–3F). Reaction with both OC and A11 antibodies, which detect amyloid oligomers containing either in-register or out-of-register beta sheets, respectively, indicated that GSL induces multiple types of oligomeric structures. Consistent with the ability to form beta sheet-containing amyloid oligomers, we found that HMW-GSL species could act as seeds to stimulate in vitro fibril formation under quiescent conditions of pH 7.4 (Figure 3G). While our study focuses on the initial stages of GSL-induced α-Syn aggregation, further studies are required to determine the secondary processes that contribute to further growth of amyloid and downstream neurodegenerative processes.
Interestingly, our data indicate that HMW-ctrl species produced under physiological conditions by midbrain neurons can be efficiently converted by GSLs into assembly-state species, and therefore could act as a direct on-pathway precursor to amyloid fibrils (Figures 4B and 4D–4F). Although more studies are required to define the state of HMW-ctrl species, we note similar features to pre-nuclei type A oligomers formed in vitro from purified protein (Cremades et al., 2012) such as loose self-association, PK sensitivity, and non-toxic properties. Under normal conditions, we hypothesize that the conversion of physiological conformers into compact assembly-state species is an energetically unfavorable process and does not occur to a significant extent. Under pathological conditions, such as intracellular GSL accumulation, the conversion process is accelerated and results in amyloid formation and neurotoxicity (Figure 8). In addition to conversion of HMW-ctrl species, we also found that iPSn-derived monomers convert into HMW species (Figure 8). However, the toxic conversion of monomers appeared to be less efficient compared to the conversion of HMW-ctrl species treated under the same conditions (Figures 4A and 4B). Monomer depletion observed in iPSns (Figures 1E–1G) may partly occur through direct conversion by GluCer, but also likely occurs by direct recruitment of monomers onto HMW-GSL species, which eventually lead to the formation of insoluble α-Syn. This notion is supported by the fact that addition of purified monomers could be directly converted into ThT-positive sedimentable aggregates by isolated HMW-GSL species (Figures 3G, 3H, and 4F). After insoluble fibrils have been formed, monomers may directly incorporate onto fibril ends as previously shown in vitro (Buell et al., 2014). Interestingly, kinetic analysis demonstrated that elevated HMW-GSL species sustained, even while insoluble α-Syn was present (at 7 day CBE). This may reflect the ability of GSLs to kinetically stabilize intermediate species as previously noted (Mazzulli et al., 2011). This is also consistent with their stability properties as documented by PK and SDS resistance, which may render them difficult to degrade by cellular proteolytic systems(Figures 2E and 2F). While our studies focused on the effects of GSLs on α-Syn, it is likely that other pathological factors accelerate the conversion of HMW physiological conformers into assembly-state species, such as elevated protein concentration, oxidants, and the aberrant interaction with other proteins.
Figure 8. Schematic Diagram Summarizing the Effects of GSLs on α-Syn Aggregation.
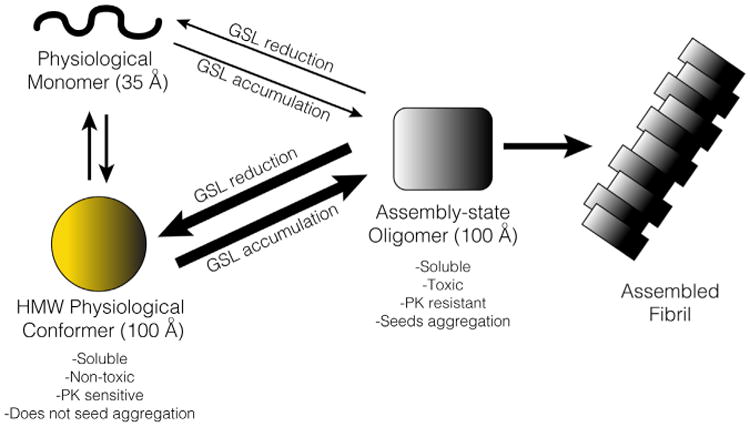
In healthy human midbrain neurons, α-Syn exists as both physiological monomers and HMW conformers. GSLs such as GluCer preferentially act on HMW conformers, and to a minor extent on monomers, to convert them into assembly-state oligomers (AOs) with molecular radius that is identical to HMW physiological conformers. HMW physiological species are non-toxic, loosely self-associated species and can be directly converted into AOs. AOs are cytotoxic, compact, and PK resistant, and can accelerate the formation of assembled amyloid fibrils from free monomers.
Our data also have important implications for the mechanism of GBA1-induced neuronal toxicity. We show that α-Syn aggregates can form in the absence of GBA1 mutations, but with reduced GCase activity and GSL accumulation, suggesting that GSLs alone are sufficient to induce α-Syn pathology. This is further supported by the fact that α-Syn reduction occurs concomitantly with GSL reduction in GD neurons expressing mutant GBA1 (Figures 6A, 6D, and 6E). While it is likely that additional cellular stress induced by expression of mutant GBA1 contributes to cellular dysfunction, such as endoplasmic reticulum stress, we find that GBA1 mutations are not necessary to initiate pathological α-Syn accumulation. These data further demonstrate the importance of neuronal GSL levels in the conversion of α-Syn into toxic assemblies.
The aggregation mechanisms documented here may have important implications for therapeutic intervention. GSL-initiated α-Syn aggregation does not involve irreversible disruption of HMW physiological conformers, suggesting that the conversion process may be reversible at a stage prior to incorporation into amyloid fibrils. This is an important distinction in the mechanisms that mediate other amyloidoses, where aggregation can be difficult to rescue due to irreversible destabilization of native protein structure. We show that toxic oligomers of symptomatic patient midbrain neurons can be reverted back into their normal physiological forms that associate with synapses through GSL reduction. Our data indicate that GSL reduction may be a viable therapeutic option for synucleinopathy patients with and without GBA1 mutations.
Detailed methods are provided in the online version of this paper and include the following:
Contact For Reagent and Resource Sharing
Further information and requests for resources should be directed to the Lead Contact, Joseph R. Mazzulli (jmazzulli@northwestern.edu).
Experimental Model and Subject Details
Inducible human H4 neuroglioma cells expressing α-Syn under the control of a tetracycline-responsive promoter (tet-off) (Mazzulli et al., 2011) and iPS-derived dopaminergic neurons (iPSn; from control, PD and GD patients) were utilized as cell models to study α-Syn aggregation and structure. iPS cells models have been previously authenticated (Mazzulli et al., 2016a). The authentication procedure is based on genotyping for common disease-causing mutations (published in Mazzulli et al., 2011), pluripotency analysis, karyotype analysis, efficient differentiation into midbrain dopamine neurons, and absence of mycoplasma. Representative example of authentication procedure appears in Figure S4. H4 cells have been previously authenticated (Mazzulli et al., 2011) by analyzing expression of α-Synuclein (α-Syn) and absence of mycoplasma. The gender of cell lines is listed in the Key Resources Table. Randomization of samples or cell cultures during analysis of HPLC, cell toxicity assays, and biochemical assays was done to account for any technical variations as noted below. Blinding of the samples to the experimenter was done when possible and noted below. In some cases, obvious differences in culture behavior, morphology, solution turbidities, color, or other easily identifiable features made blinding difficult.
Key Resources Table.
| Reagent or Resource | Source | Identifier |
|---|---|---|
| Antibodies | ||
|
| ||
| Mouse monoclonal anti-alpha synuclein (LB509) | Abcam | Cat #ab27766; RRID: AB_727020 |
| Rabbit polyclonal anti-alpha synuclein (C-20) | Santa Cruz | Cat #SC-7011-R; RRID: AB_2192953 |
| Mouse monoclonal anti-alpha synuclein (303) | Biolegend | Cat #824301; RRID: AB_2564879 |
| Mouse monoclonal anti-alpha-Synuclein (505) | Thermo Fisher Scientific | Cat #32-8300; RRID: AB_2533225 |
| Mouse monoclonal anti-alpha-Synuclein (syn211) | Thermo Fisher Scientific | Cat #32-8100; RRID: AB_2533094 |
| Mouse monoclonal anti-alpha/beta-Synuclein (F-11) | Santa Cruz | Cat #SC-514908 |
| Rabbit polyclonal anti-alpha-Synuclein (LS-C352877) | LifeSpan Biosciences | Cat #LS-C352877 |
| Mouse monoclonal anti-alpha-Synuclein (5C2) | Novus Biologicals | Cat #NBP1-04321; RRID: AB_1522485 |
| Mouse monoclonal anti-alpha-Synuclein (Syn1) | BD Biosciences | Cat #36-008-25UL |
| Rabbit polyclonal anti-alpha-Synuclein (S9500) | Biomol GmbH | Cat #S9500-01E.100 |
| Mouse monoclonal anti-alpha-tubulin | Sigma | Cat #T6074; RRID: AB_477582 |
| Mouse monoclonal anti-GAPDH (6C5) | Millipore | Cat #CB1001; RRID: AB_2107426 |
| Mouse monoclonal anti-neurofilament | Biolegend, SMI-312 | Cat #837904; RRID: AB_2566782 |
| Rabit polyclonal anti-neuron specific enolase (NSE) | Polysciences | Cat #17437 |
| Mouse polyclonal anti-b-iii tubulin (TUJI) | Biolegend | Cat # 801201; RRID: AB_2313773 |
| Rabbit polyclonal anti-synapsin | Life Technology | Cat #A-6442; RRID: AB_2536207 |
| Mouse monoclonal anti-tyrosine Hydroxylase (TH-2) | Sigma | Cat #T1299; RRID: AB_477560 |
| Rabbit polyclonal anti-glucosylceramide (GluCer) | Glycobiotech | Cat #RAS_0011 |
| Secondary antibody: IRdye 800-conjugated IgG antibodies | Li-Cor Biosciences | Cat #P/N 925-32210; RRID: AB_2687825 |
| Secondary antibody: IRdye 680-conjugated IgG antibodies | Thermo Life Technologies | Cat #A32734; RRID: AB_2633283 |
| FRET assay antibody: syn211-Alexa 488 | Santa Cruz Biotech | Cat #sc-12767 AF488 |
| FRET assay antibody: syn211-Alexa 647 | Santa Cruz Biotech | Cat #sc-12767 AF647 |
|
| ||
| Bacterial and Virus Strains | ||
|
| ||
| Top 10 DH5-alpha | Thermo Fisher Scientific | Cat #C404003 |
| lenti-pER (HIV, replication incompetent) | Mazzulli et al., 2011 | N/A |
|
| ||
| Biological Samples | ||
|
| ||
| soluble brain lysates of wildtype (WT) mice | Mazzulli et al., 2011 | N/A |
| soluble brain lysates of Gaucher mice (4L/PS-NA) | Mazzulli et al., 2011 | N/A |
|
| ||
| Chemicals, Peptides, and Recombinant Proteins | ||
|
| ||
| Doxycycline hydrochloride (DOX) | Sigma | Cat #D3447 |
| Geneticin (G418) | Thermo Fisher Scientific | Cat #10131027 |
| Hygromycin | Thermo Fisher Scientific | Cat #10687010 |
| Penicillin/streptomycin | Thermo Fisher Scientific | Cat #10378016 |
| GCase inhibitor: Conduritol-b-epoxide (CBE) | EMD Millipore | Cat #234599 |
| GCase activator: 758 | Mazzulli et al., 2016b | N/A |
| Human recombinant alpha-Synuclein | Expressed in e.coli; Mazzulli et al., 2007 | N/A |
| Brain phosphatidylcholines (PC) | Avanti lipids | Cat #840053P |
| Glucosylceramide (GluCer) | Avanti lipids | Cat #860547 |
| Glucosylsphingosine (GluSph) | Avanti lipids | Cat #860535 |
| Dynasore | Santa Cruz Biotech. | Cat #sc-202592 |
| GCS inhibitor | AdooQ Bioscience | Cat #A15466 |
| Proteinase K (PK) | Thermo Fisher Scientific | Cat #17916 |
| Thioflavine S | Sigma | Cat #T1892 |
| Thioflavine T | Abcam | Cat #ab120751 |
|
| ||
| Critical Commercial Assays | ||
|
| ||
| Genomic DNA isolation kit (DNeasy Blood and Tissue Kit) | QIAGEN | Cat #69504 |
| Maxiprep Kit (endotoxin-free) | QIAGEN | Cat #12362 |
| T7 Endonuclease I | New England Biolabs | Cat #M0302 |
| PureLink RNA Mini Kit | Thermo Fisher Scientific | Cat #12183018A |
| ELISA for alpha-Syn | Biolegend | Cat #844101 |
| LDH Cytotoxicity Kit | Pierce | Cat #88953 |
| CellTagTM 700 | Li-Cor Biosciences | Cat # 926-41090 |
| Quantitative RT-PCR: SNCA (ID:Hs00240907_m1) | Thermo Fisher Scientific | N/A |
| Quantitative RT-PCR: GAPDH (ID:Hs02758991_g1). | Thermo Fisher Scientific | N/A |
|
| ||
| Experimental Models: Cell Lines | ||
|
| ||
| H4 neuroglioma cells (sex origin unknown) | Mazzulli et al., 2011; From: Pamela McLean (Mayo Clinic, Jacksonville, Florida, USA) | N/A |
| iPS-derived midbrain neurons: Control WT, Male origin (C1, C3) | C1, C3; Mazzulli et al., 2011, 2016a; Somatic cells originally from: Hedrich et al., 2006 | N/A |
| iPS-derived midbrain neurons: Control (ND41866), male sex; PD SNCA trp Patient (ND34391), Female sex | This paper; Coriell cell repository | N/A |
| iPS-derived midbrain neurons: GD patients (N370S/c.84dupG (male origin) or L444P/L444P (female origin)) | Mazzulli et al., 2016a; Somatic cells originally from: Coriell cell repository | N/A |
|
| ||
| Oligonucleotides | ||
|
| ||
| CRISPR/Cas9n; SNCA gene guide RNA 1: 5′CACAACTCCCTCCTTGG-3′ | This paper, designed with: http://crispr.mit.edu/ | N/A |
| CRISPR/Cas9n; SNCA gene guide RNA 2: 5′AAACCAAACAGGGTGTGG -3′ | This paper, designed with: http://crispr.mit.edu/ | N/A |
| PCR primer to validate PGK-puro insertion (on genomic DNA): 5′ATAAAATCT GTCTGCCCGCTCTC | This paper, generation: Integrated DNA Technologies | N/A |
| PCR primer to validate PGK-puro insertion (on genomic DNA): 5′TGGGCTTGT ACTCGGTC | This paper, generation: Integrated DNA Technologies | N/A |
| PCR primer to validate PGK-puro insertion (on genomic DNA): 3′TTCTACGAG CGGCTCGGCTT | This paper, generation: Integrated DNA Technologies | N/A |
| PCR primer to validate PGK-puro insertion (on genomic DNA): 3′TGGTCATC CTCCACCTGACT | This paper, generation: Integrated DNA Technologies | N/A |
| Sequencing primer of off-targets on genomic DNA (ADAMTSL4): Fwd: GGTGGTGTCTGG CGTTCTGT | This paper, generation: Integrated DNA Technologies | N/A |
| Sequencing primer of off-targets on genomic DNA (ADAMTSL4): Rev: TCCCTCCTCCTTCCAAGTGCAG | This paper, generation: Integrated DNA Technologies | N/A |
| Sequencing primer of off-targets on genomic DNA (ARHGAP32): Fwd: GGCCTGGGTTCCAATTCTGACT | This paper, generation: Integrated DNA Technologies | N/A |
| Sequencing primer of off-targets on genomic DNA (ARHGAP32): Rev: GAACGTGCCCAGAACAACCGAA | This paper, generation: Integrated DNA Technologies | N/A |
| Sequencing primer of off-targets on genomic DNA (ATG9B): Fwd: TTGCAGCTGCGCCACTTCAA | This paper, generation: Integrated DNA Technologies | N/A |
| Sequencing primer of off-targets on genomic DNA (ATG9B): Rev: GCGCTTCACATCCATAAGGGCA | This paper, generation: Integrated DNA Technologies | N/A |
| Sequencing primer of off-targets on genomic DNA (SEMA4B): Fwd: GAGAGGACCAGGGTGCAGTTAG | This paper, generation: Integrated DNA Technologies | N/A |
| Sequencing primer of off-targets on genomic DNA (SEMA4B): Rev: GATCACCGAGGGTACCAGTCCC | This paper, generation: Integrated DNA Technologies | N/A |
| Sequencing primer of off-targets on genomic DNA (SLC26A1): Fwd: CCTTCTACGAGGATGCCACAGAGT | This paper, generation: Integrated DNA Technologies | N/A |
| Sequencing primer of off-targets on genomic DNA (SLC26A1): Rev: GCCTTCTGGAAACACAGAGACCCT | This paper, generation: Integrated DNA Technologies | N/A |
| Sequencing primer of off-targets on genomic DNA (SLC26A3): Fwd: GCATTCACATGTGCATGGTGCC | This paper, generation: Integrated DNA Technologies | N/A |
| Sequencing primer of off-targets on genomic DNA (SLC26A3): Rev: AGGAAGGAGGCATGGACAGTGA | This paper, generation: Integrated DNA Technologies | N/A |
| Sequencing primer of off-targets on genomic DNA (SNCB): Fwd: AGCTGGGGAAGGGGATGGAAA | This paper, generation: Integrated DNA Technologies | N/A |
| Sequencing primer of off-targets on genomic DNA (SNCB): Rev: CTTTCATCACTGCACTGGTCCCTG | This paper, generation: Integrated DNA Technologies | N/A |
| Sequencing primer of off-targets on genomic DNA (SNCG): Fwd: ATCGGCGTCAATAGGAGGCATC | This paper, generation: Integrated DNA Technologies | N/A |
| Sequencing primer of off-targets on genomic DNA (SNCG): Rev: GGCCTCTTCCTGCTGTGTCT | This paper, generation: Integrated DNA Technologies | N/A |
| Sequencing primer of off-targets on genomic DNA (TSC2): Fwd: TGCTCTGCTCTCTGCTCCATGGTA | This paper, generation: Integrated DNA Technologies | N/A |
| Sequencing primer of off-targets on genomic DNA (TSC2): Rev: TCGCAGGTGAAGGGACAGTTTC | This paper, generation: Integrated DNA Technologies | N/A |
|
| ||
| Recombinant DNA | ||
|
| ||
| Cas9-nickase plasmid PX335 | Ran et al., 2013, Addgene | Cat #42335 |
| HR plasmid: PITX3-2A-eGFP-PGK-Puro backbone | Addgene | Cat #31943 |
| pLKO.1 alpha-Syn shRNA | Thermo Fisher Scientific | TRCN0000003736 |
|
| ||
| Software and Algorithms | ||
|
| ||
| Snapgene software | http://www.snapgene.com/ | N/A |
| GraphPad Prism software V6 | https://www.graphpad.com/scientific-software/prism/ | N/A |
| Odyssey software (Image Studio V3.1.4) | Li-Cor Biosciences; https://www.licor.com/bio/products/software/image_studio/ | N/A |
| Adobe Photoshop CS | Adobe; https://www.adobe.com/products/photoshop.html | N/A |
|
| ||
| Other | ||
|
| ||
| Lipofectamine 3000 | Thermo Fisher Scientific | Cat #L3000008 |
| Taq DNA polymerase | New England Biolabs | Cat #E5000S |
| Q5 High Fidelity DNA polymerase | New England Biolabs | Cat #M0491 |
| Matrigel (Corning) | Fisher Scientific | Cat #CB-40234 |
| mTeSR1 | StemCell Technologies | Cat #85850 |
| Neurobasal media | Thermo Fisher Scientific | Cat #21103-049 |
| NeuroCult SM1 supplement | StemCell Technologies | Cat #05711 |
Method Details
Cell culture
H4 cell culture
Inducible human H4 neuroglioma cells express α-Syn under the control of a tetracycline-responsive promoter (tet-off) were described previously (Mazzulli et al., 2011). Cells were cultured in Optimem media containing 5% fetal bovine serum, 200 μg/ml Geneticin and Hygromycin, and 1% penicillin/streptomycin (from http://www.thermofisher.com/us/en/home.html). α-Syn expression was turned off by the addition of 1 μg/ml doxycycline (DOX).
iPS cell culture and neuronal differentiation
Procedures for iPS cell culture and differentiation into midbrain dopaminergic neurons have been described in detail previously (Mazzulli et al., 2016a). Established iPSC lines from healthy controls were used including lines C1, C3 (Mazzulli et al., 2016a), and ND41866 from the Coriell cell repository. Patient derived lines from Gaucher patient (expressing N370S / c.84dupG, or L444P / L444P) or triplication of the SNCA gene (SNCA trp) were previously described and extensively characterized (Mazzulli et al., 2016a; Schöndorf et al., 2014). In brief, iPSC lines were generated through retroviral expression of OCT4, SOX2, cMYC and KLF4 in fibroblasts. After successful generation of iPSCs, karyotype and pluripotency markers were measured (OCT4, Tra-1-60, SSEA4 and NANOG). Control as well as the SNCA trp iPSCs were genotyped and validated to not contain mutations in GBA1 and other PARK genes.
iPSCs were differentiated into midbrain DA neurons (iPSn) using an established protocol (Kriks et al., 2011). iPSCs were maintained on matrigel coated dishes with mTeSR1 media and groomed / passed once per week. For differentiation, iPSC colonies were enzymatically dissociated and seeded onto matrigel-coated 6 well dishes to reach 80% confluency. When fully confluent, the differentiation protocol was initiated by changing the media to KSR media with dual SMAD inhibitors and carried out for 10-15 days with the addition of growth and differentiation factors as noted in detail previously (Kriks et al., 2011). Confluent cell layers were first passaged en block between day 10 and 15 to help control neutralization variability. This was done by mechanical dissociation of the thickened cell layers into squares of ca. 2 mm2 and plated on 10 cm dishes, which were coated with poly-d-lysine (PDL, 33 μg/ml) / 5 μg/ ml laminin. After 25 to 30 days, the cells were passaged by accutase treatment, counted, and 2×10⁵ cells / cm2 were seeded for each experiment on poly-d-lysine (PDL) / laminin culture dishes until analysis. iPSC control lines were differentiated for 60-90 days for each experiment. PD and GD patient iPS lines were differentiated for 90-120 days to assure the presence of pathological aggregation of α-Syn. The growth factors for neuralization were withdrawn at day 40 to 50. Neurons were maintained in neurobasal media (Thermo Fisher Scientific, #21103-049) containing NeuroCult SM1 supplement (StemCell Technologies #05711) and 1% penicillin/ streptomycin. The effects of CBE on α-Syn were repeated in all iPS control lines derived from distinct individuals.
The quality of iPSCs and neurons were routinely checked every 3 months for the presence of mycoplasma, and only neuronal culture sets that passed all quality control measures were used for experiments. These measures include the presence of neuronal and midbrain dopamine markers (FOXA2, LMX1A, β–iiiTubulin, Tyrosine Hydroxylase, and synpasin) by immunostaining and western blot (see below under Analysis of midbrain neurons from iPSC) and have been described in detail previously (Mazzulli et al., 2016a). During the routine culturing of cells and neurons, the identity of the cell line was known by the experimenter.
CRISPR/Cas9n of iPSCs
Generation of CRISPR-Cas9 guide RNA plasmids
The guide RNA pair was designed using the Optimized CRISPR design tool (http://crispr.mit.edu/) targeting the transcriptional start site of human SNCA gene. Guide RNA 1: 5′-AGCAGCCACAACTCCCTCCTTGG-3′; guide RNA 2: 5′- TGAGAAAACCAAACAGGG TGTGG-3′. The pair of custom DNA oligonucleotides (Integrated DNA Technologies) with the 20-nt guide sequence was cloned into a Cas9-nickase plasmid PX335 (Addgene, #42335) as previously described (Ran et al., 2013). The homologous recombination (HR) plasmid was designed to interrupt exon 2 of α-Syn by insertion of a puromycin resistance cassette driven by the phosphoglycerate kinase (PGK) promoter. The HR plasmid was generated by Gibson assembly of following PCR products: the 5′ and 3′ homology arms of SNCA gene (750bp), PITX3-2A-eGFP-PGK-Puro backbone (Addgene, #31943), the selection marker cassette loxp-PGK-Puroloxp. Gibson primers were generated using Snapgene software (http://www.snapgene.com/). The genomic DNA isolated from the targeting iPS line was used as template to amplify the homology arm regions of SNCA. All plasmids were isolated using endotoxin-free Maxiprep Kit (QIAGEN) and Sanger-sequenced before use.
Selection of CRSIPR/Cas9 iPSC clones
iPSC line from control (C3; Mazzulli et al., 2016a) was transfected with two gRNA-Cas9-nickase plasmids with the HR plasmid using lipofectamine 3000 (Thermo Fisher Scientific). 2 days after transfection, puromycin was added to cultures at 1 μg/ml and cultured for an additional 3 weeks until colonies were visible. 10 total puro-resistant clones were picked and analyzed for the PGK-puromycin insertion by PCR. Genomic DNA from iPSC clones was isolated using DNeasy Blood and Tissue Kit (QIAGEN). Insertion of the PGK-Puro cassette was assessed through PCR of the 5′ and 3′ end of insertion cassette using the primer sets: 5′ F: CATAAAAT CTGTCTGCCCGCTCTC, 5′ R: GTGGGCTTGTACTCGGTC and 3′ F: CTTCTACGAGCGGCTCGGCTT, 3′ R: TGTGGTCATCCTC CACCTGACT. Genomic DNA (200ng) was amplified using Taq DNA polymerase (New England Biolabs, https://www.neb.com/) by the following PCR protocol: 95°C for 3 minutes, 35 cycles of (95°C for 30 s, 57°C for 30 s, and 68°C for 2 minutes), and 68°C for 10 minutes. The PCR product was analyzed by agarose gel electrophoresis using ethidium bromide-stained 1.5% agarose gel.
Analysis of off-target effects in iPSCs
Genomic regions of iPSCs were amplified using Q5 High Fidelity DNA polymerase (New England Biolabs) by the following PCR protocol: 98°C for 30 s, 35 cycles of (98°C for 30 s, 70°C for 30 s, 72°C for 2 minutes) and 72°C for 10 minutes. The list of target primers used are given in table below. For the T7EI cleavage assay, the PCR amplicons were denatured and hybridized in a thermal cycler: 95°C for 10 minutes, 95-85°C (ramp rate −2°C/sec), and 85-25°C (ramp rate −0.2°C/sec). The hybridized PCR product was digested using T7 Endonuclease I (New England Biolabs) for 1 hour at 37°C. Equal volumes of undigested and digested PCR products were resolved on 1.5% agarose gel along with positive control (Genecopoeia).
|
| ||||
| Gene Name | Forward Primer | Reverse Primer | ||
|
| ||||
| ADAMTSL4 | GGTGGTGTCTGGCGTTCTGT | TCCCTCCTCCTTCCAAGTGCAG | ||
| ARHGAP32 | GGCCTGGGTTCCAATTCTGACT | GAACGTGCCCAGAACAACCGAA | ||
| ATG9B | TTGCAGCTGCGCCACTTCAA | GCGCTTCACATCCATAAGGGCA | ||
| SEMA4B | GAGAGGACCAGGGTGCAGTTAG | GATCACCGAGGGTACCAGTCCC | ||
| SLC26A1 | CCTTCTACGAGGATGCCACAGAGT | GCCTTCTGGAAACACAGAGACCCT | ||
| SLC29A3 | GCATTCACATGTGCATGGTGCC | AGGAAGGAGGCATGGACAGTGA | ||
| SNCB | AGCTGGGGAAGGGGATGGAAA | CTTTCATCACTGCACTGGTCCCTG | ||
| SNCG | ATCGGCGTCAATAGGAGGCATC | GGCCTCTTCCTGCTGTGTCT | ||
| TSC2 | TGCTCTGCTCTCTGCTCCATGGTA | TCGCAGGTGAAGGGACAGTTTC | ||
|
| ||||
Quantitative RT-PCR of α-Syn in iPSC
Total RNA was isolated from iPSC-derived neurons at day 60 using the PureLink RNA Mini Kit (Thermo Fisher Scientific). cDNA was synthesized using the RevertAid First Strand cDNA Synthesis Kit (Thermo Fisher Scientific). The Real-time PCR was performed on a Applied Biosytems 7500 Fast system using pre-designed Taqman-primer probe sets: SNCA (ID:Hs00240907_m1) and GAPDH (ID:Hs02758991_g1). The quantification is represented as fold change of SNCA mRNA expression normalized to GAPDH levels by delta-Ct method. The values are mean and s.e.m of three biological replicates (n = 3) with three technical replicates for each.
Analysis of midbrain neurons from iPSC
α-Syn knock-out iPSC were differentiated and analyzed for the presence of midbrain and neuronal markers after 60 days of differentiation. Neurons were lysed in 1% Triton X-100 extraction buffer (see recipe under Cell lysis and sequential extraction of cell lysates), and analyzed for tyrosine hydroxylase (TH) and synapsin by western blot analysis. Neurons were also fixed in 4% paraformaldehyde and analyzed by immunofluorescence analysis as previously described (Mazzulli et al., 2016a), with antibodies against TH and midbrain marker FOXA2. The cell population of FOXA2 / TH positive neurons was quantified and compared to the unedited control line.
Biochemistry and cell biology
Isolation of HMW α-Syn forms from cells
HMW α-Syn conformers were obtained from iPSC-derived neurons and H4 cells. Cells were harvested in 1% Triton X-100 buffer (see recipe under Cell lysis and sequential extraction of cell lysates) and 2 mg of the 100,000 × g soluble cell lysate was purified by size exclusion chromatography (SEC) using a Superdex 200 HR 10/300 column (GE Healthcare). Fractions 1-3 (void-73 Å) were combined to obtain HMW forms of α-Syn and fractions 7-9 (40-20 Å) for the monomer. Amicon Ultra centrifugal concentrators (10 K, Millipore#UFC501096) were used to concentrate the fractions. Isolated HMW α-Syn from H4 cells or iPSn was combined from three injections of 2 mg each and concentrated to a total volume of 500-600 μl. GSL-induced oligomers were obtained in a similar way, from H4 cells or control neurons treated with 50 μM of GCase inhibitor conduritol-b-epoxide (CBE) for 5-7 days and media changes every 2 days. During isolation, the identity of the HMW species was known by the experimenter.
Analysis of α-Syn by gel filtration
Size exclusion chromatography (SEC) was performed with Triton X-100 soluble lysates, which were fractioned as described previously (Mazzulli et al., 2006) with a superdex 200 HR 10/300 gel filtration column (https://www.gelifesciences.com/) using a mobile phase of either 150 mM NaCl, 25 mM HEPES, pH 7.4 or phosphate buffered saline at pH 7.4 (PBS) (sample injection volume.: 800 μg lysate into 250 μl, flow rate at 0.3 ml/min; 0.5 mL sized fractions). Fractions were concentrated and analyzed for α-Syn by western blot analysis (described below). α-Syn was also analyzed using a TOSOH SuperSW3000 gel filtration column (sample volume = 50 μg lysate in 30 μl, flow rate at 0.3 mL/min, 0.1 mL sized fractions) followed by either western blot or ELISA for α-Syn where indicated. ELISA was performed as instructed (Biolegend, # 844101). To account for potential technical variabilities, the order of sample injection on the HPLC was randomized. In most cases, the identity of the sample was not revealed during the HPLC run but was revealed after analysis by Western or ELISA.
Treatment of H4 cells with HMW α-Syn forms
HMW α-Syn generated in vitro
H4 neuroglioma cells were seeded at a cell number of 2×10⁴ per 96 well and treated once with 80 ng of recombinant α-Syn (without lipid: monomer or mixed with lipids: PC and GluCer). Additionally, lipid only controls (700 μM) were added to the cells. To determine if intracellular uptake of exogenously added α-Syn was required, 50 μM Dynasore (Santa Cruz Biotech., #sc-202592) was applied. Cells were treated in triplicates or quadruplicates. After 4 days of incubation, cells were analyzed for toxicity: media was taken for LDH assay and cells were stained for neurofilament and analyzed for cell volume (see protocols below). The order of the treatment and placement in the cell culture wells was changed in each experiment to account for any potential technical variations.
HMW α-Syn from cells
Control iPSn (line C3; Mazzulli et al., 2016a) were seeded on a PDL/laminin coated 96 well plate at day 30 and analyzed at day 65. Isolated HMW α-Syn (fractions 1-3) from PBS or CBE treated cells was quantified by C-20 western blot using a standard curve derived from purified recombinant α-Syn. Neurons were treated for 4 days with 20 ng HPLC-purified HMW α-Syn species, extracted from H4 cells treated with PBS or CBE. Neurons were stained for neurofilament and analyzed for cell volume to determine viability (see protocol below). The order of the treatment and placement in the cell culture wells was changed in each experiment to account for any potential technical variations.
Analysis of cell toxicity
Neurofilament staining
Treated iPSn were immediately fixed in 4% formaldehyde for 15 minutes and washed three times with PBS. To permeabilize the cells, they were incubated with PBS containing 0.3% Triton X-100 for 30 minutes, then blocked with Odyssey blocking buffer (Li-Cor Biosciences) for 1 hour. Anti-neurofilament antibody (1:750, mouse IgG, Biolegend, SMI-312, #837904) was then incubated overnight in blocking buffer at 4°C, followed by washing in PBS with 0.1% Tween for 20 minutes. IRdye 800-conjugated anti-mouse IgG antibodies (1:1000 dilution, Li-Cor Biosciences) was then added in blocking buffer containing 0.2% Tween for 1 hour. The order of the treatment and placement in the cell culture wells was changed in each experiment to account for any potential technical variations.
Cell volume staining
CellTag 700 (Li-Cor Biosciences) was added to measure total cell volume, along with the secondary antibody. Cells were washed four times in PBS containing 0.1% Tween and scanned on an odyssey infrared imaging system (Li-Cor Biosciences). Neurofilament and CellTag intensity was determined using Odyssey software (Li-Cor Biosciences). The order of the treatment and placement in the cell culture wells was changed in each experiment to account for any potential technical variations.
Lactate dehydrogenase (LDH) assay
An LDH Cytotoxicity Kit was used to measure cytotoxicity. Assays were performed according to the manual (Pierce, #88953). In brief, 50 μL of cell media was incubated with 50 μL of reaction mixture in a 96 well plate and incubated for 30 mins at room temperature. After adding the stop solution, absorbance was measured at 490 nm and 680 nm in a Molecular Devices i3 microplate reader. To determine LDH activity, absorbance at 680 nm was subtracted from the 490 nm absorbance. The order of the treatment and placement in the cell culture wells was changed in each experiment to account for any potential technical variations.
Treatment of cultures
Glucosylceramide synthase (GCS) inhibitor
H4 or patient derived iPSn lines were treated with an established GCS inhibitor, eliglustat (AdooQ Bioscience, http://www.adooq.com/), at 10 to 50 nM as indicated for either 5 days (H4) or one month (iPSn). GCS inhibitor was dissolved in DMSO at a stock of 10 mM and diluted to a workable concentration in culture media. In parallel, cultures were treated with DMSO alone as a control. The inhibitor was replaced every 48 hours until cells were harvested. Treated cultures were either fixed and stained for immunofluorescence analysis or extracted for western blot / SEC analysis. During the culturing of cells, the experimenter was not blinded to the treatment.
GCase activator (758)
Gaucher patient derived iPS-derived midbrain neurons (N370S / c.84dupG) were treated with a small molecule GCase activator, 758, at 10 μM for 14 days (Mazzulli et al., 2016b). During the culturing of cells, it was not possible to blind the experimenter to the treatment due to the differences in the appearance of the solution by 758.
Cell lysis and sequential extraction
Cells were harvested in phosphate buffered saline (PBS), pH 7.4, and pelleted by centrifugation at 400× g for 5 minutes. Cell pellets were extracted in 1% Triton X-100 buffer (1% Triton X-100, 20 mM HEPES pH 7.4,150 mM NaCl, 10% glycerol, 1 mM EDTA, 1.5 mM MgCl2, 1 mM phenylmethanesulfonyl fluoride (PMSF), 50 mM NaF, 2 mM Na orthovanadate, and a protease inhibitor cocktail (Roche diagnostics, https://www.roche.com/, # 11-836-170-001)) by homogenization, incubated on and ice-water slurry for 20 minutes, frozen and thawed twice, and ultracentrifuged at 100,000 × g, 4°C for 30 minutes. Supernatant (Triton-soluble fraction) was used for Bradford or BCA (Pierce) protein assay.
The Triton-insoluble pellets were solved in SDS-lysis buffer (2% SDS, 50 mM Tris, pH7.4 and a protease inhibitor cocktail (Roche diagnostics)). The samples were boiled for 10 min, sonicated three times for 3 s, boiled again for 10 min and centrifuged at 100,000×g for 30 min at 22°C. Protein concentration was measured by BCA assay (Pierce).
Western Blot Analysis/Antibodies
For cell lysates, 40 μg of protein (Triton-soluble and insoluble) were used in SDS-PAGE analysis. For SEC-isolated HMW species α-Syn (H4 cells: 40 μg of protein; mouse brain: 50 μg of protein; patient midbrain neurons: 50-65 μg of protein) were used for PK digest and subsequently loaded on SDS-PAGE. For PK digest of recombinant α-Syn (with and without lipid) 75 ng of pure α-Syn were digested and loaded on SDS-gels. For analysis of SEC-isolated HMW α-Syn with different α-Syn antibodies, the two samples (PBS and CBE treated) were not loaded by same protein amount, but adjusted to C-20 α-Syn signal.
Samples were loaded onto 12% SDS-PAGE gels, transferred onto PVDF membranes (Millipore) and post-fixed in 0.4% paraformaldehyde (PFA) for 30 min followed by three washes with water. Membranes were blocked in a 1:1 mixture of TBS: Odyssey blocking buffer (Li-Cor Biosciences) for 1 hour. Primary antibodies were incubated overnight at 4°C (LB509, Abcam, 1:100; syn211, Thermo Fisher, 1:1000; C20, Santa Cruz Cruz #SC-7011-R, 1:2000; syn303, Biolegend, 1:1000). Loading controls GAPDH (Millipore), neuron specific enolase (NSE; Polysciences, #17437), alpha-tubulin (Sigma) or b-iii tubulin (TUJI, Biolegend, #MRB-435P-100) were used at 1:5000. Synapsin (Life Technology, #A-6442) and Tyrosine Hydroxylase (Sigma, TH-2, #T1299) were used at 1:500. Detection was carried out with fluorescent-conjugated anti-rabbit or mouse antibodies with Alexa 680 (Thermo Life Technologies) or IRDye 800 (Li-Cor Biosciences), and scanned / quantified using a Li-Cor infrared imaging system. The order of samples loaded onto gels was randomized in order to account for any technical variations.
Native dot blot analysis
HMW α-Syn conformers from control or GSL-accumulating conditions were applied onto nitrocellulose membranes, fixed in 0.4% PFA for 30 minutes, blocked in TBS with Odyssey blocking buffer (1:1) for 30 min, then primary antibodies were incubated overnight in TBS-Tween mixed with Odyssey blocking buffer (1:1 mix). The following anti-α-Syn primary antibodies were used:
|
| ||||
| Name | epitope (residues) | Company | Cat # | dilution |
|
| ||||
| F-11 | 2-25 | Santa Cruz | sc-514908 | 1:500 |
| LS-C352877 | 15-55 | LifeSpan Biosciences | LS-C352877 | 1:500 |
| 5C2 | 61-95 | Novus Biologicals | NBP1-04321 | 1:200 |
| syn-1 | 91-99 | BD Biosciences | 610787 | 1:500 |
| syn211 | 121-125 | Sigma-Aldrich | 36-008-25UL | 1:500 |
| S9500 | ∼130 | Biomol GmbH | S9500-01E.100 | 1:500 |
|
| ||||
Primary antibodies were detected with fluorescent-conjugated secondary antibodies as described under western blot analysis and quantified with Li-Cor Image Studio software. Blots were then boiled in 1% SDS, 25 mM HEPES, pH 7.4, followed by re-probing with the same antibodies. Denatured blots were quantified, and compared to the corresponding native condition blots. Antibody reactivity was quantified before and after denaturing and normalized to the standard unfolded recombinant monomeric protein using Li-Cor Image Studio (V 3.1.4). Buried or solvent-exposed amino acid regions were determined by quantifying the change in antibody reactivity after denaturation. If no change in antibody reactivity occurred after boiling, this was interpreted as a solvent exposed region. The identity of the HMW species was not revealed until after the image was scanned and analyzed.
Proteinase K digest
Of recombinant protein
Recombinant α-Syn was incubated with GluCer as described below, for 1 hour with shaking, then incubated with varied concentrations of proteinase K (PK) (Thermo Fisher Scientific) as indicated in the figures for 30 min at 37°C. The reaction was terminated by the addition of SDS-containing sample buffer and boiling, followed by western blot analysis using antibodies C-20 and LB509.
Of SEC-purified cell lysates
HMW α-Syn isolated from H4 cells or iPSn (50 μg total fraction per condition) was treated with varied concentrations of PK as indicated, and analyzed by western blot as described above.
In Vitro Activity Assay of GCase
As described previously (Mazzulli et al., 2011), cells were washed in PBS, harvested in 1% Triton lysis buffer, and GCase activity was measured from whole-cell lysates using 4-methylumbelliferyl β-D-glucopyranoside (4-MU-Gluc; Sigma-Aldrich). In brief, 2-5 μg of total protein lysate was incubated with 1% BSA, 1 mM 4-MU-Gluc in activity assay buffer (0.25% (v/v) Triton X-100 (Sigma-Aldrich, #T-8787), 0.25% (w/v)Taurocholic acid (Sigma-Aldrich, #T9034), 1 mM EDTA, in citrate/phosphate buffer, pH 5.4) for 30 min at 37°C. The assay was stopped by adding equal amount of stopping solution (1 M glycine, pH 12.5). 4-MU-Gluc fluorescence (ex = 355 nm, em = 460 nm) was detected in a Molecular Devices i3 microplate reader using fluoro plates (Nunc, #475515). To control for assay and substrate specificity, samples were additionally incubated with 200 μM of GC inhibitor CBE. Relative fluorescent units (RFUs) from CBE-treated lysates were subtracted from non-CBE-treated lysates. Obtained GCase activity was normalized to protein amount and is expressed as fold change.
In vitro assays
Generation of α-Syn HMWspecies in vitro
Lipids (brain phosphatidylcholines (PC), #840053P; Glucosylceramide (GluCer), #860547; Glucosylsphingosine (GluSph), #860535) were purchased from Avanti lipids. PC was dissolved in Chloroform (HPLC grade) at 25 mg/ml and GluCer/ GluSph were solubilized in chloroform: methanol:water (80:80:2) at 10 mg/ml. Resuspended lipids were dried for 10-20 mins in a glass test tube under a nitrogen stream on ice. The lipid film was hydrated in 100 μL PBS and sonicated in ultrasonic bath for 30 mins at 25°C followed by 2 freeze and thaw cycles and an additional sonication for 10-60 min until the solution was clear. Human α-Syn was expressed in E. coli and purified by HPLC as described previously (Mazzulli et al., 2007). Purified α-Syn was diluted in 0.1 M sodium acetate buffer, pH 5.0, at a concentration of 2 mg/ml. Lipids and α-Syn were mixed in a ratio of 1:10 (protein: lipid) final concentration. Lipids at 1.38 mM were added to equal volumes of diluted α-Syn for final concentrations of 69 μM α-Syn and 690 μM liposomes. Samples were incubated at 37°C with constant shaking, which initiates the formation of aggregates from monomers, at 1000 rpm for 1 hour. Evaporation was controlled with a mineral oil overlay. Lipid additons could not be performed in a blinded manner due to noticeable difference in the solution of the lipid suspensions, however the measurements were analyzed in a blinded manner.
In vitro conversion of physiological α-Syn
Fractions obtained from size exclusion chromatography (see above) containing HMW species (fractions 1-3) or LMW monomers (fractions 7-9) were isolated from either control iPSn or untreated H4 cells and incubated without shaking (quiescent) with purified lipid dispersions (500 nM) made of 75% GluCer and 25% PCfor2-to-30 min, 37°C, at pH 5.5. In parallel, HMW or LMW physiological conformers were incubated with PC alone. Breakdown of HMW conformers by lipid addition was assessed by re-injecting 30 μg of the isolated HMW fraction onto a SuperSW3000 TOSOH SEC column followed by ELISA of the collected fractions (Biolegend), and expressed as fold change compared to control reactions (PBS or 100% PC). As a positive control, HMW species were incubated with 0.1% SDS in parallel to assure that species breakdown was detectable by this assay. To monitor structural conversion of HMW physiological conformers, both FRET and PK sensitivity assays were used. For PK digestion, samples were incubated at different concentrations as indicated followed by western blot as described above. To determine the kinetics of HMW conversion by FRET, samples were removed after each time point (2, 10, and 30 minutes), and PFA was added at 1% final on ice to stop any further conformational changes. Samples were then immediately applied to coated coverslips for FRET analysis. Conversion from monomers to HMW species by GluCer was measured by FRET analysis, and also by SEC analysis using 30 μg of the isolated LMW fraction containing α-Syn + lipid incubations on a SuperSW3000 TOSOH SEC column, followed by α-Syn ELISA of collected fractions (Biolegend).
Reversal of α-Syn conversion
To determine if the effects of GluCer on α-Syn structure were reversible, HMW conformers were obtained from control neurons and treated with 75% GluCer/ 25% PC as described above for 10 min to convert into an assembly competent form. An aliquot of the sample was removed as time = 0, fixed in 1% PFA and applied to a coated coverglass to allow for attachment. The remaining sample was incubated with anti-GluCer antibodies (Glycobiotech, # RAS_0011) for 30 min, 4C, rotating end-over-end, then antibodies GluCer was removed by pull-down with protein A/G agarose beads (Santa Cruz Biotech, #sc-2003). Samples containing HMW α-Syn cleared of GluCer were incubated in PBS, pH 7.4 at 37°C for indicated times (2, 10, 30 min), fixed with 1% PFA, and applied to coated glass coverslips. FRET analysis was used to monitor conversion changes as described above. The identity of the sample was not revealed until after the analysis.
In Vitro Seeding Assays
Thioflavin T analysis
Recombinant α-Syn monomers were purified from transformed E. coli (Mazzulli et al., 2007) and incubated with HMW fractions (#1-3) containing HMW α-Syn species isolated from CBE treated human iPSn (70 μM purified monomers mixed with 14 nM HMW species, or 1:5000 dilution). In parallel, synthetic seed fibrils were used as a positive control at 14 nM, whereas monomer with no addition (PBS), equivalent amount of BSA, or monomers from CBE treated neurons were used as controls. Samples were mixed and incubated at pH 7.4 in PBS at 37°C with a mineral oil overlay, under quiescent conditions. Under these conditions, fibril assembly does not occur to a significant extent in the absence of seeds (Buell et al., 2014). 10 μL aliquots were removed at 0, 15, 26, 41, and 68 hr and mixed with 10 μM thioflavin T in glycine buffer (pH 8.5). Fluorescence was detected using a Spectramax Gemini microplate reader using Softmax Pro V6.0 software (Molecular Devices), with excitation at 450nm, emission at 482 nm, and cutoff at 475 nm. Relative fluorescence units were expressed as fold change over time for each condition. Measurements were repeated using two different batches of neuronal derived HMW species and monomers, with 4 technical replicates for each experiment. The order of the samples were randomly analyzed to account for technical variations. The identity of the sample was not revealed until after the measurements were acquired.
Centrifugal sedimentation analysis
For sedimentation analysis, samples were incubated for 68 hours and centrifuged at 100,000 × g for 1 hour at 4°C. The supernatant was removed, and the pellet was resuspended in the same volume found in the supernatant. Equal volumes of supernatant and pellet fractions were loaded onto SDS-PAGE gels followed by western blot analysis using syn303 and C-20. Pelletable α-Syn was quantified in each condition and expressed as fold change compared to BSA control. The assay was repeated four times.
To determine the seeding ability of HMW α-Syn converted in vitro by GluCer, samples were incubated with GluCer + PC dispersions, PC alone, or PBS as described above. 14 nM of the converted α-Syn species were then mixed with 70 μM recombinant monomers and incubated at pH 7.4 as described above, under quiescent conditions. Aliquots were removed at 0, 8, and 24 hr, mixed with 10 μM thioflavin T and analyzed as described above. These experiments could not be performed in a blinded manner due to noticeable difference in the solution of the lipid suspensions, however the measurements were analyzed in a blinded manner.
Immunofluorescence analyses in cells
Immunofluorescence and thioflavin staining
Neurons were fixed in 4% paraformaldehyde for 15 minutes, permeabilized with 0.3% Triton X-100 in PBS, then blocked in 2% BSA, 5% normal goat serum in PBS-Triton for 30 min. LB509 (1:100) was incubated overnight, washed in PBS-Triton, then Alexa 568 conjugated anti-mouse IgG was used to detect α-Syn while Alexa 488 conjugated anti-rabbit was used to detect TH. Next, thioflavin S (ThioS) staining was performed as previously described (Mazzulli et al., 2016a). The number of cells with α-Syn and Thio S in the cell body were scored and normalized to total cells in the field of view (calculated by nuclear DAPI stain). Only the Thio S + cells that co-localized with α-Syn were counted. At least 3 fields of view were used per coverslip, and 100-500 cells counted per condition, per cell line. Images were obtained on a Leica epifluorescence microscope using a 40× objective (DMI3000B). To determine synaptic localization of α-Syn, neurons were fixed as described but permeabilized in 0.1% Triton-containing blocking buffer. Anti-synapsin antibodies (Thermo Fisher Scientific, A6442, 1:50 dilution) with LB509 (1:100 dilution) were detected with Alexa-conjugated secondary antibodies as described above and analyze by confocal microscopy as described (Mazzulli et al., 2016a). Synapsin / α-Syn colocalized puncta was quantified from merged images and expressed as fold change compared to control conditions. The quantification represents the mean (+/− standard error of the mean) from 5 different fields of view with at least 100 puncta counted per field. For colocalization analysis pictures were kept at same color intensities and colocalization of α-Syn with synapsin was determined by Pearson's Index utilizing ImageJ (Wayne Rasband, NIH, USA) with a colocalization plugin (Coloc 2).
GluCer / α-Syn colocalization was determined in PFA fixed day-60 cultures, permeabilized and blocked in 3% BSA with PBS + 0.1% Triton X-100, and incubated with anti-α-Syn antibodies LB509 (1:100) orsyn505 (1:100), with anti-GluCer (1:100, Glycobiotech # RAS_0011). Detection was performed as described above, using confocal microscopy. Quantification of cells containing punctated, colocalized α-Syn with GluCer was done at 2 or 7-days post CBE treatment. The staining pattern of GluCer in physiological conditions is very diffuse in the fixation conditions used here, however under pathological conditions (CBE treatment) punctated structures were visible and only these structures were used for quantification. The analysis order of the samples was randomized to account for technical variations. The identity of the coverslips was blinded to the experimenter for most of the experiments and revealed after analysis.
Fluorescence resonance energy transfer (FRET)
FRET assays were performed using syn211 antibodies directly conjugated to Alexa Flour 488 or Alexa Flour 647 (Santa Cruz Biotech, #sc-12767 AF488 and #sc-12767 AF647). FRET using the donor Alexa 488 to acceptor Alexa 647 has been utilized previously to assess the structural state of α-Syn (Cremades et al., 2012), and similar methods have been used to measure self-association of endogenous α-Syn with syn211 (Roberts et al., 2015). For analysis of SEC fractions, samples were applied onto PDL/ laminin coated coverglass overnight at 4°C, fixed in 4% PFA, and washed several times in cold PBS. Samples were blocked in 3% bovine serum albumin (BSA) in PBS for 30 min, followed by addition of both syn211 488 and 647 antibodies at 1:50 dilution in blocking buffer for 24 hours. Control conditions were done in parallel where 488 (donor) or 647 (acceptor) were added alone. Samples were analyzed by confocal microscopy on a Leica TCS SPE using a 40× oil immersion objective (CTR4000 / DMI4000B microscope) through a 5 μm section (z series at 1 μm per section). Sequence of excitation / emission (in nm) occurred as 1) FRET, ex = 488 nm, em = 640-800 nm, 2) Donor alone, ex = 488 nm, em = 493-600 nm, 3) Acceptor alone, ex = 635 nm, em = 640-800 nm, 4) DAPI, ex = 405 nm, em = 410-600 nm. Fluorescence intensity (I) was quantified with Leica × software, and FRET efficiency was calculated as (IA/ (ID +IA)), where IA is the intensity of the acceptor after donor excitation, and ID is the intensity of the donor after donor excitation. For all experiments, analysis of knock-out lysates was used as a negative control, whereas 2 μg of recombinant fibrils were analyzed as a positive control and assumed to achieve the maximum possible FRET efficiency due to the highly ordered, polymerized structure.
For in-cell FRET measurements, cultures were fixed in 4% PFA with PBS, blocked in 3% BSA for 30 min, and syn211 488 and 647 antibodies were incubated for 24 hr at 1:50 dilution in blocking buffer. Cells were extensively washed and examined by confocal microscopy using the same sequence method as described for SEC fractions. Confocal images were analyzed by quantifying 4 randomly selected regions of interest per field, and 8-10 fields were captured per culture condition. Fluorescence values were averaged together, and at least 3 replicates (separate culture conditions) were used to calculate the mean with standard error of the mean representing the error between culture dishes. Background fluorescence and bleed-through of signals were determined through several control reactions including α-Syn expressing cells treated with donor alone or acceptor alone, analysis of cells depleted of α-Syn, and cells expressing Δ71-82 form of α-Syn, which is unable to polymerize. The addition of pre-formed fibrils (PFFs) to cultures were used as a positive control. The order of sample analysis was randomized for each experiment, and the identity of the samples were not revealed until after the analysis.
Electron Microscopy Analyses
Electron Microscopy (EM)
Neurons or H4 cells were fixed in 2% paraformaldehyde/0.1% glutaraldehyde in PBS for 30 minutes, followed by 6 PBS washes for 5 minutes each. Cell were post-fixed with 1% OsO4 in PBS for 1 hour, followed by 3 washes with H2O. Next, cells were dehydrated with ethanol (twice with 50% ethanol for 5 minutes, then twice with 70% ethanol for 10 minutes) and stained with 1% uranyl acetate in 70% ethanol for 45 minutes. Cells were further dehydrated with ethanol (once with 70% ethanol, then twice with 90% ethanol for 10 minutes, then three times with 100% ethanol for 10 minutes). To evaporate the ethanol, 1:1 LX112 resin mix (LX112, DDSA, NMA) in 100% ethanol was added to the cells for 1 hour with the lid off. Next, LX112 mix was added to the cells for 1 hour and then removed, followed by final embedding with LX112 mix + DMP30 overnight at 60°C. Samples were then sectioned on an ultra-microtome, as a service provided by the Northwestern Center for Advanced Microscopy, and viewed on a FEI Tecnai Spirit G2 TEM. The culturing of these samples were not performed in a blinded manner. The processing and slicing was done by the core facility in a blinded manner. The identity of the images obtained was not revealed to the analyzer until after examination.
Immuno-electron Microscopy
Cells were fixed in periodate-lysine-paraformaldehyde (3% paraformaldehyde, 75 mM L-lysine, and 10 mM INaO4 in 0.1 M phosphate buffer pH 7.4) for 4 hours. Next, cells were washed with 50 mM NH4Cl in PBS, and permeabilized and blocked with 0.05% saponin and 2% fish gelatin in PBS for 1 hour. Primary antibody incubations with syn505 (1:20) and anti-GluCer (1:20) (Glycobiotech) in blocking solution were done overnight at 4°C. Cells were washed 3 times with 0.05% saponin/PBS, and incubated with gold-conjugated secondary antibodies for 2 hours at 4°C. Labeling with 6 nm goat anti-mouse IgG (1:20) was used to detect syn505 while 10 nm goat anti-rabbit IgG (1:20) was used to detect anti-GluCer. Cells were then washed 3 times with 0.05% saponin / PBS, post-fixed with 1.5% glutaraldehyde in 0.1 M cacodylate buffer pH 7.4 for 20 minutes at RT, rinsed in 1X PBS. Samples were then embedded, sectioned on ultramicrotome, and viewed on a FEI Tecnai Spirit G2 TEM. The culturing of these samples were not performed in a blinded manner. The processing and slicing was done by the core facility in a blinded manner. The identity of the images obtained was not revealed to the analyzer until after examination.
Lipidomic analysis
Neuronal cultures were treated with CBE for 7 days (for control lines) or GCS inhibitor for 4 weeks (for GD line), washed, and harvested in cold PBS. Lipids were extracted from frozen cell pellets as a service provided by the lipidomics core facility at the Medical University of South Carolina. Levels of glucosylceramide, galactosylceramide, ceramide, and dihydroceramide were measured by super-critical fluid high-performance liquid chromatography/ mass spectrometry (SFC/LC-MS/MS) methodology as previously described (Bielawski et al., 2010). Analytical results of lipids were expressed as picomole (pmol) lipid level/micromole Pi (level of phospholipids present in the Bligh & Dyer lipid extract): pmol/nmol (Bligh and Dyer, 1959). The analysis was repeated 4 times from separate culture wells. The identity of the samples was blinded to the analyzer at the core facility, and later revealed during analysis.
Quantification and Statistical Analysis
Statistical tests were performed using GraphPad Prism software V6 (https://www.graphpad.com/scientific-software/prism/). ANOVA with Tukey's post hoc test was used when comparing more than two samples, while Student's t test (two-sided) was when comparing two samples. The n-numbers can be found in the figure legends. For all experiments where cells were analyzed or treated, the n-number represent distinct cell culture wells. Analyses utilizing recombinant α-Syn or isolated SEC fractions were repeated by measuring individually prepared samples at least in triplicates. For analysis of mouse brain (Figure 2F), n-number indicates the number of individual animals. Immunofluorescence and EM pictures as well as displayed western blot show representative results (exact n-numbers of experiments can be found in the figure legends).
Data and Software Availability
Data supporting the conclusions of this study can be requested from corresponding author.
Supplementary Material
Highlights.
Glycosphingolipids (GSLs) promote α-Synuclein aggregation in human iPS neurons
GSLs covert physiological α-Synuclein conformers into assembly-state species in vitro
GSL-induced neurotoxicity is potentiated by α-Synuclein
Reduction of GSLs within Parkinson's iPSns diminishes α-Synuclein pathology
Acknowledgments
We thank Peter T. Lansbury, Jr. (Harvard Medical School), Dimitri Krainc (Northwestern University), Christopher M. Dobson (University of Cambridge), and Celine Galvagnion (DZNE) for helpful discussions. We thank Michela Deleidi and Thomas Gasser (University of Tübingen) for generously providing the L444P iPSC line and Rakez Kayed (University of Texas Medical Branch) for generously providing the A11 antibody. Lipid measurements were supported in part by the Lipidomics Shared Resource, Hollings Cancer Center, Medical University of South Carolina (P30 CA138313) and the Lipidomics Core in the South Carolina Lipidomics and Pathobiology Center of Biomedical Research Excellence, Department of Biochemistry, Medical University of South Carolina (P20 RR017677). This research was supported by the National Institute of Neurological Disorders and Stroke grant R01NS092823 (J.R.M.), North-western PDMD Advisory Council (J.R.M.), the Michael J. Fox Foundation (grant ID 12158 to J.R.M.), and the Human Embryonic and Induced Pluripotent Stem Cell Facility at Northwestern University and NIH core support grant P30 NS081774.
Footnotes
Author Contributions: Conceptualization, F.Z. and J.R.M.; Methodology, F.Z. and J.R.M.; Investigation, F.Z., A.C.M., N.R.B., E.G., I.S., H.D., N.J.T., S.J., K.F., and J.R.M.; Writing – Original Draft, J.R.M.; Writing – Review & Editing, F.Z. and J.R.M.; Visualization, F.Z. and J.R.M.; Supervision, F.Z. and J.R.M., Funding Acquisition, J.R.M.
Declaration of Interests: J.R.M. is a scientific founder of Lysosomal Therapeutics, Inc., a company that uses lysosomal biology to develop treatments for neurodegenerative disease. None of the materials or reagents used in this work are directly related to the commercial interests of the company.
Supplemental Information: Supplemental Information includes seven figures and can be found with this article online at https://doi.org/10.1016/j.neuron.2017.12.012.
References
- Alcalay RN, Levy OA, Waters CC, Fahn S, Ford B, Kuo SH, Mazzoni P, Pauciulo MW, Nichols WC, Gan-Or Z, et al. Glucocerebrosidase activity in Parkinson's disease with and without GBA mutations. Brain. 2015;138:2648–2658. doi: 10.1093/brain/awv179. [DOI] [PMC free article] [PubMed] [Google Scholar]
- Baba M, Nakajo S, Tu PH, Tomita T, Nakaya K, Lee VM, Trojanowski JQ, Iwatsubo T. Aggregation of alpha-Synuclein in Lewy bodies of sporadic Parkinson's disease and dementia with Lewy bodies. Am J Pathol. 1998;152:879–884. [PMC free article] [PubMed] [Google Scholar]
- Bartels T, Choi JG, Selkoe DJ. α-Synuclein occurs physiologically as a helically folded tetramer that resists aggregation. Nature. 2011;477:107–110. doi: 10.1038/nature10324. [DOI] [PMC free article] [PubMed] [Google Scholar]
- Bessen RA, Kocisko DA, Raymond GJ, Nandan S, Lansbury PT, Caughey B. Non-genetic propagation of strain-specific properties of scrapie prion protein. Nature. 1995;375:698–700. doi: 10.1038/375698a0. [DOI] [PubMed] [Google Scholar]
- Bielawski J, Pierce JS, Snider J, Rembiesa B, Szulc ZM, Bielawska A. Sphingolipid analysis by high performance liquid chromatography-tandem mass spectrometry (HPLC-MS/MS) Adv Exp Med Biol. 2010;688:46–59. doi: 10.1007/978-1-4419-6741-1_3. [DOI] [PubMed] [Google Scholar]
- Bligh EG, Dyer WJ. A rapid method of total lipid extraction and purification. Can J Biochem Physiol. 1959;37:911–917. doi: 10.1139/o59-099. [DOI] [PubMed] [Google Scholar]
- Buell AK, Galvagnion C, Gaspar R, Sparr E, Vendruscolo M, Knowles TP, Linse S, Dobson CM. Solution conditions determine the relative importance of nucleation and growth processes in α-Synuclein aggregation. Proc Natl Acad Sci USA. 2014;111:7671–7676. doi: 10.1073/pnas.1315346111. [DOI] [PMC free article] [PubMed] [Google Scholar]
- Burré J, Sharma M, Südhof TC. α-Synuclein assembles into higher-order multimers upon membrane binding to promote SNARE complex formation. Proc Natl Acad Sci USA. 2014;111:E4274–E4283. doi: 10.1073/pnas.1416598111. [DOI] [PMC free article] [PubMed] [Google Scholar]
- Cole NB, Murphy DD, Grider T, Rueter S, Brasaemle D, Nussbaum RL. Lipid droplet binding and oligomerization properties of the Parkinson's disease protein alpha-Synuclein. J Biol Chem. 2002;277:6344–6352. doi: 10.1074/jbc.M108414200. [DOI] [PubMed] [Google Scholar]
- Cremades N, Cohen SI, Deas E, Abramov AY, Chen AY, Orte A, Sandal M, Clarke RW, Dunne P, Aprile FA, et al. Direct observation of the interconversion of normal and toxic forms of α-Synuclein. Cell. 2012;149:1048–1059. doi: 10.1016/j.cell.2012.03.037. [DOI] [PMC free article] [PubMed] [Google Scholar]
- Davidson WS, Jonas A, Clayton DF, George JM. Stabilization of alpha-Synuclein secondary structure upon binding to synthetic membranes. J Biol Chem. 1998;273:9443–9449. doi: 10.1074/jbc.273.16.9443. [DOI] [PubMed] [Google Scholar]
- Dettmer U, Newman AJ, Soldner F, Luth ES, Kim NC, von Saucken VE, Sanderson JB, Jaenisch R, Bartels T, Selkoe D. Parkinson-causing α-Synuclein missense mutations shift native tetramers to monomers as a mechanism for disease initiation. Nat Commun. 2015;6:7314. doi: 10.1038/ncomms8314. [DOI] [PMC free article] [PubMed] [Google Scholar]
- Dettmer U, Selkoe D, Bartels T. New insights into cellular α-Synuclein homeostasis in health and disease. Curr Opin Neurobiol. 2016;36:15–22. doi: 10.1016/j.conb.2015.07.007. [DOI] [PubMed] [Google Scholar]
- Duda JE, Giasson BI, Mabon ME, Lee VM, Trojanowski JQ. Novel antibodies to synuclein show abundant striatal pathology in Lewy body diseases. Ann Neurol. 2002;52:205–210. doi: 10.1002/ana.10279. [DOI] [PubMed] [Google Scholar]
- Eisele YS, Monteiro C, Fearns C, Encalada SE, Wiseman RL, Powers ET, Kelly JW. Targeting protein aggregation for the treatment of degenerative diseases. Nat Rev Drug Discov. 2015;14:759–780. doi: 10.1038/nrd4593. [DOI] [PMC free article] [PubMed] [Google Scholar]
- Farfel-Becker T, Vitner EB, Kelly SL, Bame JR, Duan J, Shinder V, Merrill AH, Jr, Dobrenis K, Futerman AH. Neuronal accumulation of glucosylceramide in a mouse model of neuronopathic Gaucher disease leads to neurodegeneration. Hum Mol Genet. 2014;23:843–854. doi: 10.1093/hmg/ddt468. [DOI] [PMC free article] [PubMed] [Google Scholar]
- Gegg ME, Burke D, Heales SJ, Cooper JM, Hardy J, Wood NW, Schapira AH. Glucocerebrosidase deficiency in substantia nigra of parkinson disease brains. Ann Neurol. 2012;72:455–463. doi: 10.1002/ana.23614. [DOI] [PMC free article] [PubMed] [Google Scholar]
- Giasson BI, Murray IV, Trojanowski JQ, Lee VM. A hydro-phobic stretch of 12 amino acid residues in the middle of alpha-Synuclein is essential for filament assembly. J Biol Chem. 2001;276:2380–2386. doi: 10.1074/jbc.M008919200. [DOI] [PubMed] [Google Scholar]
- Glabe CG. Structural classification of toxic amyloid oligomers. J Biol Chem. 2008;283:29639–29643. doi: 10.1074/jbc.R800016200. [DOI] [PMC free article] [PubMed] [Google Scholar]
- Goedert M, Spillantini MG, Del Tredici K, Braak H. 100 years of Lewy pathology. Nat Rev Neurol. 2013;9:13–24. doi: 10.1038/nrneurol.2012.242. [DOI] [PubMed] [Google Scholar]
- Goker-Alpan O, Schiffmann R, LaMarca ME, Nussbaum RL, McInerney-Leo A, Sidransky E. Parkinsonism among Gaucher disease carriers. J Med Genet. 2004;41:937–940. doi: 10.1136/jmg.2004.024455. [DOI] [PMC free article] [PubMed] [Google Scholar]
- Gould N, Mor DE, Lightfoot R, Malkus K, Giasson B, Ischiropoulos H. Evidence of native α-Synuclein conformers in the human brain. J Biol Chem. 2014;289:7929–7934. doi: 10.1074/jbc.C113.538249. [DOI] [PMC free article] [PubMed] [Google Scholar]
- Grabowski GA. Phenotype, diagnosis, and treatment of Gaucher's disease. Lancet. 2008;372:1263–1271. doi: 10.1016/S0140-6736(08)61522-6. [DOI] [PubMed] [Google Scholar]
- Guo JL, Covell DJ, Daniels JP, Iba M, Stieber A, Zhang B, Riddle DM, Kwong LK, Xu Y, Trojanowski JQ, Lee VM. Distinct α-Synuclein strains differentially promote tau inclusions in neurons. Cell. 2013;154:103–117. doi: 10.1016/j.cell.2013.05.057. [DOI] [PMC free article] [PubMed] [Google Scholar]
- Han H, Weinreb PH, Lansbury PT., Jr The core Alzheimer's peptide NAC forms amyloid fibrils which seed and are seeded by beta-amyloid: is NAC a common trigger or target in neurodegenerative disease? Chem Biol. 1995;2:163–169. doi: 10.1016/1074-5521(95)90071-3. [DOI] [PubMed] [Google Scholar]
- Hedrich K, Hagenah J, Djarmati A, Hiller A, Lohnau T, Lasek K, Grünewald A, Hilker R, Steinlechner S, Boston H, et al. Clinical spectrum of homozygous and heterozygous PINK1 mutations in a large German family with Parkinson disease: role of a single hit? Arch Neurol. 2006;63:833–838. doi: 10.1001/archneur.63.6.833. [DOI] [PubMed] [Google Scholar]
- Kayed R, Head E, Thompson JL, McIntire TM, Milton SC, Cotman CW, Glabe CG. Common structure of soluble amyloid oligomers implies common mechanism of pathogenesis. Science. 2003;300:486–489. doi: 10.1126/science.1079469. [DOI] [PubMed] [Google Scholar]
- Kriks S, Shim JW, Piao J, Ganat YM, Wakeman DR, Xie Z, Carrillo-Reid L, Auyeung G, Antonacci C, Buch A, et al. Dopamine neurons derived from human ES cells efficiently engraft in animal models of Parkinson's disease. Nature. 2011;480:547–551. doi: 10.1038/nature10648. [DOI] [PMC free article] [PubMed] [Google Scholar]
- Lansbury PT., Jr Structural neurology: are seeds at the root of neuronal degeneration? Neuron. 1997;19:1151–1154. doi: 10.1016/s0896-6273(00)80406-7. [DOI] [PubMed] [Google Scholar]
- Lee RE. The fine structure of the cerebroside occurring in Gaucher's disease. Proc Natl Acad Sci USA. 1968;61:484–489. doi: 10.1073/pnas.61.2.484. [DOI] [PMC free article] [PubMed] [Google Scholar]
- Liu C, Zhao M, Jiang L, Cheng PN, Park J, Sawaya MR, Pensalfini A, Gou D, Berk AJ, Glabe CG, et al. Out-of-register β-sheets suggest a pathway to toxic amyloid aggregates. Proc Natl Acad Sci USA. 2012;109:20913–20918. doi: 10.1073/pnas.1218792109. [DOI] [PMC free article] [PubMed] [Google Scholar]
- Luth ES, Bartels T, Dettmer U, Kim NC, Selkoe DJ. Purification of α-Synuclein from human brain reveals an instability of endogenous multimers as the protein approaches purity. Biochemistry. 2015;54:279–292. doi: 10.1021/bi501188a. [DOI] [PMC free article] [PubMed] [Google Scholar]
- Mazzulli JR, Mishizen AJ, Giasson BI, Lynch DR, Thomas SA, Nakashima A, Nagatsu T, Ota A, Ischiropoulos H. Cytosolic catechols inhibit alpha-Synuclein aggregation and facilitate the formation of intracellular soluble oligomeric intermediates. J Neurosci. 2006;26:10068–10078. doi: 10.1523/JNEUROSCI.0896-06.2006. [DOI] [PMC free article] [PubMed] [Google Scholar]
- Mazzulli JR, Armakola M, Dumoulin M, Parastatidis I, Ischiropoulos H. Cellular oligomerization of alpha-Synuclein is determined by the interaction of oxidized catechols with a C-terminal sequence. J Biol Chem. 2007;282:31621–31630. doi: 10.1074/jbc.M704737200. [DOI] [PubMed] [Google Scholar]
- Mazzulli JR, Xu YH, Sun Y, Knight AL, McLean PJ, Caldwell GA, Sidransky E, Grabowski GA, Krainc D. Gaucher disease glucocerebrosidase and α-Synuclein form a bidirectional pathogenic loop in synucleinopathies. Cell. 2011;146:37–52. doi: 10.1016/j.cell.2011.06.001. [DOI] [PMC free article] [PubMed] [Google Scholar]
- Mazzulli JR, Zunke F, Isacson O, Studer L, Krainc D. α-Synuclein-induced lysosomal dysfunction occurs through disruptions in protein trafficking in human midbrain synucleinopathy models. Proc Natl Acad Sci USA. 2016a;113:1931–1936. doi: 10.1073/pnas.1520335113. [DOI] [PMC free article] [PubMed] [Google Scholar]
- Mazzulli JR, Zunke F, Tsunemi T, Toker NJ, Jeon S, Burbulla LF, Patnaik S, Sidransky E, Marugan JJ, Sue CM, Krainc D. Activation of β-glucocerebrosidase reduces pathological α-Synuclein and restores lysosomal function in Parkinson's patient midbrain neurons. J Neurosci. 2016b;36:7693–7706. doi: 10.1523/JNEUROSCI.0628-16.2016. [DOI] [PMC free article] [PubMed] [Google Scholar]
- McEachern KA, Fung J, Komarnitsky S, Siegel CS, Chuang WL, Hutto E, Shayman JA, Grabowski GA, Aerts JM, Cheng SH, et al. A specific and potent inhibitor of glucosylceramide synthase for substrate inhibition therapy of Gaucher disease. Mol Genet Metab. 2007;91:259–267. doi: 10.1016/j.ymgme.2007.04.001. [DOI] [PubMed] [Google Scholar]
- Murphy KE, Gysbers AM, Abbott SK, Tayebi N, Kim WS, Sidransky E, Cooper A, Garner B, Halliday GM. Reduced glucocerebrosidase is associated with increased α-Synuclein in sporadic Parkinson's disease. Brain. 2014;137:834–848. doi: 10.1093/brain/awt367. [DOI] [PMC free article] [PubMed] [Google Scholar]
- Neudorfer O, Giladi N, Elstein D, Abrahamov A, Turezkite T, Aghai E, Reches A, Bembi B, Zimran A. Occurrence of Parkinson's syndrome in type I Gaucher disease. QJM. 1996;89:691–694. doi: 10.1093/qjmed/89.9.691. [DOI] [PubMed] [Google Scholar]
- Ran FA, Hsu PD, Lin CY, Gootenberg JS, Konermann S, Trevino AE, Scott DA, Inoue A, Matoba S, Zhang Y, Zhang F. Double nicking by RNA-guided CRISPR Cas9 for enhanced genome editing specificity. Cell. 2013;154:1380–1389. doi: 10.1016/j.cell.2013.08.021. [DOI] [PMC free article] [PubMed] [Google Scholar]
- Roberts RF, Wade-Martins R, Alegre-Abarrategui J. Direct visualization of alpha-Synuclein oligomers reveals previously undetected pathology in Parkinson's disease brain. Brain. 2015;138:1642–1657. doi: 10.1093/brain/awv040. [DOI] [PMC free article] [PubMed] [Google Scholar]
- Rocha EM, Smith GA, Park E, Cao H, Brown E, Hallett P, Isacson O. Progressive decline of glucocerebrosidase in aging and Parkinson's disease. Ann Clin Transl Neurol. 2015;2:433–438. doi: 10.1002/acn3.177. [DOI] [PMC free article] [PubMed] [Google Scholar]
- Schöndorf DC, Aureli M, McAllister FE, Hindley CJ, Mayer F, Schmid B, Sardi SP, Valsecchi M, Hoffmann S, Schwarz LK, et al. iPSC-derived neurons from GBA1-associated Parkinson's disease patients show autophagic defects and impaired calcium homeostasis. Nat Commun. 2014;5:4028. doi: 10.1038/ncomms5028. [DOI] [PubMed] [Google Scholar]
- Sidransky E, Nalls MA, Aasly JO, Aharon-Peretz J, Annesi G, Barbosa ER, Bar-Shira A, Berg D, Bras J, Brice A, et al. Multicenter analysis of glucocerebrosidase mutations in Parkinson's disease. N Engl J Med. 2009;361:1651–1661. doi: 10.1056/NEJMoa0901281. [DOI] [PMC free article] [PubMed] [Google Scholar]
- Siebert M, Sidransky E, Westbroek W. Glucocerebrosidase is shaking up the synucleinopathies. Brain. 2014;137:1304–1322. doi: 10.1093/brain/awu002. [DOI] [PMC free article] [PubMed] [Google Scholar]
- Stroud JC, Liu C, Teng PK, Eisenberg D. Toxic fibrillar oligomers of amyloid-β have cross-β structure. Proc Natl Acad Sci USA. 2012;109:7717–7722. doi: 10.1073/pnas.1203193109. [DOI] [PMC free article] [PubMed] [Google Scholar]
- Takahashi K, Naito M. Lipid storage disease: Part II. Ultrastructural pathology of lipid storage cells in sphingolipidoses. Acta Pathol Jpn. 1985;35:385–408. [PubMed] [Google Scholar]
- Tsika E, Moysidou M, Guo J, Cushman M, Gannon P, Sandaltzopoulos R, Giasson BI, Krainc D, Ischiropoulos H, Mazzulli JR. Distinct region-specific alpha-Synuclein oligomers in A53T transgenic mice: implications for neurodegeneration. J Neurosci. 2010;30:3409–3418. doi: 10.1523/JNEUROSCI.4977-09.2010. [DOI] [PMC free article] [PubMed] [Google Scholar]
- Wang W, Perovic I, Chittuluru J, Kaganovich A, Nguyen LT, Liao J, Auclair JR, Johnson D, Landeru A, Simorellis AK, et al. A soluble α-Synuclein construct forms a dynamic tetramer. Proc Natl Acad Sci USA. 2011;108:17797–17802. doi: 10.1073/pnas.1113260108. [DOI] [PMC free article] [PubMed] [Google Scholar]
- Wang L, Das U, Scott DA, Tang Y, McLean PJ, Roy S. α-Synuclein multimers cluster synaptic vesicles and attenuate recycling. Curr Biol. 2014;24:2319–2326. doi: 10.1016/j.cub.2014.08.027. [DOI] [PMC free article] [PubMed] [Google Scholar]
- Waxman EA, Duda JE, Giasson BI. Characterization of antibodies that selectively detect alpha-Synuclein in pathological inclusions. Acta Neuropathol. 2008;116:37–46. doi: 10.1007/s00401-008-0375-1. [DOI] [PMC free article] [PubMed] [Google Scholar]
- Weinreb PH, Zhen W, Poon AW, Conway KA, Lansbury PT., Jr NACP, a protein implicated in Alzheimer's disease and learning, is natively unfolded. Biochemistry. 1996;35:13709–13715. doi: 10.1021/bi961799n. [DOI] [PubMed] [Google Scholar]
- Willemsen R, Tybulewicz V, Sidransky E, Eliason WK, Martin BM, LaMarca ME, Reuser AJ, Tremblay M, Westphal H, Mulligan RC, et al. A biochemical and ultrastructural evaluation of the type 2 Gaucher mouse. Mol Chem Neuropathol. 1995;24:179–192. doi: 10.1007/BF02962142. [DOI] [PubMed] [Google Scholar]
- Wong K, Sidransky E, Verma A, Mixon T, Sandberg GD, Wakefield LK, Morrison A, Lwin A, Colegial C, Allman JM, Schiffmann R. Neuropathology provides clues to the pathophysiology of Gaucher disease. Mol Genet Metab. 2004;82:192–207. doi: 10.1016/j.ymgme.2004.04.011. [DOI] [PubMed] [Google Scholar]
- Wood SJ, Wypych J, Steavenson S, Louis JC, Citron M, Biere AL. alpha-Synuclein fibrillogenesis is nucleation-dependent Implications for the pathogenesis of Parkinson's disease. J Biol Chem. 1999;274:19509–19512. doi: 10.1074/jbc.274.28.19509. [DOI] [PubMed] [Google Scholar]
- Yap TL, Velayati A, Sidransky E, Lee JC. Membrane-bound α-Synuclein interacts with glucocerebrosidase and inhibits enzyme activity. Mol Genet Metab. 2013;108:56–64. doi: 10.1016/j.ymgme.2012.11.010. [DOI] [PMC free article] [PubMed] [Google Scholar]
Associated Data
This section collects any data citations, data availability statements, or supplementary materials included in this article.