

Abstract
Mitochondria are dynamic organelles that adapt in response to environmental stresses or mutations. Dynamic processes involving mitochondria include their locomotion within cells and fusion and fission events in which mitochondrial join together or split apart. Various imaging strategies have been utilized to track mitochondrial dynamics. One common limitation of most of the methods available is that the time required to perform the technique and analyze the results prohibits application to clinical diagnosis and therapy. We recently demonstrated “whole-cell” mitochondrial analysis in a two-dimensional fashion with fluorescence microscopy. Our developed technique allows evaluation of whole-cell mitochondrial networking, including assessment of mitochondrial motility and rates of fission and fusion events using human blood cells (peripheral mononuclear blood cells (PBMCs)) on a clinically relevant timescale. We demonstrate this methodology in a cohort of healthy subjects as well as a cohort of hospitalized subjects having sepsis, an acute care illness. As there is increasing use of human blood cells as a proxy of organ mitochondrial function with respiration in various disease states, the addition of mitochondrial dynamics will now allow for more thorough clinical evaluation of mitochondrial networking in human disease with potential exploration of therapeutics.
Keywords: mitochondria, motility, sepsis, microscopy
Introduction
The mitochondria play a central role in cellular metabolism where oxygen consumption through the electron transport system (ETS) is tightly coupled to ATP production and regulated by metabolic demands.1–4 Mitochondrial respiration influences key processes such as oxidative phosphorylation, ion gradients, membrane potential, reactive oxygen species (ROS) generation and heat dissipation.5 The measurement of mitochondrial respirometry reflects a dynamic state that contrasts with static measures of mitochondrial function such as enzyme levels and metabolites. Failure of mitochondria in normal cells to use oxygen to sustain ATP production results in an energy deficit that can impair cell function best measured with high-resolution respirometry (HRR).6
Mitochondria are also dynamic organelles that adapt in response to environmental stresses or mutations.7,8 Dynamic processes include mitochondrial locomotion within the cell along with fusion and fission events. The mobile mitochondria move independently of each other and can move in different directions. Directed long-range locomotion occurs both away from the nucleus (anterograde) and towards the center of the cell and nucleus (retrograde).9 In addition to movement, the mitochondria also undergo fission and fusion. Fission (in which mitochondria divide) is essential for growing and dividing cells, as it populates them with adequate numbers of mitochondria. Fission can also occur when there is significant mitochondrial damage that will allow the cell to segregate the damaged portion. Fusion (in which mitochondria merge) is also critical as it can eliminate defects in mitochondria by allowing them to cross-complete one another. Fusion can therefore maximize oxidative capacity in response to toxic stress.10,11
There is increasing interest in the use of human blood cells such as peripheral blood mononuclear cells (PBMCs), which contains a mixed population of monocytes and lymphocytes, as surrogate markers of mitochondrial function in organs in a wide variety of clinical disease ranging from diabetes and heart disease to acute care illness where our own work has explored the measurement of mitochondrial respiration in PBMCs obtained from subjects with acute care illnesses.12–14 One of the limitations of measuring mitochondrial function in human blood cells in patients is the inability to evaluate mitochondrial networking in a simultaneous fashion with respiration and in a clinically meaningful time frame.
Several distinct imaging strategies have been utilized to track mitochondrial movement. For instance, kymographs have been plotted to track one-dimensional movement but this methodology has limited value for clinical applications due to lack of any automation.15 In a fluorescence microscopy approach, pre-processed time-lapsed images have been used to automatically tracked mitochondrial motion in limited sections of cells.16 We advanced this approach by demonstrating “whole-cell” mitochondrial analysis, tracking all mitochondria present in the fluorescence microscopy focal plane.17,18 Our technique enables the evaluation of whole-cell mitochondrial networking that includes measurement of motility as well as rates of fission and fusion events in PBMCs.
The techniques indicated above have been demonstrated using cultured cells and mitochondrial tracker dyes that require 1-2 days of preparation before any image acquisition is performed. Since human blood cells only remain viable ex vivo for a limited time, we seek to develop a technique combining cell handling and imaging that will enable tracking mitochondrial networking for clinical applications in the timeframe of cell viability as defined within 2-4 hours of sample processing. Our goal is to build upon our established work to advance the measurement of whole-cell mitochondrial networking in human blood cells in a clinically relevant fashion that may used in time-sensitive critical care illnesses. This current work would allow for simultaneous measurement of mitochondrial dynamics and respiration using a single patient sample and would provide additional information regarding the connection between the function and structure of human blood cell mitochondria allowing use for prognostic measurements, gauge severity of disease and pathway for therapeutic applications.
Materials and Methods
Study design
The University of Pennsylvania Institutional Review Board (Protocol number 822749) approved this study and informed consent was obtained from the patient or an appropriate surrogate. Samples were obtained from healthy controls and subjects with sepsis to illustrate our new methodology. Patients were eligible for enrollment upon arrival to the emergency department and within one hour of presentation: (1) had 2 of 4 of the systemic inflammatory response syndrome (SIRS) criteria as defined by the ACCP/SCCM Consensus Conference Committee, (2) a suspected or known source of infection, (3) lactate greater than 2.0 mg/dL, (4) had not yet received intravenous fluids or antibiotics.19,20 Sequential organ failure assessment score (SOFA score) was also calculated. Exclusion criteria for both groups include known malignancy, pregnancy, cognitive impairment or psychosis by chart review and/or clinical assessment.
Human blood cell preparation
All eligible subjects underwent phlebotomy as part of standard care. Samples were taken from the collection tubing at the same time as a planned blood phlebotomy. Figure 1 illustrates the cell isolation process for data acquisition. A volume of 15 ml was drawn in K2EDTA tubes to prohibit platelet activation. The following protocol was carried out to obtain a population of peripheral blood mononuclear cells (PBMCs): 15 mL of Ficoll-PaqueTM PLUS was placed into a 50 mL Leucosep tubes (Greiner Bio-one) which was centrifuged at 1000g for 1 min at room temperature (RT). During this process 15 ml of the patient’s blood was added to a 50 ml Falcon tube followed by an addition of 15 ml of DPBS for a total of 30 ml in a 1:1 mixture. The 50 ml Falcon tube was gently inverted. Once the Leucosep centrifugation was completed, the 30ml of blood was carefully pipetted and layered above the disc within the Leucosep tube. The Leucosep tube was centrifuged at 1000g for 10 minutes at RT after which approximately 4ml of the buffy coat containing PBMCs was collected. This buffy coat sample was placed in a 15 ml tube followed by the addition of 4 ml of DPBS for a 1:1 mixture that was then centrifuged at 1000g for 7 minutes. The supernatant was discarded and the PBMC pellet was gently re-suspended in MiR05 medium for high-resolution respirometry. A cell count with trypan blue was performed with the Cell Countess II (Invitrogen) and cell viability was also assessed.13 While bioenergetics studies have used platelets to study cellular respiration, they are cell fragments with varying amounts of mitochondria. Herein we focus on the use of PBMCs, since platelets are too small to obtain adequate imaging for the desired analysis.
Figure 1.

Flowchart of peripheral blood mononuclear cells (PBMCs) isolation for data acquisition to obtain mitochondrial dynamics (and respiration). Time from isolation to processed data can be obtained in less than 3-4 hours.
Fluorescence microscopy
For experiments involving measuring mitochondrial number, net movement and rates of fusion/fission events, cells were plated on a 24-well 15-mm glass-bottom dishes (CellVis, Mountain View, CA) at a density of ~10,000 PBMCs/well. Dishes were coated for 30 minutes with 45 ul Cell-Tak (Corning) dissolved in PBS prior to cell plating. After PBMCs were added to each well, the plate was centrifuged at 200g for 1 minute followed by microscopy for confirmation of adherence. 100 nM MitoTracker Green FM (ThermoFisher Scientific) was incubated with the PBMC for 30 minutes at 37°C in a standard cell incubator. Each well was rinsed with recording buffer x3 with a final volume of 2 mL for microscopy. Figure 2 shows a well with PBMCs (lymphocytes) stained with Wright’s stain after adherence with Cell-Tak.
Figure 2.

PBMCs (lymphocytes) placed on a well with CellTak and viewed with brightfield microscopy.
Additionally we also performed the same experiments using fibroblasts plated with Cell-Tak as well as cultured cells to evaluate the effects of Cell-Tak on mitochondrial motility. Adult human dermal fibroblasts between passages 1 and 5 (Lifeline Cell Technology, Walkersville, Md) were cultured in FibroLife cell culture media (Lifeline Cell Technology). All cells were incubated at 37 °C in a humidified atmosphere with 5% CO2. Cells were grown to confluency and were split into two conditions where one group was harvested by trypsinization and plated to wells using Cell-Tak as described for PBMCs. The second group was left cultured on wells and stained with Mitotracker Green FM as described for PBMCs and imaged. This approach allowed for effective comparison of cells treated with Cell-Tak with cultured cells as a quality check for the use of Cell-Tak on PBMCs.
We also used Mdivi-1(Sigma) at a concentration of 50 uM when measuring rates of both fusion and fission events in PBMCs obtained from control subjects. Mdivi-1 is a small molecule and inhibitor of the mitochondrial fission protein Drp-1. Mdivi-1 is a known inhibitor of mitochondrial fission and has been used in various injury models to prevent mitochondrial fragmentation. The use of Mdivi-1 in this study will allow us to evaluate our method to measure fission and fusion events using a known inhibitor of fission as a positive control.21,22
Fluorescence microscopy was performed similarly to our previous methods. Cells were imaged using an Olympus IX-51 with a Hamamatsu ORCA camera (2048 × 2048 pixels) with an LED light source from Lumencor; images were collected on Metamorph 10.7.8.9 software. For each experiment, cells were visualized using a standard FITC filter, and isolated cells with well-resolved mitochondria were selected. Cells were imaged for 5-10 minutes every 1.5 or 3 seconds, eventually to be sampled every 3 seconds for a total of 5 minutes.17
Image pre-processing and image analysis
We preprocessed raw image files in ImageJ using an approach previously presented.17,18 Briefly, time-lapse images were first convolved using the 5×5 edge-detection filter given in. Next, images were converted to the frequency domain using a Fast Fourier Transform (FFT) in ImageJ, and subjected to a bandpass filter ranging from 2 pixels (~0.3 μm with our resolution) to 100 pixels (~16 μm). Finally, the resulting images were thresholded by eye to best eliminate noise, with the results saved as a sequence of individual binary images. Figure 3 shows the evolution of a single frame through the ImageJ processing steps for a cluster of PBMCs present in the microscopy field of view. Figure 4 illustrates processing with our custom MatLab program in a PBMC from a control patient contrasted with a PBMC obtained from a subject with sepsis. Stacks of images were analyzed by a custom MatLab script designed to track the movement of individual mitochondria and also rates of fission and fusion events.
Figure 3.
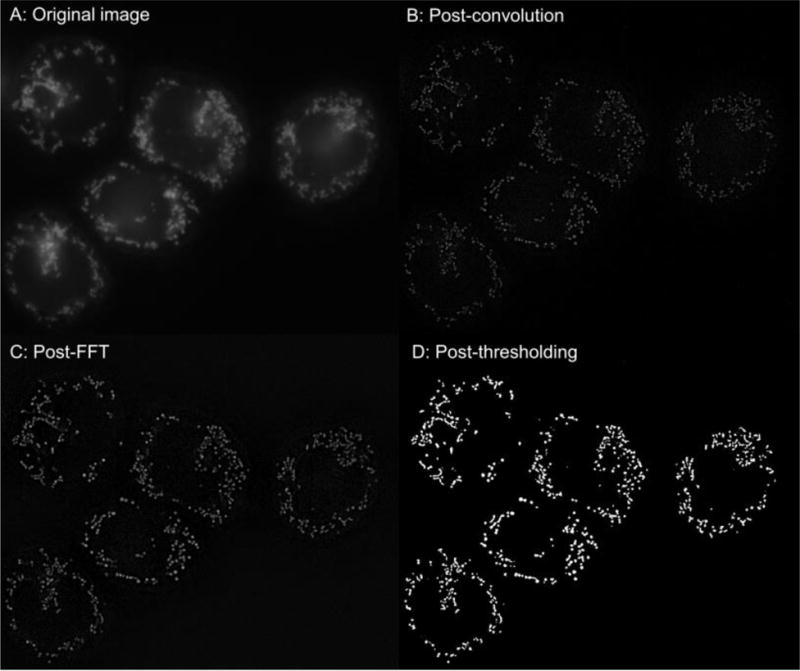
Image processing (ImageJ) of a sample image with a group of PBMCs obtained from a healthy subject.
A: Orignal image.
B: Post convolution
C: Post FFT
D: Final image after thresholding
Figure 4.

Image processing (Matlab) of a sample cell image of a PBMC obtained from a subject with sepsis (A) compared to a healthy control subject (B) after ImageJ processing as seen in Figure 3. On the left-hand side, an increase in the number (blue to red) indicates a greater degree of net movement for each mitochondrion. On the right-hand side, the corresponding individual mitochondrial tracks taken for each mitochondrion are displayed.
The MatLab processing is done via a user-friendly interface with inputs such file names, image speed, image resolution, and desired lifetime minimum, and is usually completed in a few minutes. Our current algorithm reads the current frame into MatLab, and the built-in function bwconncomp is used to find the connected white objects in the image. The scripts and instructions of our algorithm are included online on Github (www.github.com/kandelj/MitoSPT), a freely available software sharing repository, and are intended for public use with proper citation. Our previous publication discusses tracking of net movement, but we also report measuring rates of fusion and fissions events as follows: (1) Fusion events: An object from frame n+1 overlaps with multiple objects from frame n. We assume a fusion event has occurred, and we permanently retire the labels of the corresponding objects in frame n. The fused object in frame n+1 gets a new, unique label.17 (2) Fission events: We infer that a fission event has occurred by the appearance of new objects in frame n+1 that overlap with an object from frame n. As in the case of fusion, we introduce a new label for this object and retire the old label. The retiring of old labels in both fission and fusion events is a programming convention to track objects over time, since when either fusion or fission occur, the object(s) tracked in frame n no longer exist in frame n+1.
Statistical analysis
For computing the coefficient of determination (R2) of the probability plots, a probability plot was first made by applying the MatLab normplot function to the log values of the net distances traveled by mitochondria in a given cell or cells. X and y values were extracted from the plot, with each data point represented as (xi,yi). The backslash operator was used in MatLab to fit a line to this data, giving expected y values (fi) based on this model. The total sum of squares (SStot) was calculated as: (2) The residual sum of squares (SSresid) was calculated as: (3) R2 was calculated as: The MatLab function normfit gave the mean and standard deviation of the normal distribution best fitting the distribution of logs of net distances. P-values comparing log distributions were computed using two-sample Kolmogorov-Smirnov tests (K-S test; kstest2 function in MatLab). This statistical method tests the null hypothesis that two sets of data are taken from the same continuous distribution. We also used unpaired t-tests to compare differences in net distance and fusion/fission events (GraphPad Prism 7).
Results
A total of 6 subjects matched for gender were enrolled in this study, 3 healthy controls and 3 patients with sepsis to demonstrate our method. The median age (range) in the Control Group and Sepsis Group was 39 (31-45) and 48 (42-57) years old (2 female and 1 male subjects/group), respectively. In the Sepsis Group, the median 1st 24-hour SOFA score was 8, and the initial median serum lactate level was 3.5 mmol/dL, compared to 1.1 mmol/L for the Control Group. Of note there was no significant difference in cell types between the two groups when we examined their complete blood count with differential.
We applied our new methods of PBMC preparation for microscopy and rates of fission/fusion in addition to previously described method of tracking net movement in PBMCs obtained from healthy control subjects. We performed log-transformation on the net distances traveled by the mitochondria in PBMCs and similar to our prior work in other cell lines, the data appear to follow a continuous lognormal distribution. Figure 5 shows a histogram of log values of the net distances traveled by all mitochondria in a given PBMC over the 5 minutes recorded. This was performed in a sample of 4-6 PBMCs per subject. A normal distribution with a mean of −1.14 (= 168 nm) and standard deviation of 1.1 is overlaid onto the log-transformed histogram. Based on our data, we found that in control subjects, the majority of mitochondria traveled small net distances. Similar to our prior work, the calculated R2 is 0.997, also demonstrating an excellent fit. In general, after converting net distances to the log scale, the R2 values usually exceeded 0.98 for individual cells and groups of cells. We therefore conclude that net distances exhibited by the mitochondria follow a lognormal distribution and can also be quantified on the whole-cell level.
Figure 5.

Net distances traveled by mitochondria are lognormally distributed. This is a sample of 4-6 cells from a single healthy subject. The mean net distance movement was 168 nm.
To illustrate the translational aspect of our methods we obtained PBMCs from subjects with sepsis to contrast alterations in mitochondrial net movement with controls subjects. The geometric mean of the mitochondrial net distances traveled in PBMCs obtained from subjects with sepsis was 388±22.4 nm when compare to 179±14.6 nm of all mitochondrial in controls (P < 0.0001). Figure 6 compared the logs of the net distances between the PMBCs between the Control and Sepsis Groups. The mitochondria in PBMCs obtained from the Sepsis Group exhibited higher net movement when compared to the Control Group.
Figure 6. Control Group and Sepsis Group.
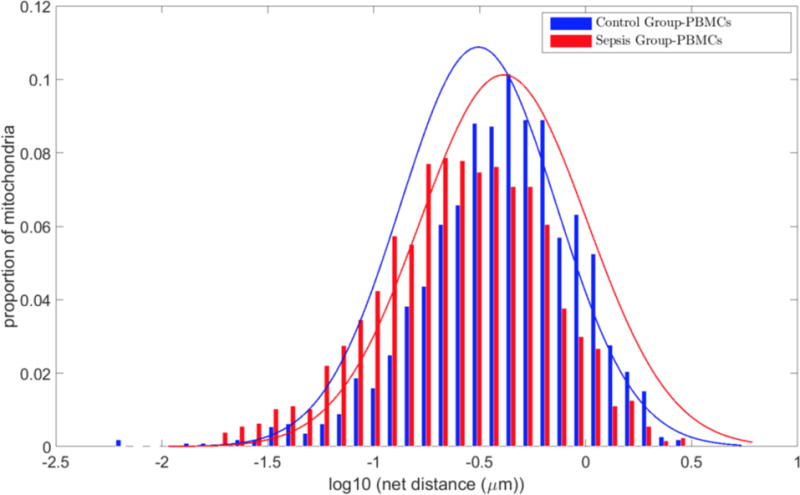
Grouped histograms of net distances traveled by mitochondria in the Control Group compared to the Sepsis Group. Mitochondria are pooled together from 15-17 cells from three subjects per group. Histograms are normalized to reflect percentages of objects rather than absolute numbers. There is an overall increase in net movement in the Sepsis Group. The mean net distance traveled in the Control Group was 179±14.6 nm when compared to 388±22.4 nm in the Sepsis Group (P < 0.0001). Values presented as mean ± SEM.
We also evaluated the effect Cell-Tak may have on measuring mitochondrial dynamics by using human dermal fibroblast. We compared Cell-Tak adherence with standard cell culture techniques using our imaging technique on fibroblast cells. The geometric mean of the mitochondrial net distances traveled in fibroblasts with Cell-Tak (176±11.2 nm) was statistically similar to cultured fibroblasts (161±11.2 nm, P>0.05). There was also no significant difference in the number of mitochondria with Cell-Tak (8,605±134) and in culture cells (7,900±111, P> 0.05) or in the rates of mitochondrial fission/fusion events.
As an extension of our prior work we also measured rates of fusion and fission events in addition to net movement. The percentages of mitochondria that undergo fission and fusion for the Control and Sepsis Groups are displayed in Figure 7. Fission and fusion rates calculated for each PBMC in both conditions Mitochondrial fission and fusion rates of PBMCs obtained from the Control Group and the Sepsis Group. The Control Group fission rates (30.4±2.7%) and fusion rates (30.9±2.6%) were statistically similar. The Sepsis Group fission rates (23.7±3.9) and fusion rates (24.3±3.9%) were also statistically similar. While the rates for both events were lower in the Sepsis Group it was not statistically significant when compared to the Control Group.
Figure 7. Fission and Fusion Events.

Mitochondrial fission and fusion rates of PBMCs obtained from the Control Group and the Sepsis Group. The Control Group fission rates (30.4±2.7%) and fusion rates (30.9±2.6%) were statistically similar. The Sepsis Group fission rates (23.7±3.9) and fusion rates (24.3±3.9%) were also statisitically similar. Values presented as mean percentage ± SEM.
Finally we used a known inhibitor of mitochondrial fission, Mdivi-1, to test our ability to measure rates of fusion and fission in PBMCs obtained from healthy subjects. The percentages of mitochondria that undergo fission and fusion for the Mdivi and Control Groups are displayed in Figure 8. Fission and fusion rates were calculated for PBMCs in both conditions. Overall, fusion rates were statistically similar between the Control Group (25.6±6.3%) and Mdivi Group (23.7±3.8%). The rates for fission events for the Mdivi Group (12±3%) were statistically lower than those measured for the Control Group (24±4.1%) with P < 0.05.
Figure 8. Fission and Fusion Events with Mdivi-1.
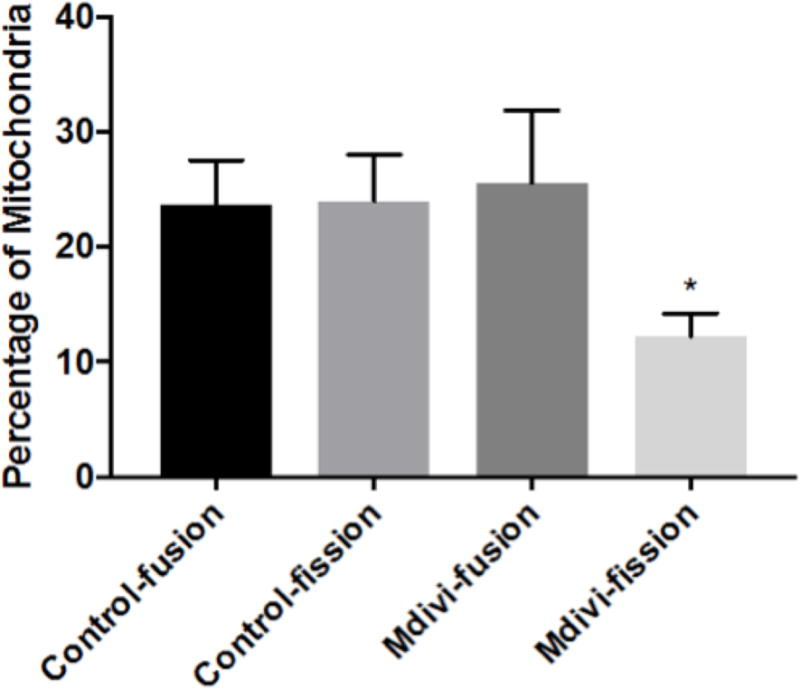
Mitochondrial fission and fusion rates of PBMCs obtained from healthy subjects comparing the use Mdivi-1 (50 uM) to inhibit mitochondrial fission compared to control (DMSO). Overall, fusion rates were statistically similar between the Control Group (25.6±6.3%) and Mdivi Group (23.7±3.8%). The rates for fission events for the Mdivi Group (12±3%) were statistically lower than those measured for the Control Group (24±4.1%) with P < 0.05. Values presented as mean percentage ± SEM.
Discussion
We have advanced our previous work in which we published whole cell mitochondrial tracking based on fluorescence live imaging.17,18 We have expanded our method to now track mitochondria networking in whole cells using PBMCs freshly obtained from subjects and easily compare networking between PBMCs obtained from healthy subjects and PBMCs obtained from subjects with sepsis, an acute care illness. We have demonstrated that the methodology is accessible within a clinically meaningful time frame, thus illustrating the translational strength of our method.
In line with our previous work related to tracking mitochondrial net movement, whole-cell mitochondrial movement follows a lognormal distribution. Prior work in this area often attributed mitochondrial movement to small-scale Brownian motion or limited directed motion.23 In our previous work we demonstrated that mitochondrial motility follows a continuous distribution in a lognormal fashion in select cell lines.17 We also demonstrate this type of motion in human blood cells, namely PBMCs consisting of a mixed population of monocytes and lymphocytes. We use the geometric mean of the data rather than the arithmetic mean as it enables the determination of a whole-cell index of motility which reflects true biological parameters which better allows comparison of a variety of experimental conditions.
One of the advantages of this novel technique is the ability to obtain mitochondrial networking information in human blood cells in a clinically meaningful time frame, making it potentially useful in a wide range of clinical diseases. Similar to our work in measuring mitochondrial bioenergetic function in freshly obtained human blood cells, the time of blood draw to processed information is 2-3 hours. This is a time frame with the potential to have impact in the area of diagnostics, prognostics and response to treatment. While there are works measuring mitochondria networking in various cell lines, the primary limitation in the application in human blood cells is that they must be utilized in a timely fashion (4-6 hours) as their viability and function decreases significantly after this time period. One of the strengths of our method is the easy application of a cell adhesive with gentle centrifugation followed by mitochondrial staining combined with our developed data processing with ImageJ and MatLab to yield valuable insight into the mitochondrial networking of human blood cells. We also evaluated for possible interactions of Cell-Tak on measuring motility in PBMCs as they are suspended cells as opposed to adherent. We used an adherent cell line, fibroblasts, to see if the use of Cell-Tak resulted in any differences in motility when compared to normal cell culture conditions which it did not.
Human blood cells have been increasingly used to monitor the bioenergetic function and potential mitochondrial dysfunction that occur in a variety of illness and metabolic disorders such as diabetes and acute care illnesses such as poisoning and sepsis.12–14,24,25 The use of circulating blood cells as a proxy of organ mitochondrial function is currently an area of active research and is advantageous for many reasons.26 One advantage of using human blood cells as a proxy of organ/tissue function is that they can be obtained in non-invasive manner when compared to tissue biopsies with minimal processing.27,28 Another advantage of using blood cells is that it allows for serial measurements to gauge severity of the disease state and response to treatment. While we have applied these advantages to measuring bioenergetic function, no previous work has described studying mitochondrial networking in human blood cells, which our method now enables. This will allow other researchers to study the link between mitochondrial bioenergetic function and networking in a wide variety of disease states. An equally important potential application for tracking mitochondrial motility in conjunction with respiration is to also monitor response to treatment as well as development of mitochondrial directed therapy. As further work is carried out in this area, the changes in mitochondrial dynamics in response to both disease and treatment will better inform investigators with prognosis and gauging severity of illness.
In this study we demonstrate our method to compare changes in mitochondrial net movement in PBMCs obtain from a small cohort of healthy subjects when compared to subjects with sepsis. As seen in Figure 3, there is an overall increase in net movement in the mitochondria of PBMCs. While we used a small cohort, the increased net movement in the mitochondria of the Sepsis Group may be related to the increased activity of immune cells in sepsis. It is known that in the acute phases of sepsis, immune cells such as PBMCs often exhibit alterations in cellular respiration presumable due to increased demand and metabolic activity that can occur in infection. Various studies have shown changes in respiration in both early phase and late phase sepsis where immune cells become more aneregic.29–31 In our small sample size, it is clear that there is an increase in mitochondrial net movement when compared to the Control Group. Others have demonstrated that in other cell lines such as neurons, the mitochondria localize to specific areas of the cell.32 The PBMCs obtained from our patients may exhibit increased metabolic demand to respond to infection and hence demonstrate an increase in mitochondrial movement to seek substrate or deliver bioenergetic product within the cell.
In addition to investigating net movement we also examined the rates of fission and fusion events in PMBCs from both groups as seen in Figure 7. The process of mitochondrial fusion allows cross complementation of damaged mitochondria to maximize oxidative function in the presence of stress.33 Mitochondrial fission typically occurs in dividing cells to ensure an adequate amount of mitochondria in each cell. Fission can also occur in the setting of mitochondrial stress in order to segregate damaged mitochondrial with severe defects with eventual mitophagy in some cases. Common mitochondrial stresses include increased ROS production, injury or inhibition to complex units or decrease in oxygen utilization/delivery which can occur in sepsis. While not statistically significant, there appears to be equilibrium of fusion and fission where the PBMCs from the sepsis group did exhibit a trend toward overall less fusion and fission events when compared to the control group which may be related to increased net movement as we have observed. A greater number of samples may show a significant difference between groups. Also as a further test of our ability to measure accurately rates of fusion and fission events, we used Mdivi-1, a known inhibitor of mitochondrial fission. Mdivi-1 has been used in a variety of models including neurodegenerative disease and cancer to study its effects on prevention of mitochondrial fission or fragmentation. Figure 8 shows the use of Mdivi-1 on PBMCs obtained from healthy subjects. We observed a significant decrease in fission when compared to control (DMSO). This application could be explored in future studies of acute care illnesses in which increased mitochondrial fission or fragmentation may serve as a marker of injury for which Mdivi-1 may have therapeutic utility.21,22
There are some limitations to consider when measuring mitochondrial networking in human blood cells. One of the limitations we found when measuring networking in circulating blood cells is that we were not able to apply this technique in platelets due to a size limitation (~2 um) and magnification power with microscopy using 100×. One of the attractive properties of platelets (cell fragments) is that they are rich in mitochondria and have been studied as a proxy for tissue mitochondrial function. Another limitation to consider is the inability to capture mitochondrial movement in the z-plane which may be addressed with the use of confocal microscopy as well as a modification in our current MatLab program to address this. A third limitation is the possibility of cell movement with mitochondrial movement as PBMCs are mobile cells. While the use of an adhesive such as Cell-Tak limits cell movement making this less of an issue, we were careful to discard any time-lapse images with significant cell movement. We found Cell-Tak to be a very strong and effective cell adhesive: in less than 5% of our total images captured did we deem there to have been significant cell movement. In evaluating mitochondrial function, it is important to control for cellular movement as well. While there are other adhesives such as fibronectin available, we believe Cell-Tak is a sufficiently effective adhesive with the only limitation being is cost. A fourth limitation of our study is that we make predominant use of PBMCs without further isolation to monocytes and lymphocytes. At this time most studies in bioenergetics function involving acute care illnesses make use of either platelets or PBMCs as there is significant cost/time to further isolate PBMCs. Also there is at least one study that explores the bioenergetics profile of human blood cells in which investigators found no difference with monocytes and lymphocytes.34 While this may represent a potential limitation, our use of PBMCs is in line with other recent studies.
Conclusion
Our study is one of the first to investigate mitochondrial networking in human blood cells with the ability to obtain results within 2-3 hours of obtaining samples. We demonstrate lognormal distribution of mitochondria in PBMCs which supports our previous findings. We show changes in both mitochondrial net movement and rates of fission/fusion events between a small cohort of healthy subjects compared to subjects with sepsis as an illustration of application. Our method can be applied to other disease states of clinical relevance such as diabetes and heart disease. Another application is to combine the measurement of mitochondrial bioenergetics such as respiration and ROS with networking to better elucidate the relationship between structural and energetic aspect of the mitochondria.
Highlights.
One common limitation of most of the methods for mitochondrial imaging is that the time required performing the technique and analyzing the results prohibits application to clinical diagnosis and therapy.
We recently demonstrated “whole-cell” mitochondrial analysis in a two-dimensional fashion with fluorescence microscopy.
Our developed technique allows evaluation of whole-cell mitochondrial networking, including assessment of mitochondrial motility and rates of fission and fusion events using human blood cells (peripheral mononuclear blood cells (PBMCs)) on a clinically relevant timescale.
We demonstrate this methodology in a cohort of healthy subjects as well as a cohort of hospitalized subjects having sepsis, an acute care illness.
As there is increasing use of human blood cells as a proxy of organ mitochondrial function with respiration in various disease states, the addition of mitochondrial dynamics will now allow for more thorough clinical evaluation of mitochondrial networking in human disease with potential exploration of therapeutics.
Acknowledgments
This work was funded by the University of Pennsylvania Department of Emergency Medicine and by NIH grant K12 HL109009 (DJ) and Office of Naval Research grant N000141612100 (DME).
Footnotes
Publisher's Disclaimer: This is a PDF file of an unedited manuscript that has been accepted for publication. As a service to our customers we are providing this early version of the manuscript. The manuscript will undergo copyediting, typesetting, and review of the resulting proof before it is published in its final citable form. Please note that during the production process errors may be discovered which could affect the content, and all legal disclaimers that apply to the journal pertain.
References
- 1.Wallace DC. Mitochondrial Energetics and Therapeutics. Annu Rev Pathol. 2010;5:297–348. doi: 10.1146/annurev.pathol.4.110807.092314. [DOI] [PMC free article] [PubMed] [Google Scholar]
- 2.Chance B, Williams GR. Respiratory enzymes in oxidative phosphorylation. I. Kinetics of oxygen utilization. J Biol Chem. 1955;217:383–393. [PubMed] [Google Scholar]
- 3.Brown GC. Control of respiration and ATP synthesis in mammalian mitochondria and cells. Biochemical Journal. 1992;284(Pt 1):1–13. doi: 10.1042/bj2840001. [DOI] [PMC free article] [PubMed] [Google Scholar]
- 4.Brown GC. Nitric oxide regulates mitochondrial respiration and cell functions by inhibiting cytochrome oxidase. FEBS Lett. 1995 Aug 7;369(2–3):136–9. doi: 10.1016/0014-5793(95)00763-y. [DOI] [PubMed] [Google Scholar]
- 5.Benard G, Bellance N, James D, et al. Mitochondrial bioenergetics and structural network organization. J Cell Sci. 2007 Mar 1;120(Pt 5):838–48. doi: 10.1242/jcs.03381. [DOI] [PubMed] [Google Scholar]
- 6.Pesta D, Gnaiger E. High-resolution respirometry: OXPHOS protocols for human cells and permeabilized fibers from small biopsies of human muscle. Methods Mol Biol. 2012;810:25–58. doi: 10.1007/978-1-61779-382-0_3. [DOI] [PubMed] [Google Scholar]
- 7.Giedt RJ, Pfeiffer DR, Matzavinos A, et al. Mitochondrial dynamics and motility inside living vascular endothelial cells: role of bioenergetics. Ann Biomed Eng. 2012 Sep;40(9):1903–16. doi: 10.1007/s10439-012-0568-6. [DOI] [PMC free article] [PubMed] [Google Scholar]
- 8.Frederick RL, Shaw JM. Moving mitochondria: establishing distribution of an essential organelle. Traffic. 2007 Dec;8(12):1668–75. doi: 10.1111/j.1600-0854.2007.00644.x. [DOI] [PMC free article] [PubMed] [Google Scholar]
- 9.Desai SP, Bhatia SN, Toner M, et al. Mitochondrial localization and the persistent migration of epithelial cancer cells. Biophys J. 2013 May 7;104(9):2077–88. doi: 10.1016/j.bpj.2013.03.025. [DOI] [PMC free article] [PubMed] [Google Scholar]
- 10.Giedt RJ, Yang C, Zweier JL, et al. Mitochondrial fission in endothelial cells after simulated ischemia/reperfusion: role of nitric oxide and reactive oxygen species. Free Radic Biol Med. 2012 Jan 15;52(2):348–56. doi: 10.1016/j.freeradbiomed.2011.10.491. [DOI] [PMC free article] [PubMed] [Google Scholar]
- 11.Yang Y, Lu B. Mitochondrial morphogenesis, distribution, and Parkinson disease: insights from PINK1. J Neuropathol Exp Neurol. 2009 Sep;68(9):953–63. doi: 10.1097/NEN.0b013e3181b2048c. [DOI] [PMC free article] [PubMed] [Google Scholar]
- 12.Jang DH, Shofer FS, Weiss SL, et al. Impairment of Mitochondrial Respiration Following Ex-vivo Cyanide Exposure in Peripheral Blood Mononuclear Cells. Clin Tox. 2016 Feb 5;1–5:26846815. doi: 10.3109/15563650.2016.1139712. [DOI] [PMC free article] [PubMed] [Google Scholar]
- 13.Jang DH, Kelly M, Eckmann DM. A preliminary study in the alterations of mitochondrial respiration in patients with carbon monoxide poisoning measured in blood cells. Clin Tox. 2017 Feb 16; doi: 10.1080/15563650.2017.1288912. [DOI] [PMC free article] [PubMed] [Google Scholar]
- 14.Jang DH, Greenwood J, Spyres MB, Eckmann DM. Measurement of mitochondrial respiration and motility in acute care: sepsis, trauma and poisoning. Journal of Intensive Care Medicine. Jan;32(1):86–94. doi: 10.1177/0885066616658449. [DOI] [PMC free article] [PubMed] [Google Scholar]
- 15.Du H, Guo L, Yan S, et al. Early deficits in synaptic mitochondria in an Alzheimer’s disease mouse model. Proc Natl Acad Sci. 2010;107:18670–18675. doi: 10.1073/pnas.1006586107. [DOI] [PMC free article] [PubMed] [Google Scholar]
- 16.Giedt RJ, Pfeiffer DR, Matzavinos A, et al. Mitochondrial dynamics and motility inside living vascular endothelial cells: role of bioenergetics. Ann Biomed Eng. 2012 Sep;40(9):1903–16. doi: 10.1007/s10439-012-0568-6. [DOI] [PMC free article] [PubMed] [Google Scholar]
- 17.Kandel J, Chou P, Eckmann DM. Automated detection of whole-cell mitochondrial motility and its dependence on cytoarchitectural integrity. Biotechnol Bioeng. 2015 Jul;112(7):1395–405. doi: 10.1002/bit.25563. [DOI] [PMC free article] [PubMed] [Google Scholar]
- 18.Jang DH, Seeger SC, Grady ME, et al. Mitochondrial dynamics and respiration within cells with increased open pore cytoskeletal meshes. Biology Open. doi: 10.1242/bio.029009. Accepted for publication. [DOI] [PMC free article] [PubMed] [Google Scholar]
- 19.Rhodes A, Evans LE, Alhazzani W, et al. Surviving Sepsis Campaign: International Guidelines for Management of Sepsis and Septic Shock: 2016. Critical care medicine. 2017;45:486–552. doi: 10.1097/CCM.0000000000002255. [DOI] [PubMed] [Google Scholar]
- 20.Singer M, Deutschman CS, Seymour CW, et al. The Third International Consensus Definitions for Sepsis and Septic Shock (Sepsis-3) Jama. 2016;315:801–10. doi: 10.1001/jama.2016.0287. [DOI] [PMC free article] [PubMed] [Google Scholar]
- 21.Rosdah AA, K Holien J, Delbridge LM, et al. Mitochondrial fission - a drug target for cytoprotection or cytodestruction? Pharmacol Res Perspect. 2016 Apr 21;4(3):e00235. doi: 10.1002/prp2.235. [DOI] [PMC free article] [PubMed] [Google Scholar]
- 22.Smith G, Gallo G. To mdivi-1 or not to mdivi-1: Is that the question? Dev Neurobiol. 2017 Aug 26; doi: 10.1002/dneu.22519. [DOI] [PMC free article] [PubMed] [Google Scholar]
- 23.Palanisami A, Fang J, Lowder TW, et al. Rapid morphological characterization of isolated mitochondria using Brownian motion. Anal Methods. 2012 Feb 1;4(2):513–521. doi: 10.1039/C2AY05686K. Epub 2012 Jan 26. [DOI] [PMC free article] [PubMed] [Google Scholar]
- 24.Puskarich MA, Kline JA, Watts JA, Shirey K, Hosler J, Jones AE. Early alterations in platelet mitochondrial function are associated with survival and organ failure in patients with septic shock. Journal of critical care. 2016;31:63–7. doi: 10.1016/j.jcrc.2015.10.005. [DOI] [PMC free article] [PubMed] [Google Scholar]
- 25.Weiss SL, Selak MA, Tuluc F, et al. Mitochondrial dysfunction in peripheral blood mononuclear cells in pediatric septic shock. Pediatric critical care medicine: a journal of the Society of Critical Care Medicine and the World Federation of Pediatric Intensive and Critical Care Societies. 2015;16:e4–e12. doi: 10.1097/PCC.0000000000000277. [DOI] [PMC free article] [PubMed] [Google Scholar]
- 26.Karamercan MA, Weiss SL, Villarroel JP, et al. Can peripheral blood mononuclear cells be used as a proxy for mitochondrial dysfunction in vital organs during hemorrhagic shock and resuscitation? Shock. 2013 Dec;40(6):476–84. doi: 10.1097/SHK.0000000000000026. [DOI] [PMC free article] [PubMed] [Google Scholar]
- 27.Chacko BK, Zhi D2, Darley-Usmar VM, et al. The Bioenergetic Health Index is a sensitive measure of oxidative stress in human monocytes. Redox Biol. 2016 Aug;8:43–50. doi: 10.1016/j.redox.2015.12.008. [DOI] [PMC free article] [PubMed] [Google Scholar]
- 28.Chacko BK, Kramer PA, Ravi S, et al. The Bioenergetic Health Index: a new concept in mitochondrial translational research. Clin Sci (Lond) 2014 Sep;127(6):367–73. doi: 10.1042/CS20140101. [DOI] [PMC free article] [PubMed] [Google Scholar]
- 29.Sjövall F, Morota S, Persson J, et al. Patients with sepsis exhibit increased mitochondrial respiratory capacity in peripheral blood immune cells. Crit Care. 2013 Jul 24;17(4):R152. doi: 10.1186/cc12831. [DOI] [PMC free article] [PubMed] [Google Scholar]
- 30.Sjövall F, Hansson MJ, Elmér E. Platelet mitochondrial function in sepsis. Crit Care Med. 2012 Jan;40(1):357. doi: 10.1097/CCM.0b013e318232949c. [DOI] [PubMed] [Google Scholar]
- 31.Sjövall F, Morota S, Hansson MJ, et al. Temporal increase of platelet mitochondrial respiration is negatively associated with clinical outcome in patients with sepsis. Crit Care. 2010;14(6):R214. doi: 10.1186/cc9337. [DOI] [PMC free article] [PubMed] [Google Scholar]
- 32.Morris RL, Hollenbeck PJ. The regulation of bidirectional mitochondrial transport is coordinated with axonal outgrowth. J Cell Sci. 1993 Mar;104(Pt 3):917–27. doi: 10.1242/jcs.104.3.917. [DOI] [PubMed] [Google Scholar]
- 33.Song W, Bossy B, Martin OJ, et al. Assessing mitochondrial morphology and dynamics using fluorescence wide-field microscopy and 3D image processing. Methods. 2008 Dec;46(4):295–303. doi: 10.1016/j.ymeth.2008.10.003. [DOI] [PMC free article] [PubMed] [Google Scholar]
- 34.Chacko BK, Kramer PA, Ravi S, et al. Methods for defining distinct bioenergetic profiles in platelets, lymphocytes, monocytes, and neutrophils, and the oxidative burst from human blood. Lab Invest. 2013;93(6):690–700. doi: 10.1038/labinvest.2013.53. [DOI] [PMC free article] [PubMed] [Google Scholar]