

Abstract
The eosinophil (Eos) surface phenotype and activation state is altered after recruitment into tissues and after exposure to pro-inflammatory cytokines. In addition, distinct Eos functional subsets have been described, suggesting that tissue-specific responses for Eos contribute to organ homeostasis. Understanding the mechanisms by which Eos subsets achieve their tissue-specific identity is currently an unmet goal for the eosinophil research community. Publicly archived expression data can be used to answer original questions, test and generate new hypotheses, and serve as a launching point for experimental design. With these goals in mind, we investigated the effect of genetic background, culture methods, and tissue residency on murine Eos gene expression using publicly available genome-wide expression data. Eos differentiated from cultures have a gene expression profile that is distinct from native homeostatic Eos; thus, researchers can repurpose published expression data to aid in selecting the appropriate culture method to study their gene of interest. In addition, we identified Eos lung- and gastrointestinal-specific transcriptomes, highlighting the profound effect of local tissue environment on gene expression in a terminally differentiated granulocyte even at homeostasis. Expanding the “toolbox” of Eos researchers to include public-data reuse can reduce redundancy, increase research efficiency, and lead to new biological insights.
Keywords: allergy, gene regulation, mucosal immunology
Introduction
Eosinophils (Eos) are terminally differentiated granulocytes that accumulate at mucosal surfaces, including the gastrointestinal tract (GI), lungs, and uterus, to contribute to tissue homeostasis [1, 2]. In addition, Eos have long been associated with exacerbation of allergic and other inflammatory disorders [3]. It is well established that the Eos surface phenotype is altered during disease [4-7], presumably as a consequence of exposure to activating cytokines. Indeed, interleukin 5 (IL-5) stimulation results in differential surface phenotype and gene expression for Eos [8-10]. In addition, tissue-resident Eos at homeostasis have been shown to have a distinct phenotype [11-13], suggesting that the local environment induces changes in Eos phenotype for tissue-specific functions. Understanding the mechanisms by which Eos subsets achieve their tissue-specific functions and whether these functions can be modulated for therapeutic purposes are identified goals for the eosinophil research community.
Advancements in high-throughput, next-generation sequencing have yielded large amounts of genome-wide gene expression data that are collected in pubic archives, including the Gene Expression Omnibus (GEO) [14]. Importantly, publicly archived data can be reused to answer questions beyond those posed in the initial study that generated the data and to serve as a launching point for the design of future experiments [15, 16]. For example, gene expression data from multiple published studies was reused to delineate peripheral blood signatures for respiratory viral infections [17, 18], highlighting how the reuse of public data can lead to new biological insight and be used to test and generate new hypotheses. Publicly archived expression data can complement the traditional research model, hypothesis generation followed by experiments designed to test the hypothesis, via the analysis of deposited data to refine (or generate) hypotheses. To demonstrate how this could be used in Eos-focused research, we searched the GEO public archive for available Eos genome-wide RNA sequencing (RNA-seq) data and reused the data to investigate the effect of genetic background, tissue residency, and culture methods on homeostatic Eos gene expression.
Materials and Methods
Public Archive Search
We searched GEO for deposited Eos genome-wide gene expression data [14]. At the time of our analysis, almost 2000 GEO DataSets were associated with the key words “eosinophil” or “eosinophils”, but only 6 DataSets contained murine Eos RNA-seq data. Seven samples within these DataSets [19, 20] were data derived from native Eos purified from tissues at homeostasis from wild-type mice (Table 1). In addition, we identified RNA-seq data from murine Eos differentiated from unselected (GSE55385) whole bone marrow (WBM) cells and low-density (GSE43660) bone marrow (LDBM) cells in culture [21, 22].
Table 1.
Native eosinophil genome-wide gene expression data
| GEO Accession # | Identification | Samples* | Strain | Organ/Tissue | Reference |
|---|---|---|---|---|---|
| GSE69707 | CCR3+, Siglec-F+ | 2 | BALB/c | Bone Marrow | 19 |
| GSE110299 | CCR3+, Siglec-F+ | 2 | C57BL6/J | Bone Marrow | |
| GSE56292 | Siglec-F+, CD11c−, Gr1lo, autofluorescence negative | 2 | C57BL6/J | Lung | 20 |
| GSE106213 | CD45+, CD11b+, Siglec-F+ | 3 | C57BL6/J | GI (Colon) |
“Samples” refer to the number of unique RNA samples submitted for sequencing; GI, gastrointestinal; lo, low
Mice
BALB/c and C57BL6/J wild-type mice were analyzed at 4 to 8 weeks of age. All mice were housed under specific pathogen-free conditions and handled under approved protocols (#2E09072) of the Institutional Animal Care and Use Committee of Cincinnati Children’s Hospital Medical Center.
Eosinophil Isolation
Native Eos were sorted, as previously reported [19], on a FACSAria II (BD Biosciences) maintained by the Research Flow Cytometry Core at Cincinnati Children’s Hospital Medical Center.
Culture-differentiated Eosinophils (cEos)
For confirmatory expression experiments, Eos were differentiated from unselected WBM or LDBM cells in culture as reported [23, 24].
Gene Expression Analysis
For the native Eos from pooled bone marrow of C57BL6/J mice, total RNA and RNA-seq libraries were prepared as previously described [19]. The native C57BL6/J eosinophil RNA-seq data was deposited in GEO database (GSE110299). Sequencing files for Eos RNA from GSE55385, GSE43660, GSE56292, GSE69707 and GSE106213 were downloaded from the GEO database [14]. RNA-seq analysis was performed using BioWardrobe [25], as previously described [19]. A minimum reads per kilobase per million mapped reads (RPKM) equivalent to 2 was deemed the lower limit of expression. Differentially expressed genes with DESeq [26] Padj < 0.05 were analyzed. For gene set enrichment analysis (GSEA), ranked gene lists were created from DESeq output by removing all genes that did not reach 5 RPKM expression in at least one condition and sorting the remaining genes by DESeq-calculated log fold change. GSEA v.3.0 was run on the pre-ranked list against C5bp (Gene ontology biological process) v6.1 gene set collection with default parameters [27, 28]. Enrichment plots for gene sets that are overrepresented in the ranked gene lists were generated by GSEA [27]. Briefly, enrichment scores are calculated by going through the list of genes ranked by fold change in expression and increasing the cumulative score when a gene is included in a specific set and decreasing when a gene is not included in the set. Enrichment plots provided by GSEA are a graphical view of the enrichment scores which reflects the degree to which a gene set is overrepresented in the differentially expressed genes. Gene sets with distinct peaks at the beginning of the plot are overrepresented in induced genes, while those with valley at the end are overrepresented among silenced genes. Both of these are likely to be interesting to the investigator, as they represent greater enrichment for genes in that specific biological pathway. For confirmatory expression experiments, cDNA was synthesized from pooled total RNA from sorted native Eos (n ≥ 10 mice per group, 2-3 independent sorts) and from total RNA from cEos (n ≥ 9 mice per group, n = 2-3 independent experiments) using Superscript VILO cDNA synthesis kit (Thermo Fisher Scientific). Quantitative PCR (qPCR) was performed using PowerUp SYBR Green Master Mix (Thermo Fisher Scientific) and specific primers for Cd300ld (TCAGCCACATTCCCACTCAT [forward], CTGCCTCCTGAGTGTTGAGA [reverse]) and Mpo (CTTTCCTGCCCTTCCCAGTA [forward], CGTGCCATATTGTGCCATCA [reverse]). Data were analyzed for fold expression over Gapdh (2−dCt) and groups compared using a two-tailed, unpaired t-test (GraphPad Prism). Differences were considered statistically significant when P < 0.05.
Results
Genetic background has minimal effect
Strain-specific genetic variation can result in differential binding of transcription factors to regulatory elements and strain-specific gene expression patterns [29]; thus, we compared gene expression between native Eos sorted from the bone marrow of BALB/c (GSE69707, [19]) and C57BL6/J (GSE110299) to assess the effect of genetic background on gene expression at homeostasis (Table 1). There were 7201 genes that were expressed (RPKM > 2) by either BALB/c or C57BL6/J bone marrow Eos (Figure 1A, Supplemental Table 1). Approximately 10% (717/7201) of the expressed genes had expression levels that were significantly different (Padj ˂ 0.05), and the differential expression was 2-fold or more between BALB/c and C57BL6/J Eos (Figure 1A). Expression of a member of the CD300 family of molecules, CLM-5 (Cd300ld), was significantly different between native BALB/c and C57BL6/J Eos from the bone marrow, and we confirmed differential expression with independent samples via qPCR (Figures 1B). Overall, there was a strong correlation (r = 0.81, P < 0.0001) for gene expression between native BALB/c and C57BL6/J Eos, highlighting the small effect of genetic background variation on homeostatic gene expression in Eos from the bone marrow (Figure 1A).
Figure 1. Genetic variation has little effect on Eos transcriptome.
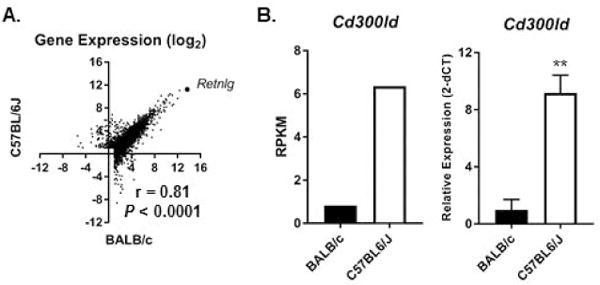
(A) Scatter plot comparing gene expression (log2 mean RPKM) in native Eos sorted from the bone marrow of C57BL6/J (GSE110299) and BALB/c (GSE69707) mice is shown. The gene Retnlg with similar expression in both strains and Spearman correlation are shown. (B) Expression levels (mean RPKM in left panel from RNA-seq and normalized relative gene expression [mean ± SEM, representative of 2 experiments] from qPCR in right panel) of Cd300ld in native Eos from the bone marrow at homeostasis are shown. **P < 0.01.
Culture-differentiated Eos differ from native Eos
Robust and highly reproducible Eos differentiation systems have been developed that start with unselected [23] or low-density [24] murine bone marrow cells. Genome-wide gene expression data were available from culture-differentiated Eos (cEos) from unselected bone marrow (WBM, C57BL6/J, GSE55385, [21]) and from cEos from LDBM cells (BALB/c, GSE43660, [22]). We compared gene expression in cEos-LDBM with that of native Eos sorted from BALB/c bone marrow (Figure 2A) and in cEos-WBM with that of native Eos sorted from C57BL6/J bone marrow (Figure 2B). Expression levels for 43% (4,163) of the 9,716 genes that were expressed (RPKM > 2) by either the cEos-LDBM or the native Eos (BALB/c) were significantly different (Padj < 0.05, Figure 2A, Supplementary Table 2). In comparison, expression levels were significantly different for 69% (6556/9427) of the genes expressed in the cEos-WBM compared to the native Eos (C57BL6/J) with 62% (4097/6556) of the differentially expressed genes higher in the cEos-WBM (Figure 2B, Supplementary Table 3). Native Eos expressed higher levels of Mpo and Elane mRNAs than did cEos (Figure 2C). In contrast, cEos expressed markedly higher levels of mRNAs for the granule proteins Epx (eosinophil peroxidase) and Prg2 (major basic protein) than did native Eos (Figure 2D). We confirmed the differential expression of Mpo between native and cEos with independent samples (Figure 2E). Notably, gene expression in native Eos was more comparable to that of cEos-LDBM (r = 0.73, Figure 2A) than cEos-WBM (r = 0.56, Figure 2B). In addition, we compared expression for genes known to be associated with Eos in inflammatory environments and noted higher expression in the cEos than native Eos, except for Il13ra1 (Table 2).
Figure 2. Gene expression in culture-differentiated Eos (cEos) differs from that of native Eos.
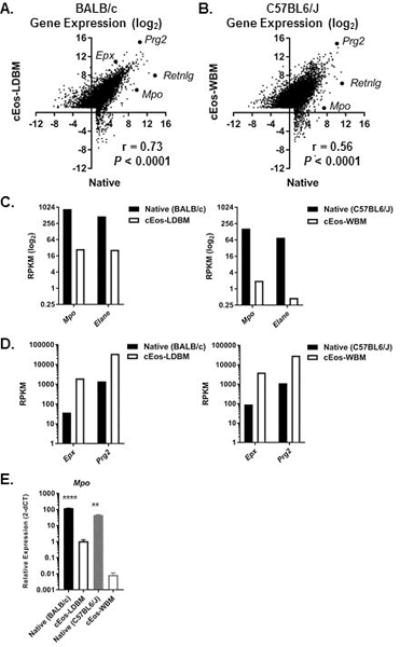
(A-B) Scatter plots comparing gene expression (log2 mean RPKM) between native Eos (GSE69707) and Eos cultured from low-density (cEos-LDBM, GSE43660) or unselected whole (cEos-WBM, GSE55385) bone marrow cells and Spearman correlation are shown. Representative genes are labeled in the plots. (C-D) Expression levels (mean RPKM) of Mpo, Elane, Epx and Prg2 in native Eos and cEos are shown. (E) Normalized relative expression level (mean ± SEM) in native Eos and cEos are shown. **P < 0.01, ****P < 0.0001, comparing strain-specific native to cEos.
Table 2.
Genes associated with inflammatory eosinophils
| RPKM | ||||
|---|---|---|---|---|
| Gene* | Native Eos BALB/c | cEos-LDBM | Native Eos C57BL6/J | cEos-WBM |
| C3ar1 | 14 | 94 | 13 | 41 |
| Cd101 | 2 | 17 | 1 | 4 |
| Cd69 | 1 | 2 | 0 | 5 |
| Il13ra1 | 0 | 1 | 0 | 0 |
| Il4 | 2 | 3 | 14 | 45 |
| Il4ra | 1 | 8 | 1 | 17 |
| Il6 | 0 | 5 | 0 | 4 |
| Itgax | 1 | 22 | 1 | 10 |
| Itgb5 | 0 | 8 | 0 | 1 |
| Sell | 83 | 137 | 52 | 77 |
| Slc3a2 | 0 | 3 | 4 | 130 |
| Tlr4 | 2 | 19 | 0 | 4 |
Gene list was compiled from data published in PMID: 2758519 and PMID: 26414117; cEos, culture-differentiated eosinophils; Eos, eosinophils; LDBM, low-density bone marrow; WBM, whole bone marrow.
Gene ontology analysis of the genes of the differentially expressed genes between cEos-WBM and native Eos showed that this gene set was enriched for pathways associated with protein synthesis and localization (Figure 3A), with higher expression in the cEos-WBM than native Eos. Notably, translation of select mRNAs is induced in mature human Eos in response to cytokine stimulation [30, 31]; thus, differentiation in the presence of IL-5 may enhance protein translation in murine cEos. In contrast, the differentially expressed gene set between cEos-LDBM and native Eos was enriched for genes associated with sterol synthesis and metabolism (Figure 3B), emphasizing the transcriptomic differences not only between the cEos and native Eos, but also between the method used to produce the cEos.
Figure 3. Gene ontology analysis of differentially expressed genes between cEos and native Eos.
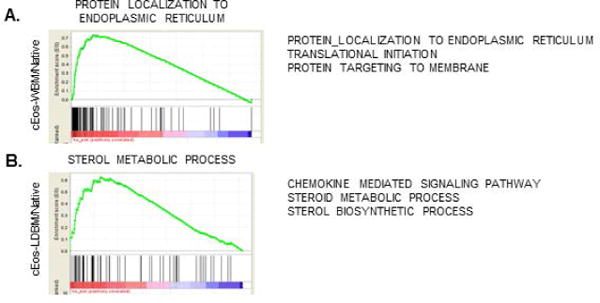
Representative enrichment plots for gene set enrichment analysis results comparing native Eos with cEos-WBM (C57BL6/J) (A) or cEos-LDBM (BALB/c) (B) are shown. The red-blue scale represents list of all expressed genes ranked by expression fold change between cEos and native Eos from highest (red) to lowest (blue) fold change in expression [27]. Genes included in the biological pathway set are represented as black vertical lines along the bottom. The enrichment score (green) is calculated by going along the ranked list so that the score increases if the gene is a part of the pathway set and decreases if the gene is not. A list of selected enriched pathways with a normalized enrichment score ≥ 2.0 are also shown.
Tissue residency alters Eos transcriptome
As Eos are primarily tissue-residing leukocytes [3, 32], we next evaluated the effect of tissue residency on Eos gene expression at homeostasis. We first compared Eos sorted from murine lungs (GSE56292 [20]) to Eos sorted from bone marrow (GSE110299) at homeostasis (Figure 4A). Of the genes expressed (RPKM > 2) either by the lung- or bone marrow–resident Eos (BM Eos, Supplemental Table 4), approximately 57% (4793/8438) were differentially expressed (Padj < 0.05) with higher expression in the lung Eos for 62% (2979/4793) of the differentially expressed genes (Figure 4A). We noted higher expression of Cd69, Cd9 and Il4 in the lung Eos than in the BM Eos (Figure 4B), highlighting the phenotypic changes to Eos that occur in response to the local lung environment. Notably, 32% (2451/7591) of the genes expressed by the lung Eos were not expressed by the BM Eos (Figure 4C), and 19% (1424/7591) of the expressed genes were uniquely expressed by the lung Eos (Figure 4C). Overall, there was a modest correlation (r = 0.52) for gene expression between lung Eos and BM Eos at homeostasis (Figure 4A). Gene ontology analysis of the differentially expressed genes between lung Eos and BM Eos revealed an enrichment for genes associated with IFN-γ production, innate immune responses and chemotaxis in the lung Eos compared to BM Eos (Figure 4D).
Figure 4. Lung-resident Eos have markedly different transcriptomes than do native Eos.
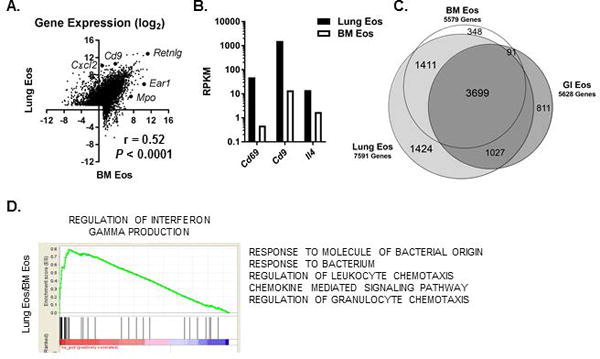
(A) Scatter plot comparing gene expression (log2 mean RPKM) between lung (Lung, GSE56292) and bone marrow (BM, GSE110299) Eos at homeostasis and Spearman correlation are shown. (B) Expression level (mean RPKM) of representative genes that are expressed higher in Lung Eos than BM Eos are shown. (C) Venn diagram with overlap of homeostatic gene expression between Lung Eos (light gray), BM Eos (white) and Eos sorted from the gastrointestinal tract (dark gray, GI Eos, GSE106213) is shown. (D) Representative enrichment plot for gene set enrichment analysis results comparing Lung Eos and BM Eos are shown. A list of enriched pathways with higher expression in Lung Eos and a normalized enrichment score ≥ 2.2 are also shown.
Eos isolated from the colons of murine gastrointestinal tracts at homeostasis (GI Eos) and BM Eos expressed fewer genes (5628 and 5579, respectively) than lung Eos (7591, Figure 4C). Of the total number of genes expressed by either BM Eos or GI Eos, 61% (4761/7745) were differentially expressed, with 52% of those (2463/4761) having higher expression in the GI Eos (Figure 5A, Supplemental Table 5). Expression of several chemokines, including Cxcl2, Ccl9 and Ccl6, were higher in the GI Eos than BM Eos (Figure 5B). In contrast, mRNA for Il4 was lower in GI Eos than BM Eos (Figure 5B). Notably, 1838 genes were expressed by GI Eos and not BM Eos, and 811 genes were uniquely expressed by GI Eos (Figure 4C). Overall, the transcriptome of Eos isolated from murine colons at homeostasis was significantly different (r = 0.18) than the transcriptome of Eos isolated from the bone marrow (GI Eos vs. BM Eos, Figure 5A). Gene ontology analysis of the differentially expressed genes revealed enrichment for genes associated with chemotaxis, response to vitamins and response to IL-1 in the GI Eos compared to BM Eos (Figure 5C).
Figure 5. Gastrointestinal resident Eos have markedly different transcriptomes than BM and Lung Eos.
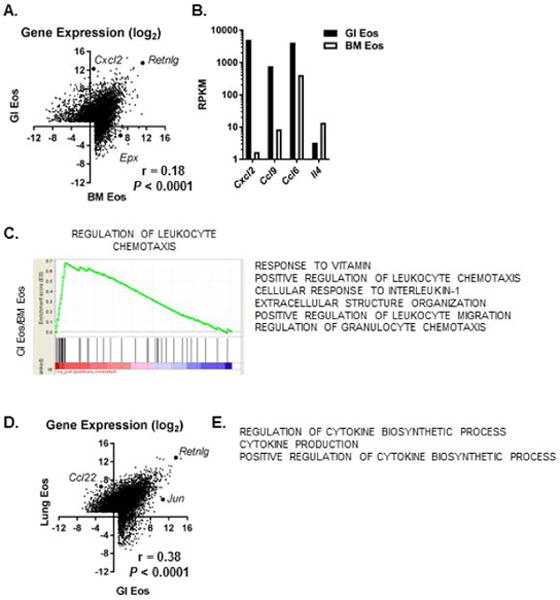
(A) Scatter plot comparing gene expression (log2 mean RPKM) between gastrointestinal (GI, GSE106213) and bone marrow (BM, GSE110299) Eos at homeostasis and Spearman correlation are shown. (B) Expression level (mean RPKM) of representative genes are shown. (C) Representative enrichment plot for gene set enrichment analysis results comparing GI Eos and BM Eos are shown. A list of enriched pathways with higher expression in GI Eos and a normalized enrichment score ≥ 2.1 are also shown. (D) Scatter plot comparing gene expression (log2 mean RPKM) between GI and Lung Eos (GSE56292) at homeostasis and Spearman correlation are shown. (E) A list of enriched pathways with higher expression in Lung Eos than GI Eos and a normalized enrichment score ≥ 2.0 is shown.
There was little correlation between the transcriptomes of the tissue-resident Eos (Figure 5D, lung Eos vs GI Eos, r = 0.38). Gene ontology analysis of the differentially expressed genes revealed enrichment for genes associated with cytokine production in lung Eos compared to GI Eos (Figure 5E). Notably, over 1000 genes were expressed in both the tissue-resident Eos that were not expressed by the BM Eos (Figure 4C), suggesting a common transcriptional program that includes Il4ra, Cd69, Cd14 and Il10ra for Eos when they enter a mucosal environment.
We compared expression of genes recently associated with regulatory Eos found in the lung at homeostasis [11] (Table 3) and noted higher expression of Nedd4, Runx3, Ldlr and Sell in lung Eos than in BM Eos, highlighting consistency of expression data for lung Eos at homeostasis across studies [11, 20]. Surface expression of CD62L discriminated between regulatory and inflammatory Eos in the lung [11]. Lung Eos did have modestly higher expression of mRNA for L-selectin (CD62L, encoded by Sell) than BM or GI Eos (Table 3), suggesting that transcriptional regulation of Sell expression is likely one of several mechanisms to control CD62L surface expression on Eos.
Table 3.
Genes associated with regulatory eosinophils
| RPKM | |||
|---|---|---|---|
| Gene* | BM Eos | Lung Eos | GI Eos |
| Anxa1 | 66 | 48 | 21 |
| Ldlr | 6 | 60 | 6 |
| Nedd4 | 31 | 68 | 14 |
| Runx3 | 5 | 15 | 18 |
| Sell | 52 | 68 | 36 |
| Serpinb1a | 5 | 7 | 16 |
Gene list was compiled from data published in PMID: 2758519; BM, bone marrow; Eos, eosinophils; GI, gastrointestinal.
Discussion
Publicly available genome-wide gene expression data can be used for hypothesis development and increase research efficiency [15, 16]. We searched the public archive GEO for deposited RNA-seq data from Eos at homeostasis [14] and identified 7 samples for our analysis (3 from GI [C57BL6/J], 2 from lung [C57BL6/J], and 2 from BM [BALB/c]). We added 2 samples from Eos sorted from C57BL6/J BM for the study (GSE110299). Comparatively, murine neutrophils and basophils have 38 and 4 data sets, respectively, that contain RNA-seq data [14]. RNA-seq profiling of purified human peripheral blood Eos left untreated or treated with TGF-β has been completed (n = one sample of each), and supplementary data for the published study include RPKM values [33]. No human Eos RNA-seq raw data are otherwise currently publicly available. Thus, Eos are underrepresented in the public archives of genome-wide gene expression. As biologist-friendly analysis tools (e.g., Biowardrobe) continue to become available, it will be important for Eos researchers to continue to add expression data to the public archives.
Immune responses vary between inbred laboratory mouse strains due to genetic variation (i.e., polymorphisms) [34]. This is highlighted by susceptibility differences between strains to experimental food allergy models [35, 36]. We noted greater expression of Cd300ld, a CD300 family member, in C57BL6/J than BALB/c Eos. The CD300 family of receptors belongs to the immunoglobulin receptor super family [37] and have been shown to regulate Eos functional responses [38, 39]. Currently, there is not much knowledge regarding the expression or function of Cd300ld in Eos. Eos are known to express various CD300 family members including CD300a and CD300f [40]. Interestingly, biochemical analyses have shown that CD300ld likely acts as the paired co-activating receptor of CD300f. Differential expression of innate receptors, such as Cd300ld, may contribute to the varied immune responses between strains. At homeostasis, there was strong correlation between the transcriptomes of Eos sorted from the BM of C57BL/6 and BALB/c mice, with ~10% genes differentially expressed (Figure 1).
Since its initial description in 2008 [23], a liquid culture system that starts with unselected WBM to generate Eos ex vivo has been cited in almost 100 publications, highlighting the importance of this tool for researchers. We described an alternate culture system that starts with LDBM cells for studies focused on development, as the mature cells are depleted via density centrifugation [24, 41]. Comparing the Eos differentiated in the cultures (cEos) to native Eos sorted from the bone marrow revealed differential expression of a large subset of genes, likely due to the IL-5 needed to expand and differentiate the bone marrow cells to Eos ex vivo. Interestingly, the pathways enriched in the cEos are not the same between the two culture methods. We did not directly compare the two populations of cEos due to the difference in genetic background with the available expression data, so it is unclear whether the culture method–specific transcriptomes are due to differences in starting population or strain-specific differences in response to IL-5. Pathways associated with protein synthesis and localization were enriched in the gene sets upregulated in the cEos derived from the unselected bone marrow (GSE55385, Figure 3A). This is consistent with higher expression of granule proteins in the cEos than native Eos. The differentially expressed genes in cEos that result from LDBM cells (GSE43660) showed enrichment for pathways associated with sterol synthesis (Figure 3B), perhaps suggesting increased lipid body formation in response to IL-5 [42]. In addition, cEos contained higher mRNA expression for genes known to be associated with Eos in inflammatory environments (Table 2). Together, these data suggest that the cEos may represent a unique Eos subset that is produced under IL-5–mediated pressure. Similarly, neutrophil development is differentially regulated depending on the level of G-CSF expression [43], resulting in alternate neutrophil phenotypes. Ideally, expression data comparing cEos and native Eos with matching genetic backgrounds for multiple strains would be publicly available for researchers in the future to compare expression of their gene-of-interest to aid in selecting an appropriate culture system for their experiments.
Prior studies have noted differential gene expression between Eos subsets [11-13], but key questions remain unanswered regarding the Eos role at homeostasis at mucosal surfaces. Understanding the mechanisms by which Eos subsets achieve their tissue-specific functions remains an unmet need. Similar to studies with tissue-specific macrophage identities [44, 45], differential expression patterns between tissue-resident Eos subsets and the BM-resident Eos will aid in identifying pathways critical for tissue-specific functional responses. We noted significant differential gene expression between GI-, lung- and BM-resident Eos at homeostasis. The transcriptome divergence between the tissue-resident Eos suggests a greater transcriptional responsiveness than expected for the terminally differentiated cells.
Importantly, variation in the methods for RNA-seq library construction, including variable levels of DNA contamination and quality of the published datasets, likely contributes to some of the differential expression detected; yet, the pathways enriched make biologic sense, such as chemotaxis pathways in tissue-resident Eos, highlighting the relevancy of the analysis. With data reuse analysis, new research avenues can be developed that focus on the environmental cues, as well as the transcription factors, that are responsible for the tissue-specific transcriptomes. Though the human Eos proteome correlates generally with mRNA abundance [46], there are notable exceptions [30]; thus, independent confirmation of gene and protein expression is critical as new hypotheses are developed on the basis of genome-wide data reuse. It remains to be determined whether the responses of specific Eos subsets, such as the recently identified regulatory Eos subset residing in the lung [11], can be modulated for therapeutic purposes. Understanding the mechanisms by which the various Eos subsets are developed is an important next step. Expanding the “toolbox” of Eos researchers to include public-data reuse is especially attractive due to the inherent challenges associated with working with this relatively rare and terminally differentiated leukocyte.
Supplementary Material
Summary Sentence.
Publicly archived eosinophil genome-wide expression data can be used to answer original questions, generate new hypotheses, and serve as a launching point for experimental design.
Acknowledgments
This work was supported by the NIH grant R01 AI130033 (PCF) and DP2 GM11913 (AB). This project was also supported in part by the NIH grant P30 DK078392 (Gene and Protein Expression and Flow Cytometry Cores) of the Digestive Disease Research Core Center in Cincinnati. We thank Shawna Hottinger for editorial assistance.
Abbreviations
- DESeq
differential expression sequence
- GEO
Gene Expression Omnibus
- GSEA
gene set enrichment analysis
- IFN
interferon
- IL
interleukin
- LDBM
low-density bone marrow
- RPKM
reads per kilobase million mapped reads
- WBM
whole bone marrow
Footnotes
Conflict of Interest Disclosure
P.C. Fulkerson has received grants from the National Institutes of Health, has served as a consultant for Genentech, Inc. and has received research funding from Knopp Biosciences, LLC. The remaining authors declare no relevant conflicts of interest.
Authorship
J.O.G, A.Mk. and H.R. performed experiments. J.O.G., A.M., H.R., A.Mz., A.B. and P.C.F. analyzed data. J.O.G., A.Mk., A.B. and P.C.F. wrote the manuscript.
References
- 1.Marichal T, Mesnil C, Bureau F. Homeostatic Eosinophils: Characteristics and Functions. Front Med (Lausanne) 2017;4:101. doi: 10.3389/fmed.2017.00101. [DOI] [PMC free article] [PubMed] [Google Scholar]
- 2.Jacobsen EA, Helmers RA, Lee JJ, Lee NA. The expanding role(s) of eosinophils in health and disease. Blood. 2012;120:3882–90. doi: 10.1182/blood-2012-06-330845. [DOI] [PMC free article] [PubMed] [Google Scholar]
- 3.Rosenberg HF, Dyer KD, Foster PS. Eosinophils: changing perspectives in health and disease. Nature reviews. Immunology. 2013;13:9–22. doi: 10.1038/nri3341. [DOI] [PMC free article] [PubMed] [Google Scholar]
- 4.Na HJ, Hamilton RG, Klion AD, Bochner BS. Biomarkers of eosinophil involvement in allergic and eosinophilic diseases: review of phenotypic and serum markers including a novel assay to quantify levels of soluble Siglec-8. Journal of immunological methods. 2012;383:39–46. doi: 10.1016/j.jim.2012.05.017. [DOI] [PMC free article] [PubMed] [Google Scholar]
- 5.Johansson MW. Activation states of blood eosinophils in asthma. Clinical and experimental allergy : journal of the British Society for Allergy and Clinical Immunology. 2014;44:482–98. doi: 10.1111/cea.12292. [DOI] [PMC free article] [PubMed] [Google Scholar]
- 6.Metcalfe DD, Pawankar R, Ackerman SJ, Akin C, Clayton F, Falcone FH, Gleich GJ, Irani AM, Johansson MW, Klion AD, Leiferman KM, Levi-Schaffer F, Nilsson G, Okayama Y, Prussin C, Schroeder JT, Schwartz LB, Simon HU, Walls AF, Triggiani M. Biomarkers of the involvement of mast cells, basophils and eosinophils in asthma and allergic diseases. The World Allergy Organization journal. 2016;9:7. doi: 10.1186/s40413-016-0094-3. [DOI] [PMC free article] [PubMed] [Google Scholar]
- 7.Johansson MW. Eosinophil Activation Status in Separate Compartments and Association with Asthma. Front Med (Lausanne) 2017;4:75. doi: 10.3389/fmed.2017.00075. [DOI] [PMC free article] [PubMed] [Google Scholar]
- 8.Kouro T, Takatsu K. IL-5- and eosinophil-mediated inflammation: from discovery to therapy. International immunology. 2009;21:1303–9. doi: 10.1093/intimm/dxp102. [DOI] [PubMed] [Google Scholar]
- 9.Bystrom J, Wynn TA, Domachowske JB, Rosenberg HF. Gene microarray analysis reveals interleukin-5-dependent transcriptional targets in mouse bone marrow. Blood. 2004;103:868–77. doi: 10.1182/blood-2003-08-2778. [DOI] [PubMed] [Google Scholar]
- 10.Bates ME, Liu LY, Esnault S, Stout BA, Fonkem E, Kung V, Sedgwick JB, Kelly EA, Bates DM, Malter JS, Busse WW, Bertics PJ. Expression of interleukin-5- and granulocyte macrophage-colony-stimulating factor-responsive genes in blood and airway eosinophils. American journal of respiratory cell and molecular biology. 2004;30:736–43. doi: 10.1165/rcmb.2003-0234OC. [DOI] [PubMed] [Google Scholar]
- 11.Mesnil C, Raulier S, Paulissen G, Xiao X, Birrell MA, Pirottin D, Janss T, Starkl P, Ramery E, Henket M, Schleich FN, Radermecker M, Thielemans K, Gillet L, Thiry M, Belvisi MG, Louis R, Desmet C, Marichal T, Bureau F. Lung-resident eosinophils represent a distinct regulatory eosinophil subset. The Journal of clinical investigation. 2016;126:3279–95. doi: 10.1172/JCI85664. [DOI] [PMC free article] [PubMed] [Google Scholar]
- 12.Wen T, Mingler MK, Blanchard C, Wahl B, Pabst O, Rothenberg ME. The pan-B cell marker CD22 is expressed on gastrointestinal eosinophils and negatively regulates tissue eosinophilia. J Immunol. 2012;188:1075–82. doi: 10.4049/jimmunol.1102222. [DOI] [PMC free article] [PubMed] [Google Scholar]
- 13.Abdala Valencia H, Loffredo LF, Misharin AV, Berdnikovs S. Phenotypic plasticity and targeting of Siglec-F(high) CD11c(low) eosinophils to the airway in a murine model of asthma. Allergy. 2016;71:267–71. doi: 10.1111/all.12776. [DOI] [PubMed] [Google Scholar]
- 14.Barrett T, Wilhite SE, Ledoux P, Evangelista C, Kim IF, Tomashevsky M, Marshall KA, Phillippy KH, Sherman PM, Holko M, Yefanov A, Lee H, Zhang N, Robertson CL, Serova N, Davis S, Soboleva A. NCBI GEO: archive for functional genomics data sets--update. Nucleic acids research. 2013;41:D991–5. doi: 10.1093/nar/gks1193. [DOI] [PMC free article] [PubMed] [Google Scholar]
- 15.Sparks R, Lau WW, Tsang JS. Expanding the Immunology Toolbox: Embracing Public-Data Reuse and Crowdsourcing. Immunity. 2016;45:1191–1204. doi: 10.1016/j.immuni.2016.12.008. [DOI] [PubMed] [Google Scholar]
- 16.Rung J, Brazma A. Reuse of public genome-wide gene expression data. Nat Rev Genet. 2013;14:89–99. doi: 10.1038/nrg3394. [DOI] [PubMed] [Google Scholar]
- 17.Andres-Terre M, McGuire HM, Pouliot Y, Bongen E, Sweeney TE, Tato CM, Khatri P. Integrated, Multi-cohort Analysis Identifies Conserved Transcriptional Signatures across Multiple Respiratory Viruses. Immunity. 2015;43:1199–211. doi: 10.1016/j.immuni.2015.11.003. [DOI] [PMC free article] [PubMed] [Google Scholar]
- 18.Tsalik EL, Henao R, Nichols M, Burke T, Ko ER, McClain MT, Hudson LL, Mazur A, Freeman DH, Veldman T, Langley RJ, Quackenbush EB, Glickman SW, Cairns CB, Jaehne AK, Rivers EP, Otero RM, Zaas AK, Kingsmore SF, Lucas J, Fowler VG, Jr, Carin L, Ginsburg GS, Woods CW. Host gene expression classifiers diagnose acute respiratory illness etiology. Science translational medicine. 2016;8:322ra11. doi: 10.1126/scitranslmed.aad6873. [DOI] [PMC free article] [PubMed] [Google Scholar]
- 19.Bouffi C, Kartashov AV, Schollaert KL, Chen X, Bacon WC, Weirauch MT, Barski A, Fulkerson PC. Transcription Factor Repertoire of Homeostatic Eosinophilopoiesis. J Immunol. 2015;195:2683–95. doi: 10.4049/jimmunol.1500510. [DOI] [PMC free article] [PubMed] [Google Scholar]
- 20.Motomura Y, Morita H, Moro K, Nakae S, Artis D, Endo TA, Kuroki Y, Ohara O, Koyasu S, Kubo M. Basophil-derived interleukin-4 controls the function of natural helper cells, a member of ILC2s, in lung inflammation. Immunity. 2014;40:758–71. doi: 10.1016/j.immuni.2014.04.013. [DOI] [PubMed] [Google Scholar]
- 21.Hutchins AP, Takahashi Y, Miranda-Saavedra D. Genomic analysis of LPS-stimulated myeloid cells identifies a common pro-inflammatory response but divergent IL-10 anti-inflammatory responses. Scientific reports. 2015;5:9100. doi: 10.1038/srep09100. [DOI] [PMC free article] [PubMed] [Google Scholar]
- 22.Bouffi C, Rochman M, Zust CB, Stucke EM, Kartashov A, Fulkerson PC, Barski A, Rothenberg ME. IL-33 markedly activates murine eosinophils by an NF-kappaB-dependent mechanism differentially dependent upon an IL-4-driven autoinflammatory loop. J Immunol. 2013;191:4317–25. doi: 10.4049/jimmunol.1301465. [DOI] [PMC free article] [PubMed] [Google Scholar]
- 23.Dyer KD, Moser JM, Czapiga M, Siegel SJ, Percopo CM, Rosenberg HF. Functionally competent eosinophils differentiated ex vivo in high purity from normal mouse bone marrow. J Immunol. 2008;181:4004–9. doi: 10.4049/jimmunol.181.6.4004. [DOI] [PMC free article] [PubMed] [Google Scholar]
- 24.Fulkerson PC, Schollaert KL, Bouffi C, Rothenberg ME. IL-5 triggers a cooperative cytokine network that promotes eosinophil precursor maturation. J Immunol. 2014;193:4043–52. doi: 10.4049/jimmunol.1400732. [DOI] [PMC free article] [PubMed] [Google Scholar]
- 25.Kartashov AV, Barski A. BioWardrobe: an integrated platform for analysis of epigenomics and transcriptomics data. Genome Biol. 2015;16:158. doi: 10.1186/s13059-015-0720-3. [DOI] [PMC free article] [PubMed] [Google Scholar]
- 26.Love MI, Huber W, Anders S. Moderated estimation of fold change and dispersion for RNA-seq data with DESeq2. Genome Biol. 2014;15:550. doi: 10.1186/s13059-014-0550-8. [DOI] [PMC free article] [PubMed] [Google Scholar]
- 27.Subramanian A, Tamayo P, Mootha VK, Mukherjee S, Ebert BL, Gillette MA, Paulovich A, Pomeroy SL, Golub TR, Lander ES, Mesirov JP. Gene set enrichment analysis: a knowledge-based approach for interpreting genome-wide expression profiles. Proceedings of the National Academy of Sciences of the United States of America. 2005;102:15545–50. doi: 10.1073/pnas.0506580102. [DOI] [PMC free article] [PubMed] [Google Scholar]
- 28.Mootha VK, Lindgren CM, Eriksson KF, Subramanian A, Sihag S, Lehar J, Puigserver P, Carlsson E, Ridderstrale M, Laurila E, Houstis N, Daly MJ, Patterson N, Mesirov JP, Golub TR, Tamayo P, Spiegelman B, Lander ES, Hirschhorn JN, Altshuler D, Groop LC. PGC-1alpha-responsive genes involved in oxidative phosphorylation are coordinately downregulated in human diabetes. Nature genetics. 2003;34:267–73. doi: 10.1038/ng1180. [DOI] [PubMed] [Google Scholar]
- 29.Heinz S, Romanoski CE, Benner C, Allison KA, Kaikkonen MU, Orozco LD, Glass CK. Effect of natural genetic variation on enhancer selection and function. Nature. 2013;503:487–92. doi: 10.1038/nature12615. [DOI] [PMC free article] [PubMed] [Google Scholar]
- 30.Esnault S, Shen ZJ, Malter JS. Protein Translation and Signaling in Human Eosinophils. Front Med (Lausanne) 2017;4:150. doi: 10.3389/fmed.2017.00150. [DOI] [PMC free article] [PubMed] [Google Scholar]
- 31.Esnault S, Kelly EA, Shen ZJ, Johansson MW, Malter JS, Jarjour NN. IL-3 Maintains Activation of the p90S6K/RPS6 Pathway and Increases Translation in Human Eosinophils. J Immunol. 2015;195:2529–39. doi: 10.4049/jimmunol.1500871. [DOI] [PMC free article] [PubMed] [Google Scholar]
- 32.Lee JJ, Jacobsen EA, Ochkur SI, McGarry MP, Condjella RM, Doyle AD, Luo H, Zellner KR, Protheroe CA, Willetts L, Lesuer WE, Colbert DC, Helmers RA, Lacy P, Moqbel R, Lee NA. Human versus mouse eosinophils: “that which we call an eosinophil, by any other name would stain as red”. The Journal of allergy and clinical immunology. 2012;130:572–84. doi: 10.1016/j.jaci.2012.07.025. [DOI] [PMC free article] [PubMed] [Google Scholar]
- 33.Shen ZJ, Hu J, Esnault S, Dozmorov I, Malter JS. RNA Seq profiling reveals a novel expression pattern of TGF-beta target genes in human blood eosinophils. Immunology letters. 2015;167:1–10. doi: 10.1016/j.imlet.2015.06.012. [DOI] [PMC free article] [PubMed] [Google Scholar]
- 34.Sellers RS, Clifford CB, Treuting PM, Brayton C. Immunological variation between inbred laboratory mouse strains: points to consider in phenotyping genetically immunomodified mice. Vet Pathol. 2012;49:32–43. doi: 10.1177/0300985811429314. [DOI] [PubMed] [Google Scholar]
- 35.Arumugam M, Ahrens R, Osterfeld H, Kottyan LC, Shang X, Maclennan JA, Zimmermann N, Zheng Y, Finkelman FD, Hogan SP. Increased susceptibility of 129SvEvBrd mice to IgE-Mast cell mediated anaphylaxis. BMC immunology. 2011;12:14. doi: 10.1186/1471-2172-12-14. [DOI] [PMC free article] [PubMed] [Google Scholar]
- 36.Smit JJ, Willemsen K, Hassing I, Fiechter D, Storm G, van Bloois L, Leusen JH, Pennings M, Zaiss D, Pieters RH. Contribution of classic and alternative effector pathways in peanut-induced anaphylactic responses. PloS one. 2011;6:e28917. doi: 10.1371/journal.pone.0028917. [DOI] [PMC free article] [PubMed] [Google Scholar]
- 37.Clark GJ, Ju X, Tate C, Hart DN. The CD300 family of molecules are evolutionarily significant regulators of leukocyte functions. Trends Immunol. 2009;30:209–17. doi: 10.1016/j.it.2009.02.003. [DOI] [PubMed] [Google Scholar]
- 38.Shik D, Munitz A. Regulation of allergic inflammatory responses by inhibitory receptors. Clinical and experimental allergy : journal of the British Society for Allergy and Clinical Immunology. 2010;40:700–9. doi: 10.1111/j.1365-2222.2010.03501.x. [DOI] [PubMed] [Google Scholar]
- 39.Moshkovits I, Reichman H, Karo-Atar D, Rozenberg P, Zigmond E, Haberman Y, Ben Baruch-Morgenstern N, Lampinen M, Carlson M, Itan M, Denson LA, Varol C, Munitz A. A key requirement for CD300f in innate immune responses of eosinophils in colitis. Mucosal immunology. 2017;10:172–183. doi: 10.1038/mi.2016.37. [DOI] [PubMed] [Google Scholar]
- 40.Rozenberg P, Reichman H, Moshkovits I, Munitz A. CD300 family receptors regulate eosinophil survival, chemotaxis, and effector functions. J Leukoc Biol. 2017 doi: 10.1002/JLB.2MR1117-433R. [DOI] [PubMed] [Google Scholar]
- 41.Schollaert KL, Stephens MR, Gray JK, Fulkerson PC. Generation of eosinophils from cryopreserved murine bone marrow cells. PloS one. 2014;9:e116141. doi: 10.1371/journal.pone.0116141. [DOI] [PMC free article] [PubMed] [Google Scholar]
- 42.Melo RC, Weller PF. Unraveling the complexity of lipid body organelles in human eosinophils. J Leukoc Biol. 2014;96:703–12. doi: 10.1189/jlb.3RU0214-110R. [DOI] [PMC free article] [PubMed] [Google Scholar]
- 43.Panopoulos AD, Watowich SS. Granulocyte colony-stimulating factor: molecular mechanisms of action during steady state and ‘emergency’ hematopoiesis. Cytokine. 2008;42:277–88. doi: 10.1016/j.cyto.2008.03.002. [DOI] [PMC free article] [PubMed] [Google Scholar]
- 44.Gosselin D, Link VM, Romanoski CE, Fonseca GJ, Eichenfield DZ, Spann NJ, Stender JD, Chun HB, Garner H, Geissmann F, Glass CK. Environment drives selection and function of enhancers controlling tissue-specific macrophage identities. Cell. 2014;159:1327–40. doi: 10.1016/j.cell.2014.11.023. [DOI] [PMC free article] [PubMed] [Google Scholar]
- 45.Fonseca GJ, Seidman JS, Glass CK. Genome-Wide Approaches to Defining Macrophage Identity and Function. Microbiol Spectr. 2016;4 doi: 10.1128/microbiolspec.MCHD-0039-2016. [DOI] [PMC free article] [PubMed] [Google Scholar]
- 46.Mosher DF, Wilkerson EM, Turton KB, Hebert AS, Coon JJ. Proteomics of Eosinophil Activation. Front Med (Lausanne) 2017;4:159. doi: 10.3389/fmed.2017.00159. [DOI] [PMC free article] [PubMed] [Google Scholar]
Associated Data
This section collects any data citations, data availability statements, or supplementary materials included in this article.