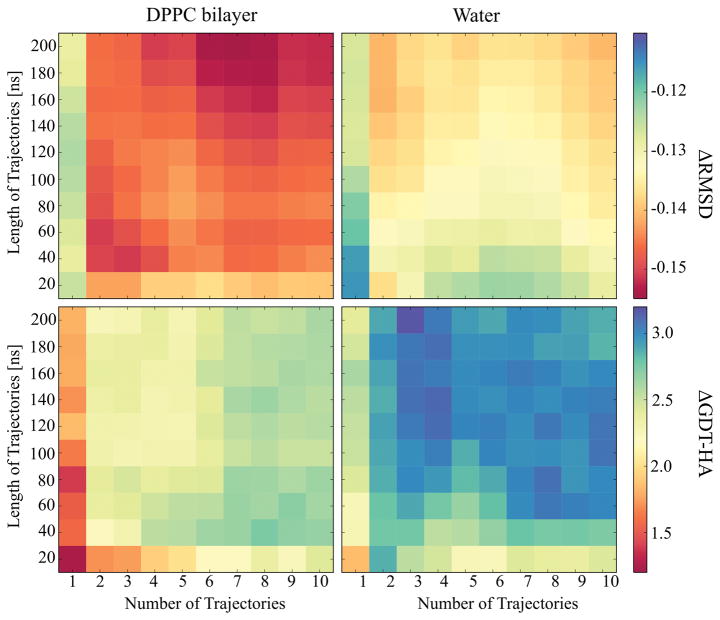
Figure 4.
Average ΔRMSD (top) and ΔGDT-HA (bottom) values plotted over the simulation time against the number of trajectories for the simulations in DPPC lipid bilayer (left) and in water (right). The RMSD and GDT-HA values were calculated for the final structures using RWplus score for the structure selection and averaged over the proteins.

