Abstract
Structural differences in pathological and functional amyloid fibrils have been investigated by Raman microspectroscopy. Second-derivative analyses of amide-I and amide-III bands distinguish parallel in-register β-sheets from a β-solenoid. Further, spatially resolved Raman spectra reveal molecular heterogeneity in amyloid structures.
Amyloid fibrils are most commonly associated with neurodegenerative disorders, like Alzheimer’s and Parkinson’s diseases.1 However, many recent examples have demonstrated amyloid fibrils can also play functional roles in nature,2 like in melanin synthesis in humans or heterokaryon compatibility in fungi.3 Consequently, there is great interest in developing experimental methods to delineate structural details that determine the consequences of amyloid formation.
Whether pathological or functional, amyloid fibrils are characterized by several general properties,1 such as exhibiting green birefringence and enhanced emission when bound to Congo red or Thioflavin T (ThT), respectively. At a molecular level, amyloid fibrils are defined by a cross-β architecture: β-strands aligned perpendicular to the fibril axis, stabilized by hydrogen bonds between β-strands parallel to the fibril axis. The most common structural motif for pathological amyloids is known as parallel in-register, in which the same amino acids of individual polypeptides align on top of one another, as is the case for amyloid-β (Aβ) and α-synuclein (α-syn).1 Another well characterized structure is the β-solenoid, formed by stacks of β-strand-turn-β-strand segments, adopted by the Het-s prion domain.4 While maintaining parallel β-sheets, a β-solenoid differs by the presence of intramolecular backbone hydrogen bonds. When imaged by transmission electron microscopy (TEM), amyloid fibrils appear as long, unbranched, nanometer-scaled filaments (Figure 1). On the macroscopic scale, amyloid fibrils are insoluble, noncrystalline, and often polymorphic. To date only a limited number of amyloid fibril structures have been solved4–5 and new approaches are needed for facile detection of structural details important in amyloid function and pathology.
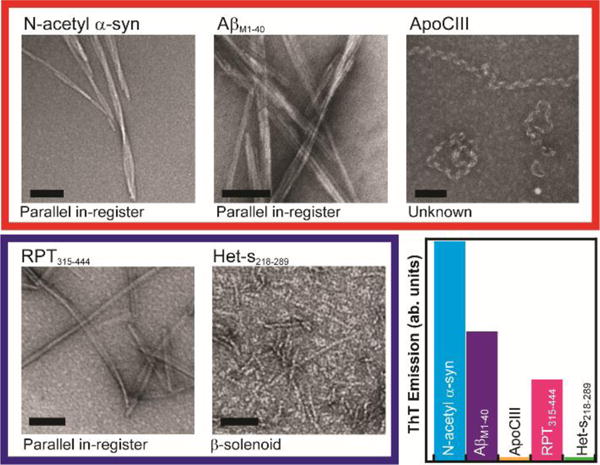
Figure 1. Summary of amyloids.

Representative negatively-stained TEM images of pathological (top row, outlined in red) and functional (bottom row, outlined in blue) amyloids. Current amyloid structure based on literature as indicated.4, 10, 12, 13 Scale bars: 100 nm. ThT emission assay (integrated intensity from 450 nm to 550 nm) comparing amyloids ([final protein] = 5 μM, [ThT] = 10 μM).
Towards that goal, we recently demonstrated that Raman spectroscopy can reveal structural differences in α-syn fibrils formed in solution conditions mimicking different cellular compartments as well as in disease-related mutant fibrils.6 Here, we have now coupled the Raman spectroscopic method with an inverted microscope, allowing structural details and molecular-level heterogeneity within macroscopic amyloid aggregates to be spatially resolved. Importantly, for the first time we directly compare intrinsic vibrations in pathological versus functional amyloids, further developing our understanding of structural features that define these two amyloid classes.
Specifically, we investigated three pathological and two functional amyloids (Figure 1). For pathological amyloids, we chose to study (1) N-terminal acetylated α-syn (N-acetyl α-syn), which is implicated in Parkinson’s disease7 and the focus of much of our research, (2) amyloid βM1-40 (AβM1-40), a peptide important in the development of Alzheimer’s disease and one of the best characterized amyloids to date,8 and (3) apolipoprotein C-III (ApoCIII), an apolipoprotein linked to cardiovascular disease.9 While previous studies have shown fibrillar α-syn and AβM1–40 form parallel in-register β-sheets,10 there is no reported high-resolution structure of ApoCIII amyloid, which has an atypical ribbonlike morphology,11 in contrast to the other straight filaments. We also studied two functional amyloids: (1) the repeat domain (residues 315–444, RPT315–444) of Pmel17, which is important in melanin biosynthesis and suggested to also form parallel in-register β-sheet12 fibrils that are highly pH-dependent and reversible13 and (2) the prion-domain (residues 218–289) of the fungal protein Het-s (Het-s218–289), which forms a well-defined and highly uniform β-solenoid conformation.4,14 Importantly, as spontaneous Raman spectra have never been collected for ApoCIII or RPT315-444, our work expands the use of vibrational spectroscopy for amyloid characterization.
To form amyloids, solutions of N-acetyl α-syn, AβM1-40, ApoCIII, RPT315–444, and Het-s218–289 were each incubated at 37 °C under various buffer conditions (see Methods in ESI). Figure 1 shows representative negatively-stained TEM images of the five amyloids studied. Straight, unbranching filamentous structures can be seen for all amyloids, except for ApoCIII, which are helically-twisted and ribbonlike.11 Figure 1 also shows enhanced ThT emission data of the aggregated samples, a positive indicator of amyloid formation, though different relative intensities were measured.
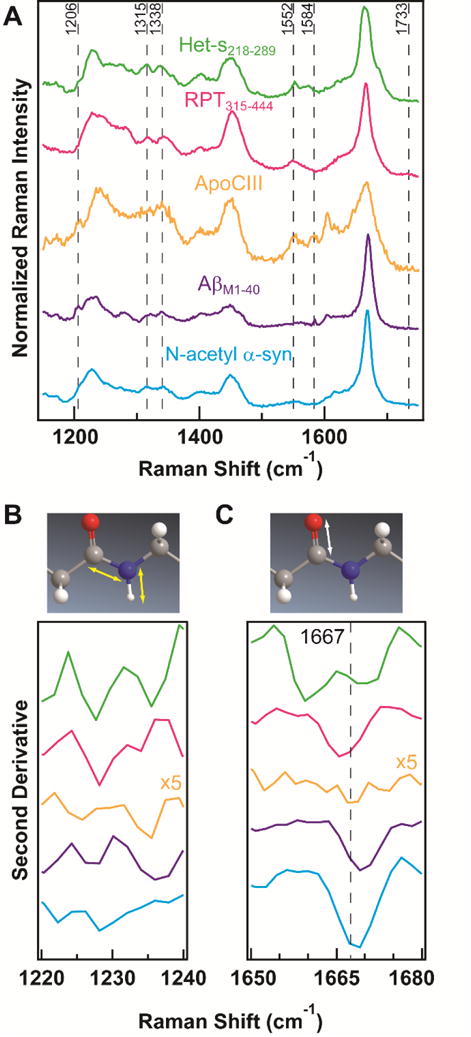
In Raman spectroscopy, the positions and widths of the amide-III and amide-I bands between 1200–1300 and 1650–1700 cm−1, respectively, are dependent on peptide backbone conformations. Upon amyloid formation, the conformational change from soluble, disordered protein to insoluble, β-sheet-rich amyloid can be observed as a shift of the amide-III band to lower energies and a narrowing of the amide-I band (Figure S1).15 Raman spectra in Figure 2A show distinct spectral profiles for each amyloid and second-derivative analysis of the amide-III (Figure 2B) and amide-I (Figure 2C) bands indicates spectral components and reveals structural differences.16
Figure 2. Raman spectra of amyloids.

(A) Fingerprint region of Raman spectra. Spectra were collected at RT and have been normalized to the respective amide-I band maximum. Second-derivative analysis of (B) amide-III and (C) amide-I regions, with respective molecular vibrations of the peptide backbone shown above. Spectra are color-coded as in (A). ApoCIII second derivative intensities have been multiplied by 5 for clarity. Dashed line in (C) indicates reported literature value for β-sheet conformation.17
From the second-derivative spectra, we see that the two amyloids associated with neurodegeneration, N-acetyl α-syn and AβM1–40, are strikingly similar with peak minima near 1669 cm−1. However, the amide-III regions of N-acetyl α-syn and AβM1–40 are distinct, possible reflecting the underlying Greek-key7 and two-fold rotational symmetric β-hairpin13 structures, respectively. We also observe from the second-derivative spectra that RPT315-444 has an amide-I band shifted 4 cm−1 to lower energy from N-acetyl α-syn and AβM1–40. While N-acetyl α-syn, AβM1–40, and RPT315–444 are all reported to have parallel in-register molecular structures, this suggests the β-sheet conformation of RPT315–444 is slightly different. This is further supported by the second-derivative of the amide-III, which shows a single minimum near 1228 cm−1 for RPT315–444. In comparison, N-acetyl α-syn and AβM1–40 each have two minima in the amide-III region; each with a minimum near 1228 cm−1 and an additional minimum at lower and higher energies, respectively.
Interestingly, the amide-III and amide-I bands for Het-s218-289 are unique from the four other amyloids studied. Each spectrum shows two minima in its second-derivative, 1228/1236 cm−1 for the amide-III and 1659/1670 cm−1 for the amide-I. These data suggest two distinct configurations and could possibly be reporting on the β-strands and turn regions of a β-solenoid. We also observe very broad second-derivative spectra for ApoCIII, with two shallow minima in the amide-III at 1226 cm−1 and 1236 cm−1 and no obvious minimum in the amide-I. Comparing to the other amyloids in our study, the width of the ApoCIII amide-I band suggests it does not adopt a solely parallel in-register or β-solenoid conformation. Additionally, the width of this band may suggest ApoCIII contains more α-helical character than the other amyloids studied here. Interestingly, circular dichroism spectrum of ApoCIII amyloid exhibits typical β-sheet structure with no indication of α-helical content.11
Another strength of Raman spectroscopy is the abundance of structural details found in the “fingerprint” region of the vibrational spectrum (generally considered to be between 500–1500 cm−1).15b In Figure 2A, several strong peaks due to aromatic sidechains are observed. For AβM1–40 and ApoCIII, peaks at 1206 cm−1 can be assigned to the aromatic rings of phenylalanine (Phe) or tyrosine (Tyr).17 In this spectral region, N-acetyl α-syn and Het-s218–289 show small shoulders, while RPT315–444, which has no Phe or Tyr, shows no discernible peak. Strong peak intensities for tryptophan (Trp) can be observed near 1552 cm−1 for ApoCIII, RPT315–444, and Het-s218–289.15a No peaks, however, are observed for N-acetyl α-syn or AβM1–40, which do not contain Trp residues in their sequences. Additionally, a Phe peak is observed at 1584 cm−1 for Aβ M1–40 and ApoCIII that is absent in the other amyloids studied. Because aromatic sidechains are relatively rare in protein sequences and their vibrational modes are sensitive to solvent,18 these peaks could serve to identify proteins, as well as offer site-specific environmental information.
The spectral region between 1300–1500 cm−1 reveals further details of sidechain vibrations. The C–H deformation frequencies of the sidechains show two similar bands at 1315 and 1338 cm−1 across most of the amyloids studied, with some small differences in peak intensities ratios. ApoCIII, however, shows only a broad band at 1338 cm−1. These differences in sidechain vibrations may offer insights into inter-filament interactions. We also observe a broad peak centered at 1733 cm−1 for RPT315–444 (for expanded view see Figure S2), which suggests protonated glutamic acids, a known requirement for RPT315–444 fibril formation.19 Collectively, these data demonstrate the sensitivity of Raman spectroscopy for resolving site-specific details of polypeptide structures.
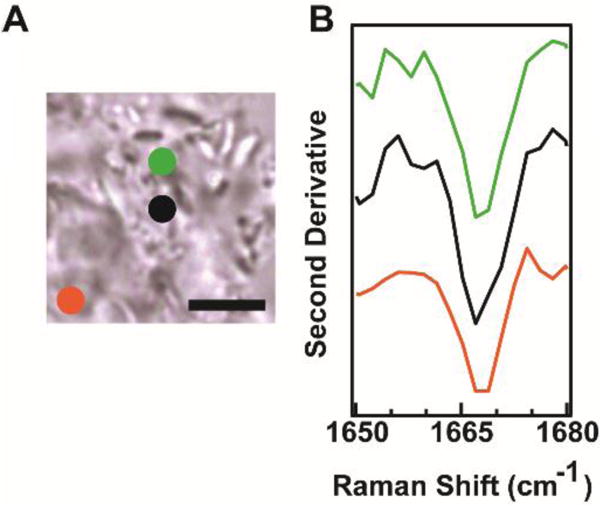
Next, Raman microspectroscopy was used to spatially resolve Raman spectra for N-acetyl α-syn fibrils formed under acidic conditions. Figure 3A shows a bright-field image of aggregated N-acetyl α-syn with the spatial locations of three collected Raman spectra indicated by colored circles. Second-derivative analysis of the amide-I band shows relatively similar spectral profiles, suggesting uniform secondary structure across the sample. This consistency in the amide-I band agrees with previous Raman measurements of non-acetylated α-syn fibrils formed at pH 5.6
Figure 3. Spatially-resolved Raman spectra of N-acetyl α-syn.

(A) Bright-field image of N-acetyl α-syn amyloid aggregates. Scale bar: 5 μm. (B) Second-derivative analysis at spatial locations indicated by colored circles in (A).
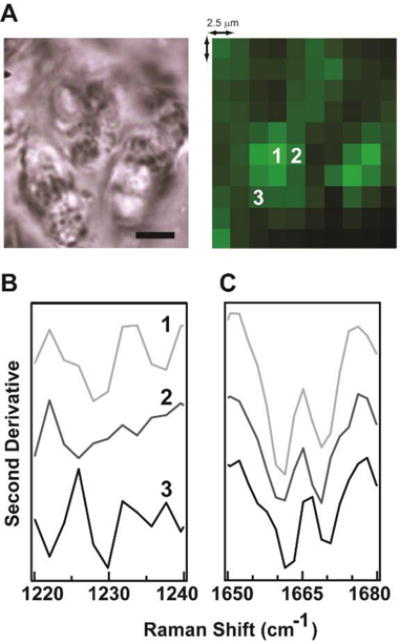
Figure 4A shows a bright-field image of fibrillar Het-s218–289, where insoluble aggregates appear relatively homogenous at the macroscopic scale (scale bar is 5 μm). When considered at the molecular-level of vibrations, however, heterogeneity in the amyloid aggregate can be observed. This is highlighted in the intensity differences in the corresponding Raman map of Het-s218-289 shown to the right of the bright-field image. In the Raman map, the intensity of each 2.5 μm2 pixel reflects the integrated intensity of the amide-I peak from 1650–1680 cm−1. Second-derivative analysis of the amide-III and amide-I regions was done for three spatially-resolved spectra, as indicated by the numbers on the Raman map. This analysis is shown in Figures 4B and 4C, respectively, and shows the vibrational spectra of Het-s218–289 vary spatially across the sample. Interestingly, there is a unique amide-III profile for each location, indicating a variation in the C–N stretch/N–H bend modes across the sample. The peak positions of the amide-I region appear relatively unchanged in the three spectra, but peak intensity ratios do differ as a function of position. Because Het-s218–289 is known to form a single, highly uniform structure,4 we hypothesize our mapping results are reporting on the unique molecular environment, such as hydration or intermolecular interactions, of the amide-III and amide-I bonds. However, more detailed study is needed to understand these results.
Figure 4. Raman mapping of Het-s218–289.

(A) Bright-field image (left) and Raman map (right) of Het-s218-289 amyloid aggregates. Map intensity corresponds to integrated intensity of amide-I (1650– 1680 cm−1). Scale bar: 5 μm. Second-derivative analysis of (B) amide-III and (C) amide-I regions at spatial positions indicated in Raman map. Original spectra shown in Figure S3.
In summary, we have utilized Raman microspectroscopy to directly compare vibrational signatures of functional and pathological amyloids for the first time. It is hypothesized that structural differences play an important role in determining whether an amyloid structure is beneficial or detrimental. By vibrationally “fingerprinting” a series of amyloids, we are able to discern distinct structural conformations, like parallel in-register versus β-solenoid, with a level of detail not yet achieved in Raman spectroscopy. Further, we show the amide-III band, is highly sensitive to amyloid structural differences and provides a useful probe of amyloid fibrils. Our results highlight the broad applicability of Raman microspectroscopy for spatially resolving structural details of amyloid aggregates and serve as the groundwork for future in vivo amyloid studies.
Supplementary Material
Acknowledgments
This work was supported by the Intramural Research Program at the NIH, NHLBI. Parts of this research was performed on instruments maintained by the NHLBI Electron Microscopy (TEM) and Biochemistry (LC-MS) Core Facilities. We thank E. O’Leary, Z. Jiang, C. Brisbios, and R. Wickner for use of purified N-acetyl α-syn, RPT315-444, ApoCIII, and the Het-s218–289 plasmid, respectively.
Footnotes
Electronic Supplementary Information (ESI) available: [details of any supplementary information available should be included here]. See DOI: 10.1039/x0xx00000x
Conflicts of interest
There are no conflicts of interest to declare.
References
- 1.Chiti F, Dobson CM. Annu Rev Biochem. 2006;75:333–366. doi: 10.1146/annurev.biochem.75.101304.123901. [DOI] [PubMed] [Google Scholar]
- 2.Shewmaker F, McGlinchey RP, Wickner RB. J Biol Chem. 2011;286:16533–16540. doi: 10.1074/jbc.R111.227108. [DOI] [PMC free article] [PubMed] [Google Scholar]
- 3.(a) Benkemoun L, Saupe SJ. Fungal Genet Biol. 2006;43:789–803. doi: 10.1016/j.fgb.2006.06.006. [DOI] [PubMed] [Google Scholar]; (b) Theos AC, Truschel ST, Raposo G, Marks MS. Pigment Cell Res. 2005;18:322–336. doi: 10.1111/j.1600-0749.2005.00269.x. [DOI] [PMC free article] [PubMed] [Google Scholar]
- 4.Wasmer C, Lange A, Van Melckebeke H, Siemer AB, Riek R, Meier BH. Science. 2008;319:1523–1526. doi: 10.1126/science.1151839. [DOI] [PubMed] [Google Scholar]
- 5.(a) Petkova AT, Yau WM, Tycko R. Biochemistry. 2006;45:498–512. doi: 10.1021/bi051952q. [DOI] [PMC free article] [PubMed] [Google Scholar]; (b) Tuttle MD, Comellas G, Nieuwkoop AJ, Covell DJ, Berthold DA, Kloepper KD, Courtney JM, Kim JK, Barclay AM, Kendall A, Wan W, Stubbs G, Schwieters CD, Lee VM, George JM, Rienstra CM. Nat Struct Mol Biol. 2016;23:409–415. doi: 10.1038/nsmb.3194. [DOI] [PMC free article] [PubMed] [Google Scholar]; (c) Colvin MT, Silvers R, Ni QZ, Can TV, Sergeyev I, Rosay M, Donovan KJ, Michael B, Wall J, Linse S, Griffin RG. J Am Chem Soc. 2016;138:9663–9674. doi: 10.1021/jacs.6b05129. [DOI] [PMC free article] [PubMed] [Google Scholar]; (d) Wälti MA, Ravotti F, Arai H, Glabe CG, Wall JS, Böckmann A, Güntert P, Meier BH, Riek R. Proc Natl Acad Sci USA. 2016;113:E4976–E4984. doi: 10.1073/pnas.1600749113. [DOI] [PMC free article] [PubMed] [Google Scholar]; (e) Gremer L, Schölzel D, Schenk C, Reinartz E, Labahn J, Ravelli RBG, Tusche M, Lopez-Iglesias C, Hoyer W, Heise H, Willbold D, Schröder GF. Science. 2017;358:116–119. doi: 10.1126/science.aao2825. [DOI] [PMC free article] [PubMed] [Google Scholar]
- 6.Flynn JD, McGlinchey RP, Walker RL, III, Lee JC. J Biol Chem. 2018;293:767–776. doi: 10.1074/jbc.M117.812388. [DOI] [PMC free article] [PubMed] [Google Scholar]
- 7.Anderson JP, Walker DE, Goldstein JM, de Laat R, Banducci K, Caccavello RJ, Barbour R, Huang J, Kling K, Lee M, Diep L, Keim PS, Shen X, Chataway T, Schlossmacher MG, Seubert P, Schenk D, Sinha S, Gai WP, Chilcote TJ. J Biol Chem. 2006;281:29739–29752. doi: 10.1074/jbc.M600933200. [DOI] [PubMed] [Google Scholar]
- 8.(a) Walsh DM, Thulin E, Minogue AM, Gustavsson N, Pang E, Teplow DB, Linse S. FEBS J. 2009;276:1266–1281. doi: 10.1111/j.1742-4658.2008.06862.x. [DOI] [PMC free article] [PubMed] [Google Scholar]; (b) Petkova AT, Leapman RD, Guo ZH, Yau WM, Mattson MP, Tycko R. Science. 2005;307:262–265. doi: 10.1126/science.1105850. [DOI] [PubMed] [Google Scholar]
- 9.(a) Ooi EMM, Barrett PHR, Chan DC, Watts GF. Clin Sci. 2008;114:611–624. doi: 10.1042/CS20070308. [DOI] [PubMed] [Google Scholar]; (b) Pollin TI, Damcott CM, Shen H, Ott SH, Shelton J, Horenstein RB, Post W, McLenithan JC, Bielak LF, Peyser PA, Mitchell BD, Miller M, O’Connell JR, Shuldiner AR. Science. 2008;322:1702–1705. doi: 10.1126/science.1161524. [DOI] [PMC free article] [PubMed] [Google Scholar]
- 10.(a) Chen M, Margittai M, Chen J, Langen R. J Biol Chem. 2007;282:24970–24979. doi: 10.1074/jbc.M700368200. [DOI] [PubMed] [Google Scholar]; (b) Silvers R, Colvin MT, Frederick KK, Jacavone AC, Lindquist S, Linse S, Griffin RG. Biochemistry. 2017;56:4850–4859. doi: 10.1021/acs.biochem.7b00729. [DOI] [PMC free article] [PubMed] [Google Scholar]
- 11.de Messieres M, Huang RK, He Y, Lee JC. Biochemistry. 2014;53:3261–3263. doi: 10.1021/bi500502d. [DOI] [PMC free article] [PubMed] [Google Scholar]
- 12.McGlinchey RP, Shewmaker F, Hu KN, McPhie P, Tycko R, Wickner RB. J Biol Chem. 2011;286:8385–8393. doi: 10.1074/jbc.M110.197152. [DOI] [PMC free article] [PubMed] [Google Scholar]
- 13.McGlinchey RP, Shewmaker F, McPhie P, Monterroso B, Thurber K, Wickner RB. Proc Natl Acad Sci USA. 2009;106:13731–13736. doi: 10.1073/pnas.0906509106. [DOI] [PMC free article] [PubMed] [Google Scholar]
- 14.Balguerie A, Dos Reis S, Ritter C, Chaignepain S, Coulary-Salin B, Forge V, Bathany K, Lascu I, Schmitter JM, Riek R, Saupe SJ. EMBO J. 2003;22:2071–2081. doi: 10.1093/emboj/cdg213. [DOI] [PMC free article] [PubMed] [Google Scholar]
- 15.(a) Movasaghi Z, Rehman S, Rehman IU. App Spectr Rev. 2007;42:493–541. [Google Scholar]; (b) Rygula A, Majzner K, Marzec KM, Kaczor A, Pilarczyk M, Baranska M. J Raman Spectrosc. 2013;44:1061–1076. [Google Scholar]; (c) Kurouski D, Van Duyne RP, Lednev IK. Analyst. 2015;140:4967–4980. doi: 10.1039/c5an00342c. [DOI] [PubMed] [Google Scholar]
- 16.(a) Balestrieri C, Colonna G, Giovane A, Irace G, Servillo L. Eur J Biochem. 1978;90:433–440. doi: 10.1111/j.1432-1033.1978.tb12622.x. [DOI] [PubMed] [Google Scholar]; (b) Heino S, Byler DM. Biochem Biophys Res Commun. 1983;115:391–397. doi: 10.1016/0006-291x(83)91016-1. [DOI] [PubMed] [Google Scholar]
- 17.Dong J, Atwood CS, Anderson VE, Siedlak SL, Smith MA, Perry G, Carey PR. Biochemistry. 2003;42:2768–2773. doi: 10.1021/bi0272151. [DOI] [PubMed] [Google Scholar]
- 18.Takeuchi H. Biopolymers. 2003;72:305–317. doi: 10.1002/bip.10440. [DOI] [PubMed] [Google Scholar]
- 19.McGlinchey RP, Jiang Z, Lee JC. Chembiochem. 2014;15:1569–1572. doi: 10.1002/cbic.201402074. [DOI] [PMC free article] [PubMed] [Google Scholar]
Associated Data
This section collects any data citations, data availability statements, or supplementary materials included in this article.


