

Summary
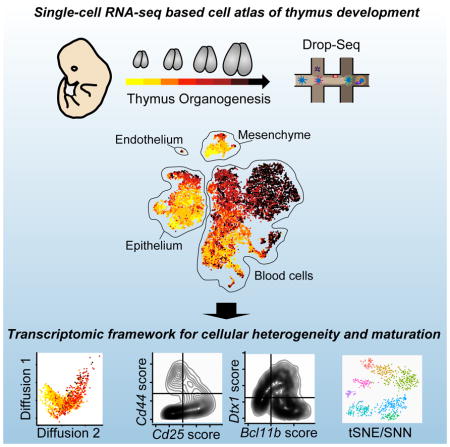
Thymus development is critical to the adaptive immune system, yet a comprehensive transcriptional framework capturing thymus organogenesis at single cell resolution is still needed. We applied single-cell RNA-seq to capture eight days of thymus development, perturbations of T-cell receptor rearrangement, and in vitro organ cultures, producing profiles of 24,279 cells. We resolved transcriptional heterogeneity of developing lymphocytes, and genetic perturbation confirmed T cell identity of conventional and non-conventional lymphocytes. We characterized maturation dynamics of thymic epithelial cells in vivo, classified cell maturation state in a thymic organ culture, and revealed the intrinsic capacity of thymic epithelium to preserve transcriptional regularity despite exposure to exogenous retinoic acid. Finally, by integrating the cell atlas with human GWAS data and autoimmune disease-related genes, we implicated embryonic thymus resident cells as possible participants in autoimmune disease etiologies. This resource provides a single-cell transcriptional framework for biological discovery and molecular analysis of thymus organogenesis.
Graphical Abstract
Introduction
The thymus, a primary lymphoid organ, is critical for establishing a self-tolerant and functional adaptive immune system (Gruver and Sempowski, 2008; Kyewski and Derbinski, 2004; Markert et al., 2009). Close interaction of developing thymocytes with thymus resident epithelial and blood cells provide the proper environment for lineage induction and thymocyte selection (Hogquist et al., 2005). In turn, developing thymocytes provide crucial signals for developing epithelial cells (Marrella et al., 2014). Currently, the molecular framework and transcriptional dynamics underlying thymus development remain poorly understood.
Single-cell RNA (scRNA)-seq allows for transcriptome-wide characterization of complex cell populations and has been applied to organs such as intestine (Grun et al., 2015; Haber et al., 2017), brain (Zeisel et al., 2015), spleen (Jaitin et al., 2014), and pancreas (Baron et al., 2016; Muraro et al., 2016). In addition, scRNA-seq approaches have profiled developmental processes in early mesoderm (Scialdone et al., 2016), epidermis and hair follicle (Joost et al., 2016), and heart tissue (DeLaughter et al., 2016). Despite the utility of this technology in profiling heterogeneous tissues and developmental dynamics, it has only been applied to flow cytometry-sorted populations in the adult thymus (Brennecke et al., 2015; Meredith et al., 2015; Miragaia et al., 2018), thereby limiting resolution of the cellular heterogeneity present during thymus development.
Here, we have applied Drop-seq, a high-throughput, droplet-based scRNA-seq technology (Macosko et al., 2015), to profile thymi over eight days spanning from early thymus organogenesis until birth. Since thymus development depends on interactions of various thymus-resident cells, we captured cells from the whole organ in each sample. In addition, we applied genetic and small-molecule perturbations, leveraging the cell atlas as a blueprint for detecting their cellular and molecular consequences. In total, we profiled 24,279 cells.
We defined cellular heterogeneity and transcriptomic dynamics during thymus organogenesis, capturing conventional thymocyte development. We also detected a variety of non-conventional lymphoid cells (NCLs), some of which have not been appreciated on the single cell and molecular level before. To confirm scRNA-seq based predictions about which NCLs are T cells, we determined which NCL populations were affected by T cell receptor (TCR) rearrangement. We also characterized thymic epithelial cell (TEC) diversity, determining subtypes and subset-specific surface molecules. Lastly, we demonstrated the utility of the atlas, characterizing an in vitro thymic organ culture assay and determining effects of exogenous retinoic acid treatment on in vitro thymus organogenesis.
The thymic cell atlas provides a molecular blueprint of thymus organogenesis at single cell resolution, revealing transcriptional dynamics and establishing persistence of cellular heterogeneity despite ex vivo culture and perturbation.
Results
Machine learning and single-cell RNA sequencing resolve major thymic cell types, including blood cells, mesenchyme, endothelium, and thymic epithelium
In order to capture early stages of thymus development, we sampled thymic lobes beginning at E12.5, when the thymic primordium has detached from the pharynx and surface ectoderm (Gordon and Manley, 2011). We sampled each day until birth, for eight time points. This time window captured the earliest wave of T cell development, from thymic seeding of T cell precursors to initial generation of CD4-positive and CD8-positive cells (Ramond et al., 2014; Xiao et al., 2003), as well as maturation of thymic stromal cells (Baik et al., 2013; Ohigashi et al., 2016).
To aid with mechanical isolation of the thymus at E12.5, we used a B6/Pax9VENUS reporter mouse line that demarcated pharyngeal and thymic epithelial cells (Kearns et al., 2013) (Fig. S1A, B). For experimental time points E13.5 to immediately postnatal (P0), wild-type (WT) C57BL/6J mice were used. To avoid biased enrichment of specific thymic subpopulations, Drop-seq was performed on all live thymic cells (Fig. 1A). Replicates were highly reproducible for each time point, and median sequencing depths by replicate ranged from 2,487 to 6,784 transcripts per cell (Fig. S1C–E; Pearson correlations ≥ 0.97). After quality control steps (Fig. S1FG; methods), the initial thymus atlas offers transcriptomic profiles of 15,292 cells.
Figure 1.

Transcriptomic diversity in the thymus is driven by cell identity and maturation. (A) Schematic of procedures for extraction, sequencing, and single-cell analysis of the thymus. (B, C) Two-dimensional representation of cells via tSNE, colored by developmental day (B) and cluster identity (C); each dot represents one cell. tSNE was performed after quality control and cell cycle correction (methods). (D) Row-standardized heatmap of hand-curated and data-driven marker genes for each cluster. Expression is measured in units of log2 (1 + transcripts per 10,000). Each row has mean zero and standard deviation one. Clusters are ordered by Seurat dendrogram fitted to cluster means. (E) DEPICT-based intersection of cluster-specific gene expression and GWAS studies. Data include n=3 biological replicates at each of E12.5, E13.5 and E16.5 and n=2 biological replicates at each of E14.5, E15.5, E17.5, and E18.5. Data from P0 consist of two technical replicates (two lobes from a single thymus, processed separately following dissection). The number of independent experiments performed was: 1 for each of days E15.5, E17.5, E18.5, and P0; 2 at each of days E13.5, E14.5, and E16.5; and 3 at E12.5. See also Figures S1 and S2.
To determine the major sources of cellular heterogeneity during thymus organogenesis, we employed unsupervised machine learning, including feature selection, principal components analysis (PCA), and t-stochastic neighbor embedding (tSNE,(Maaten and Hinton, 2008)). tSNE stratifies cells by tissue type and embryonic day (Fig. 1B), and graph clustering based on a Louvain algorithm variant (Waltman and van Eck, 2013) yielded 10 clusters largely concordant with the tSNE (Fig. 1C). To label the clusters, we assembled comprehensive marker gene lists (Fig. 1D top panel, Fig. S2A, and Table S1), and we displayed known cell type-specific transcripts (Fig. 1D bottom panel, Fig. S2B).
Marker gene lists revealed unifying expression patterns shared within each of two “superclusters” prefixed by BLD (for blood cell containing) and TEC (for thymic epithelial cell containing). The BLD supercluster captured developing thymocytes (BLD1–3), myeloid cells (BLD4) and non-conventional lymphocytes (NCL) such as NK cells, innate lymphoid cells (ILC’s), and γδ T cells (enriched in BLD5, see below). The BLD supercluster was enriched in gene sets linked to T cell receptor signaling, the immune system, and natural killer cell-mediated toxicity (Fig S2A). Within the supercluster, each cluster had distinct gene set enrichment (e.g. BLD1: hematopoietic stem cell differentiation; BLD2: Notch1 signaling; BLD3: T cell differentiation; BLD4: innate immune system; BLD5: NK cell-mediated cytotoxicity). Individual genes paralleled this trend, with Ptprc (Cd45) uniformly expressed and others confined to subsets (Fig S2B). For instance, macrophage marker Lyz2 and dendritic cell marker Itgax were expressed in BLD4. T cell marker Myb was mostly confined to BLD1–3, with Ptcra in BLD2–3 and Cd3e in BLD3 alone. Some T cell markers appeared in BLD5, but innate lymphoid markers Zbtb16 and Klrd1 were also expressed.
TEC clusters exhibited shared gene set enrichment for regulation of organ morphogenesis and cell junction organization, while subcluster-specific gene set enrichments included β1 integrin cell surface interactions (TEC1), epithelial cell differentiation (TEC2), and alternative NF-kappaB pathway (TEC3) (Fig S2A). Together with expression of distinctive genes, including Foxn1, Prss16, Psmb11, and Aire, suggests that TEC1–3 capture the developing thymic epithelium (Fig S2B).
Enrichment in genes associated with angiogenesis and extracellular matrix organization signatures support the presence of endothelial cells (cluster END) and mesenchyme (cluster MES), respectively. Handpicked genes substantiated these conclusions, with MES expressing Col3a1, Pdgfra, and Pdgfrb (Fig. S2B). Cluster END captures cells expressing Egfl7 and Esam in addition to Efnb2 (arterial marker), Nr2f2 (venous marker), and Sox18 (lymphatic vessel marker), suggesting further heterogeneity within (Table S1).
This thymus cell atlas captures cellular heterogeneity within the developing thymus, and assigning each cluster to a known cell type makes this resource accessible for downstream use.
Developing blood subpopulations show enrichment for expression of autoimmune GWAS results
To uncover potential links between the identified cell clusters and human diseases, we employed Data-driven Expression Prioritized Integration for Complex Traits (DEPICT) (Pers et al., 2015) to quantify overlap of candidate loci from 36 genome-wide association studies (GWAS) with expression signatures of cell populations in the developing thymus (Fig. 1E). BLD 4 and 5 exhibited significant enrichment (p < 0.001) in genes located near single nucleotide polymorphisms (SNPs) associated with autoimmune diseases (e.g. inflammatory bowel disease, multiple sclerosis, celiac disease).
Drop-seq data display established features of conventional thymocyte development
To assess how well transcriptome-wide approaches align with existing models of T cell development, we subsetted and reanalyzed the developing thymocytes in overview clusters BLD1–3 (Fig. 2A). To facilitate quantification of rearranged T-cell receptor transcripts, we created a customized reference sequence for T cell receptor alignment, which is available via GEO. Using tSNE and the Louvain algorithm, we found five clusters (Tconv1–5) that correlated strongly with embryonic maturation (Fig. 2B,C and S3A). As detailed below, analysis identified cluster-specific gene signatures known to characterize thymocyte development. Concordant with the literature on the earliest wave of thymic seeding progenitors (TSPs) into the thymus at around e12 (Ramond et al., 2014), expression of Flt3, Kit, and Cd44 was enriched in Tconv1 (Fig. 2D and S3B,C), which contained cells from the earliest embryonic time-points analyzed. Early thymic progenitors are reported to express both myeloid transcripts such as Csf1r and lymphoid transcripts (Luc et al., 2012); consistent with these reports, we noted that Myb was detected in 80% of the 79 Csf1r-expressing cells and Kit in 49%. Along with Cd3 transcripts Bcl11b is upregulated in all clusters but Tconv1, suggesting T cell lineage commitment (Ikawa et al., 2010; Li et al., 2010). Recombination activating complex genes Rag1 and Rag2 are also upregulated in Tconv2 and Tconv3, indicating cells undergoing TCR rearrangement (Oettinger et al., 1990). Transcript associated with TCR expression Lef1, Cd3d, and Cd3e were expressed in Tconv3, Tconv4, and Tconv5. The gap between Tconv3 and Tconv4 may reflect abrupt transcriptional changes due to TCR selection, and a second upregulation of Rag1 and Rag2 in Tconv5 indicates TCR α rearrangement (Wilson et al., 1994). Cd8a, Cd4, TCR α, and TCR chains were expressed in Tconv5 and may mark a population of double-positive thymocytes. Concordant with this, Tconv5 contained primarily cells of later embryonic time points.
Figure 2.

Single-cell data reveal molecular details and subsets of thymocytes. (A) Schematic showing that this figure includes the cells from BLD1-3. (B,C) tSNE colored by developmental day (B) or cluster identity (C); each dot represents one cell. (D) Row-standardized heatmap of genes curated from the literature. Entries display average lognormalized expression. Clusters are ordered manually based on developmental status. (E-G) TACS display of thymocytes showing maturation and Notch signaling preceding linage commitment. Panel (E) shows Il2ra versus Cd44 by cluster. Panel (F) shows Il2ra versus Cd44 by embryonic day with Tconv5 excluded. Panel (G) shows Bcl11b versus Dtx1 by cluster. The number of independent experiments performed was 1 for each day E15.5, E17.5, E18.5, and P0; 2 at each day E13.5, E14.5, and E16.5; and 3 at E12.5. See also Figure S3.
Thymocytes in Tconv2 matured in parallel to Tconv1 and Tconv3, showing correlated increases in embryonic day and expression of Ptcra, Il2ra (Cd25), Rag genes, Notch1, and Bcl11b (Fig. 2B, C and Fig. S3B). Despite this developmental similarity, Tconv2 was distinguished by tSNE, unbiased clustering, and differential expression analysis (Table S2). In Tconv2, TCR transcripts were not detected, but we noted expression of Cd163l1 (Scart1), a molecule previously associated with γδ T cells (Kisielow et al., 2008) (Fig. 2D). The ability to distinguish subpopulations at this early stage speaks to the strength of our unbiased, transcriptome-wide approach.
To resolve expression of classical markers of thymocyte development within clusters, we applied transcript averaged cell scoring (TACS; see method). TACS analysis revealed four cell populations by Cd44 and Il2ra scoring in the Tconv subset (Fig. 2E). The predicted thymocyte progenitor containing cluster Tconv1 was enriched in cells with Cd44hiIl2ralo scores. Both Tconv2 and Tconv3 exhibited cells with Cd44hiIl2rahi as well as Cd44loIl2rahi scores. Tconv4 and Tconv5 were enriched in cells with Cd44loIl2ralo scores. Tconv5 contained more mature thymocytes, with expression of Cd4, Cd8a, and other TCR complex associated transcripts (Fig 2D). After removing Tconv5, Cd44 and Il2ra expression scores resolved the dominance of double-negative (DN) 1 cells at earlier timepoints, while subsequent DN stages emerged over time (Fig. 2F).
T cell development is regulated by Notch signaling and expression of the transcription factor Bcl11b (Li et al., 2010, Radtke et al., 1999). We tested sensitivity of our molecular blueprint to capture such an event. TACS analysis on Bcl11b together with Dtx1 (Fig. 2G), a downstream target of Notch signaling, suggested that Notch signaling is integrated in a proportion of cells in Tconv1 with a low Bcl11b score. Consistent with the presence of more mature thymocytes in clusters Tconv2 and Tconv3, cells have a higher score for both Dtx1 and Bcl11b. As expected, the two clusters that captured the most mature thymocytes in our dataset (Tconv4,5) exhibited a reduced Dtx1 score paired with Bcl11bhi scores.
We conclude that the presented cell atlas captures conventional thymocyte development, and provides molecular detail that distinguishes different thymocyte subsets. Developmentally-relevant signaling pathways and transcripts can be surveyed to gain insights about the dynamics of thymocyte maturation processes. Further, scRNA-seq plots expose cellular heterogeneity and transcriptional state without the need for surface marker-dependent isolation techniques.
Non-conventional lymphoid cells of the developing thymus include distinct cellular subsets
To tease out the lymphocyte subpopulations present in overview cluster BLD5, we subsetted and reanalyzed these cells (Fig. 3A). The tSNE revealed temporal dynamics within and between clusters (Fig. 3B). Using a bootstrap aggregation approach, we defined eight subclusters (NCL 1–8; Fig. 3C) whose relative abundance changed drastically over time (Fig. S4A). To identify the cellular subsets, we determined cluster-specific expression of data-driven and curated marker genes (Fig. 3D and Table S3). Clusters NCL 1, 2, 3 and 8 displayed low or no expression of Cd3e, Cd3d, TCR, Cd4 or Cd8a, suggesting those cells are not T cells (Fig. 3D, Fig. S4B). They were present primarily at earlier time points: after E16.5, NCL1 was not sampled, NCL2 scarcely occurred, and NCL3 and NCL8 decreased in proportion (Fig. S4A). NCL8 expressed genes characteristic of an ILC2 phenotype, including expression of Icos, Rora, and Bcl11b (Maazi et al., 2015) and increased expression of signature genes drawn from an ImmGen consortium profile of innate lymphoid cells (Robinette et al., 2015)) (Fig. 3D, Fig. S4B). Cells clustered in NCL3 expressed transcripts characteristic of ILC1 or NK cells, including Klrb1c, Klrk1, and Tbx21. NCL1 and NCL2 were similar, grouping with NCL3 in hierarchical cluster analysis and tSNE (Fig. 3C,D). NCL1 expressed Zbtb16, and Tcf7, similar to a recently described common precursor of Lymphoid tissue inducer’s (LTi) and ILC’s in the liver (Ishizuka et al., 2016). NCL2 was positioned between NCL1 and NCL3, was enriched in cells from earlier embryonic time points, and lacked the effector transcripts Gzma and Gzmb, which were expressed by NCL1 and 3. This, together with the presence of Id2, Tox, Nfil3, Sox4, and Runx1, is consistent with a reported progenitor cell population (Ishizuka et al., 2016).
Figure 3.

Single-cell data reveal molecular details and subsets of non-conventional lymphocytes. (A) Schematic showing that this figure includes the cells from BLD5. (B,C) tSNE colored by developmental day (B) or cluster identity (C); each dot represents one cell. (D) Row-standardized heatmaps of genes showing the strongest expression differences across clusters (left panel) and genes curated from the literature (right panel). Entries display average log normalized expression. Seurat dendrogram is fitted to cluster means. ). The number of independent experiments performed was: 1 for each of days E15.5, E17.5, E18.5, and P0; 2 at each of days E13.5, E14.5, and E16.5; and 3 at E12.5. See also Fig. S4.
The remaining four clusters (NCL 4–7) captured cells that expressed high amounts of Cd3e and Cd3d, indicative of T cell identity. These putative T cells were present in higher proportions at later time points, barely appearing at E13.5-E14.5 but dominating the sample at E16.5 (Fig. S4A). NCL4 expressed Tcra, Tcrb Cd3, Cd4, Lef1, and low Cd8a, suggesting presence of some type of conventional T cell. Likewise, NCL5 and NCL6 captured cells that expressed high amounts of Cd3, but they expressed Tcrd. NCL5 and 6 mostly consist of cells from after E15.5. Expression of Gzma, Thy1, Sox13, Myb, and Sell in NCL5 suggested that it captured an early stage of γδ T cells (Narayan et al., 2012). The identity of NCL6 remained elusive, but we noted that it co-clustered with NCL4 and NCL5 in hierarchical clustering and tSNE, with cells from NCL4 falling into NCL6 in 19.8% of the bootstrap samples on average. NCL7 expressed higher amounts of Tcrg and Tcrd, along with Ccr6, Il22 and Il17, matching a γδ subset that is present in the adult murine epidermis but produced before birth (Haas et al., 2012; Mabuchi et al., 2011). NCL7 appeared mostly at or after E18.5.
We conclude that subsetting the thymus atlas facilitates molecular-level classification and investigation of NCL populations, including innate lymphoid cells, γδ T cells, and their precursors.
Non-conventional lymphocytes display differential dependency on antigen receptor rearrangement
Based on TCR subunit expression, we predicted that NCL clusters 4, 5, 6, and 7 contained T cells. Since TCR subunits are expressed in low amounts in other cell types (P. Anderson et al., 1989), we sought stronger evidence about the identity of these putative T cells, specifically by testing whether recombination of the TCR locus was necessary for their survival. To distinguish bona fide T cell populations from other lymphocytes, we used Rag1−/− mice (Mombaerts et al., 1992), which fail to undergo TCR rearrangement and consequently lack both αβ and γδ T cells. Our predictions imply that T cell subsets should be absent from the Rag1−/− samples. We analyzed thymic lobes from Rag1−/− embryos at E16.5 (n=2,012 cells), employing k-nearest neighbors to classify them according to the cluster labels used in the atlas (Fig. 4A). Notably, thymocyte containing cluster identity BLD3 was nearly absent from the Rag1−/− samples, indicating a block at β selection (Fig. 4B,C). Indeed, differential expression testing of the most mature DN thymocytes revealed that the Rag1−/− was deficient in Cd8a and Gzma, but higher in Il2ra and Ptcra (Fig. 4D and Table S4A), consistent with a β selection block (Godfrey et al., 1994).
Figure 4.

Rag1−/− mouse thymi demonstrate that clusters labeled as thymocytes depend on antigen receptor rearrangement. (A,B) tSNE colored by cell type (A) and replicate (B); each dot represents one cell. E16.5 Rag1−/− cells were assigned to clusters via supervised machine learning (methods). WT data are the same three E16.5 replicates used for the WT cell atlas. Rag1−/− data include two biological replicates. (C) TACS plot depicting composition of WT and Rag1−/− E16.5 thymocytes. Contours outline regions of successively higher cell density. (D) Volcano plot for differentially expressed transcripts within Cd44loIl2ralo between Rag1−/− and WT thymocytes at E16.5. (E) Composition of E16.5 NCL compartment by genotype. (F) tSNE of NCL cells from E16.5 WT and Rag1−/− colored by atlas-based classification. P-values in (C) and (E) were computed on cell-count tables by Fisher’s exact test, with the 4014 cells from panel (C) grouped by TACS quadrant. Rag1−/− replicates were processed together in the same experiment.
To address whether predicted thymocytes in the NCL compartment can survive without rearrangement of the TCR locus, we subsetted the NCL compartment from wildtype (WT) and Rag1−/− datasets. At E16.5, NCL clusters 3, 5, 6, and 8 predominated in the WT dataset. Concordant with our categorizations of NCL 5 and 6 as T cells and NCL 3 and 8 as ILC-like, NCL 5 and 6 were depleted in the Rag1−/− mice, whereas NCL 3 and 8 increase proportionally (Fig. 4E). Unsupervised methods confirmed that two of four clusters in the E16.5 data contained only WT cells (Fig. 4F), and differential expression testing of the whole NCL compartment demonstrated enrichment of T cell related genes in the WT samples (Tables S4B and S4C). This experiment validates our partition of NCL compartment into T cells and others.
Cellular heterogeneity of thymic epithelial cells dynamically changes with progression of thymus organogenesis
Thymic epithelium is complex, with reported heterogeneity in both medullary TECs (mTECs) and cortical TECs (cTECs) (Abramson and G. Anderson, 2017; Takahama et al., 2017). To outline cellular subtypes in an unbiased way, we refined analysis of the TEC supercluster (Fig. 5A). tSNE revealed embryonic development as a prominent source of variability (Fig. 5B), and a bootstrap aggregation approach identified 7 subclusters (Fig. 5C). Cluster proportions are highly dynamic over time (Fig. S5A), and transcripts associated with maturation such as (MHC) class II encoded H2-Aa (Takahama et al., 2017) are enriched in the later embryonic days (Fig. S5B and Table S5A). In concordance with an upregulation of class II MHC pathway, Cd74 (Invariant chain) is similarly upregulated during embryonic development (Fig. 5D).
Figure 5.

Heterogeneity within thymic epithelium. (A) Schematic showing that this figure includes the cells from TEC1-3. (B–D) tSNE colored by developmental day (B), cluster identity (C), and Cd74 expression (D); each dot represents one cell. (E) Dendrogram relating TEC subsets, and heatmap of genes curated from the literature. Log-normalized expression was averaged within clusters and each row was centered and scaled to have zero mean and unit variance. Seurat dendrogram was computed using cluster means. (F,I) Cells included for pseudotime inference: mTEC (F); cTEC (I). (G,J) Embryonic day displayed by diffusion components and pseudotime: mTEC (G); cTEC (J). (H,K) Selected genes smoothed on pseudotime: mTEC (H); cTEC (K). Trend shows a mean estimate, and shaded region is a point-wise 95% CI (does not account for uncertainty in pseudotime estimation). The number of independent experiments performed was: 1 for each of days E15.5, E17.5, E18.5, and P0; 2 at each of days E13.5, E14.5, and E16.5; and 3 at E12.5. See also Fig. S5.
To characterize clusters, we analyzed expression of key thymus-relevant genes (Fig. 5E, Fig. S5C, and Table S5A). Clusters mTEC1 and 2 expressed Cldn3 and Cldn4, consistent with early mTEC progenitors (Hamazaki et al., 2007; Sekai et al., 2014). In mTEC3, some cells expressed Aire and Fezf2, and other Aire-negative cells expressed Tnfrsf11a (Rank). These expression patterns are consistent with mature mTECs and precursors of AIRE-positive mTECs, respectively (Akiyama et al., 2016; Takaba and Takayanagi, 2017; Takahama et al., 2017). While our developmental time frame does not allow elucidation of the post-Aire expression mTECs found in adult thymus (Michel et al., 2017; Nishikawa et al., 2010), we observed earliest Aire-expressing cells as early as E13.5. A pseudotemporal analysis based on diffusion maps (Haghverdi et al., 2016) aligns with developmental trajectories (Alves and Ribeiro, 2016; Takahama et al., 2017), with high Cldn4 expression enriched in the beginning, trailed by increases in Tnfrsf11a and upregulation of Aire and Cd80 towards the end of pseudotime (Fig. 5F–H). Other transcripts resolved by pseudotime analysis in mTECs include immune-associated transcripts such as Icosl, Il2rg Ubd, Fezf2, Fgf21, Cd40, H2-Aa, and Cxcl10 (FDR<0.1; Fig. S5D and for full list Table S5B).
The remaining clusters expressed Ly75, Ackr4, Cd83, Prss16, Tbata, and Psmb11 which was consistent with developing cTECs (Figures 5E and S5B,C). These cells form a continuum of variation rather than well-separated subpopulations, with clusters contiguous on the tSNE (Fig. 5B). Using diffusion maps, development of cells captured in the cTEC clusters can be described in terms of a pseudotime axis (Fig. 5I,J). Concordant with views on cTEC development (Ohigashi et al., 2016; Takahama et al., 2017), Ackr4, Cd40, Enpep (Ly51), and H2-Aa increased with pseudotime (Fig. 5K). In addition, pseudotime analysis revealed dynamic regulation of immune-relevant genes such as Cxcl10, Il15ra, H2- D1, H2-Dma, Tbata, Cd274, Ctsl, and Ccl25 (FDR<0.1; Fig. S5E and Table S5C).
This analysis characterizes the cellular heterogeneity and molecular dynamics within the developing thymic epithelium. The molecular analysis includes the mTEC and cTEC compartments and proposes developmental trajectories through pseudotime inference.
Epithelial subtypes display specific surface markers implicated in development, function, and disease
To enrich for functionally important molecules within transcriptome-wide profiles of each TEC subtype, we enumerated and rank subtype-specific transcripts encoding cell surface proteins (Table S5D). This screen highlights Ackr4, Ly75, Dll4, Cd83, and MHCII subunits, all of which have roles in identification or function of cTECs (Abramson and G. Anderson, 2017; Takahama et al., 2017). Additionally, mTEC markers Skint1, Ccl19, and Tnfrsf11b (osteoprotegerin) were specific to mTEC3. These genes play roles in T cell selection (Skint1), T cell chemoattraction (Ccl19), and immature mTEC growth suppression (Tnfrsf11b), capturing functional aspects of mature mTECs (Barbee et al., 2011; Britz and Hart, 1983; Hikosaka et al., 2008). The top-ranked result for mTEC3 (based on specificity and high expression) was Plb1, a phospholipase genetically associated with rheumatoid arthritis (Okada et al., 2014).
Thymic organ culture displays cellular heterogeneity and maturation comparable to embryonic development
Fetal thymic organ cultures (FTOCs) have been applied to facilitate investigations of thymus organogenesis in an in vitro system (e.g. (Baik et al., 2013)). The thymus cell atlas provides a uniquely detailed reference dataset to help understand how thymus development in vivo compares to FTOC development in vitro. We implemented a short-term FTOC in vitro maturation assay and evaluated it using Drop-seq (Fig. 6A, B). Maturation was measured using Transcript Averaged Cell Scoring (TACS) and unbiased, transcriptome-wide ranking based on fractional identity quantification.
Figure 6.

Fetal thymic organ cultures allow for maturation of thymic cell populations. (A) Schematic of organ culture model assessment. (B) Cell atlas-based classification of FTOC cell populations. (D) Display of thymocyte maturation (Il2ra versus Cd44) in cell atlas compared to FTOC endpoint via TACS (upper panel) and unbiased fractional identity estimation (lower panel). (E) Display of TEC maturation (Epcam versus MHCII) in cell atlas compared to FTOC endpoint via TACS (upper panel) and unbiased measurement of epithelial cell maturation using a fractional identity estimation method (lower panel). Tests compare WT E13.5 samples to the FTOC, corresponding to a null hypothesis of no maturation after dissection. P-values were computed by Fisher’s exact test with cells and grouped by TACS quadrant. Tests involve 3664 T cells and 2623 TECs. FTOC samples represent n=3 biological replicates and 3 independent experiments. See also Fig. S6 and S7.
Mesenchyme, endothelium, expected TEC and blood subsets were present, and they expressed prototypical cell-type markers (Fig. S6A–C). There were proportionally fewer thymocytes, which is easily explained by the lack of continuous immigration of blood progenitors. Thymocyte maturation was marginally delayed relative to E16.5, possibly reflecting suboptimal conditions for T cell development in culture (Fig. 6C). The TEC compartment appeared comparable to E16.5 (Fig. 6D), and mature mTECs and cTECs were present as judged by expression of Aire, Ubd, Psmb11 and class II MHC pathway-related transcript (Fig. S6A). Importantly, all evaluation methods indicated that thymocytes and TECs mature in vitro (Fig. 6CD).
To evaluate aspects of epithelial heterogeneity not directly related to maturation, a classifier trained on the atlas TECs allows unbiased subtype quantification. Results showed that all expected TEC subtypes were present, but the FTOC contained more cells in the most mature clusters (mTEC3, cTEC4) and fewer in the clusters (cTEC3, cTEC2) that showed cell cycle related transcription (Fig. S6C).
We conclude that the short-term FTOC captures key aspects of thymus development, in particular with respect to maturation and heterogeneity of thymic epithelial cells.
Thymic cellular heterogeneity is resilient against exogenous retinoic acid
Following validation of the short-term FTOC system to capture TEC maturation, we aimed to test the effects of exogenous stimuli on the thymus with focus on the epithelium (Fig. 7A, B). We chose retinoic acid (RA), which is a potent teratogen with extensive roles in development (Rhinn and Dolle, 2012), including TEC development (Sitnik et al., 2012). Together with the control FTOC dataset, the RA FTOC dataset contains 6,778 cells.
Figure 7.

TEC maturation and heterogeneity are protected from exposure to retinoic acid. (A) Schematic of organ culture perturbation experiment. (B) Schematic of methodology for applying atlas cluster labels to FTOC TECs. (C, D) tSNE of control and RA-perturbed TECs from FTOC colored by cluster identity (C) and treatment (D). (E) Volcano plot showing genes differentially expressed between control and RA treatment. (F) tSNE showing candidate transcripts Cyp26b1, Dhrs3, and Akap12. RA FTOC samples represent n=3 biological replicates and 3 independent experiments. See also Fig. S7.
In multiple cell types, RA had profound effects on transcription, with cells clustering by perturbation as well as cell type consistently across replicates (Fig. S7A, B). Concordant with previous observations (Sitnik et al., 2012), exposure to RA affected thymus size, with live cell counts showing a decrease (Table S6A) that was noisy (p=0.16, two-sided t-test) but large (fold change of 40%).
TECs are included among the cell types affected by RA, with strong effects on tSNE (Fig. 7C,D). Differential expression testing within the epithelial compartment revealed upregulation of Akap12, a tumor suppressor associated with RA-induced growth suppression in vascular smooth muscle (Streb et al., 2011) (Fig. 7E, F), suggesting a mechanism for the size decrease. Also upregulated were genes known to function in RA degradation, including the cytochrome P450 subunit Cyp26b1 and the reductase Dhrs3 (Fig. 7E, F and Table S6B).
Despite the changes in size and transcriptional activity, we found that each individual cluster was recognizable, yielding uniform output from a thymus atlas-trained classifier (Fig. S7C). Within the TEC compartment of our RA-treated samples, all expected TEC subtypes were present (Fig. 7C and Fig. S7D).
In conclusion, the short term FTOC combined with Drop-seq provides a tractable system to investigate effects of environmental stimuli on thymus-resident cells. Here, we reveal that exogenous RA alters transcriptomic signatures of multiple cell populations without substantially altering the overall composition of TECs. Instead, upregulation of transcripts such as Cyp26b1 and Dhrs3 suggest their involvement in degradation of the excess retinoic acid, and this buffering may help preserve cellular heterogeneity.
Discussion
Using a high-throughput scRNA-seq approach, we captured transcriptomic dynamics from early stages of thymus organogenesis to birth. Machine learning analysis of this dataset reflects many previously established characteristics of thymus development, including conventional thymocyte maturation. Drop-seq captures previously underappreciated subpopulations, reveals stages of blood and epithelial development, and characterizes perturbations in vitro and in vivo, all at transcriptome-wide resolution. Pseudotemporal analysis uncovers maturation trends in TEC subsets.
Cross-referencing tissue-specific expression patterns with GWAS data provides evidence that autoimmune pathogenesis could begin during early thymus organogenesis, both in the blood and in the epithelium. For some of these genes, the mechanism behind the disease association is unknown. In the case of Plb1, our results suggest that a role of Plb1 in the medulla may have to be considered when studying the autoimmune etiology of rheumatoid arthritis. Expression of autoimmune-implicated genes early during thymus development suggests that their roles in regulating immunity may begin during embryogenesis. If future studies are to reveal mechanisms behind this trend, they will need to pinpoint specific combinations of genes, cell subsets, and developmental windows. Our data cover all of these aspects, providing key experimental design context to help dissect the molecular underpinnings of thymus development and the resulting implications for immune function.
By focusing on specific cellular subsets, we revealed multiple layers of cellular heterogeneity and dynamics that are available for further analysis, underscoring the value of this data resource. While the clustering algorithms captured cellular heterogeneity often concordant with reported cell populations, additional supervised or unsupervised methodologies can be applied to analyse the data in context of known marker genes. For example, here we have applied TACS analysis for known markers of thymocyte subsets, and recently developed approaches to pseudotemporal dynamics may reveal additional quantitative details of thymocyte development (Fischer et al., 2017).
We cannot exclude that rare cell types may have gone undetected due to tissue preparation methods, cell death prior to Drop-seq, or low statistical power. Nevertheless, our in vivo and FTOC datasets together capture 24,279 cells, representing a comprehensive single-cell atlas of an entire primary lymphoid organ. High correlation between replicates, together with computational approaches to integrate scRNA-seq datasets from different labs and platforms (Butler et al., 2018), signify that this initial platform can be extended as sequencing costs continue to decrease and single-cell methods proliferate. This resource complements ongoing discussion of cellular heterogeneity and differentiation, and it provides a detailed molecular framework to guide future studies on thymus organogenesis.
STAR Methods
CONTACT FOR REAGENT AND RESOURCE SHARING
Further information and requests for resources and reagents should be directed to and will be fulfilled by the Lead Contact, Rene Maehr (rene.maehr@umassmed.edu).
EXPERIMENTAL MODEL AND SUBJECT DETAILS
Mice
C57BL6/J (Catalog #: 000664; RRID:IMSR_JAX:000664) and Rag1−/− (Catalog #: 002216; RRID:IMSR_JAX:002216; B6.129S7-Rag1tm1Mom/J) mice were obtained from The Jackson Laboratory. Pax9VENUS genetically targeted reporter mice (Kearns et al., 2013) were maintained through crossing with C57BL6/J mice and used to isolate the e12.5 thymus as described below. C57BL6/J, Rag1−/−, and Pax9VENUS mice were mated for timed pregnancy. Animals with a visible vaginal plug were separated and embryonic day was noted as 0.5 (E0.5). Animals were maintained in group housing, and experiments were performed according to institutional guidelines and approved by the UMMS Institutional Animal Care and Use Committee (IACUC).
METHOD DETAILS
Inclusion criteria
In all datasets except the FTOC, only male embryos were included. At indicated time-points, embryos were harvested and genotyped for presence of the Sry locus. Male embryos were identified using Sry-specific PCR analysis (SRY-fw: 5′-TTGTCTAGAGAGCATGGAGGGCCATGTCAA-3′ and SRY-rv: 5′-CCACTCCTCTGTGACACTTTAGCCCTCCG-3′) following tail tissue DNA extraction using the EZ FAST Tissue/Tail PCR Genotyping Kit (G1001-300; EZ Bio Research). PCR cycling conditions were as follows: 93°C for 1 minute, 25 cycles of 93°C for 20 seconds followed by 68°C for 1 minute, then held at 4°C. During PCR analysis, the embryos were kept on ice in RF10-media (RPMI 1640, Gibco 21870; 10% FBS, Gibco 10437-028). Mechanical isolation of the thymus resumed immediately after.
Immunofluorescence staining and microscopy
10% formalin-fixed (Fisher, 032-060) embryos were washed with cold PBS, dehydrated in sucrose solution in cold PBS (Sigma, S0389), and embedded in O.C.T compound (Sakura, 4583). Frozen sections (10 μm) were blocked with 5% donkey serum (Lampire, 7332100) in PBST (PBS + 0.2% Triton X-100 (Sigma, X100)) for 1 hour at room temperature, and stained with antibodies to EpCAM (1:1000; Abcam, ab71916), and FOXN1 (1:100; Santa Cruz Biotechnology, sc23566) overnight at 4°C. After washing three times in PBST, sections were incubated with Alexa Fluor 546594 and 647 conjugated secondary antibodies (Life Technologies) for 2 hours at room temperature. Nuclei were stained with Hoechst (Invitrogen, H3570). Washed slides were mounted in Fluoromount-G (eBioscience, 00-4958-02) and imaged using a Nikon Eclipse Ti Laser-scanning fluorescence microscope. Phase contrast and VENUS images for unfixed embryos were observed under a Nikon SMZ1500 with Nikon Intensilight Epi-fluorescence Illuminator.
Cell isolation and sorting
Pax9VENUS genetically targeted heterozygous mice were used to prepare VENUS-fluorescence positive samples for mechanical extraction of whole thymi at E12.5. C57BL6/J mice were used to mechanically collect the thymic lobes for E13.5-P0. E16.5 thymic lobes were also collected from Rag1−/− mice. All mice were dissected in cold PBS + 2% BSA (Sigma, A-8412). Due to close association with the thymus at E12.5, parathyroid tissue was included in all E12.5 samples, but no other days.
Isolated tissues were dissociated with 0.05% (E12.5-E13.5) and 0.25% (E14.5-P0) trypsin-EDTA (Gibco, 25300-120 and 25200-056) at 37°C for 15–20 min with mechanical dissociation by pipetting every 5 min. Trypsin was deactivated with RF-10 media and centrifuged at 1500 rpm for 5 min at 4°C. All wild-type thymi were treated with 1x RBC lysis buffer (eBioscience, 00-4333-57) at 4°C for 3 to 5 min following trypsin digestion. The remaining cells were washed with and resuspended in PBS + 0.5% BSA. Single cells were sorted into 5 ml polypropylene round-bottom tubes (Corning, 352063) using a BD FACSAria II cell sorter. Dead cells were detected by 7-aminoactinomycin D (7-AAD; 1:60; eBioscience, 00-6993-50) staining and excluded during FACS.
Fetal thymic organ culture (FTOC)
Fetal thymic lobes were dissected from E13.5 C57BL6/J mouse embryos and cultured at liquid-gas interface using Millicell 1.0 μM 6-well hanging inserts (Millipore, MCRP06H48) on DMEM medium (Fisher, 11320-033) supplemented with 10% FBS (GE Healthcare Life Sciences, HyClone, SH30070.03), 1X penicillin and streptomycin (Corning, 30-002-CI), 1X non-essential amino acids (Gibco, 11140-050), 10 mM HEPES (Gibco, 15630-080), and 55μM 2-mercaptoethanol (Gibco, 21985-023). Lobes were treated with either retinoic acid (1 μM; Sigma, R2625) or vehicle control. Media was changed daily for 3 days, and then lobes were collected for flow cytometry. Samples were dissociated as described above for E16.5 samples, and red blood cells were removed by incubation for 3 minutes with 10X RBC lysis buffer (Biolegend, 420301). Dead cells were detected by 7-AAD staining and excluded during FACS.
Drop-seq and library preparation
Drop-seq was performed following the Drop-seq Laboratory Protocol version 3.1 (http://mccarrolllab.com/dropseq/). Briefly, sorted single cell suspensions were resuspended at 1×10⁵ cells per mL in PBS + 0.01% BSA. The diluted cell suspension, barcoded Oligo-dT beads (Chemgenes, MACOSKO-2011-10), and droplet generation oil (Biorad, 1864006) was run through a PDMS co-flow microfluidic droplet generation device (Nanoshift, custom built based on Macosko et al. datafile 1 (Macosko et al., 2015)) at flow rates of 4,000 μL per hour, 4,000 μL per hour, and 15,000 μL per hour, respectively. Droplet breakage, bead isolation, and cDNA synthesis were performed as described (Macosko et al., 2015). cDNA libraries were tagmented with Nextera XT DNA Library Preparation kit (Illumina, FC-131-1024) and sequencing libraries were amplified and individually barcoded. Agencourt AMPure XP beads (Beckman Coulter, A63881) were used for purification of cDNA and sequencing libraries according to the manufacturer’s instructions. Final sequencing libraries were analyzed on an Agilent High Sensitivity DNA bioanalyzer chip to determine average basepair size and final library concentrations were determined with a Qubit High Sensitivity DNA assay kit (Invitrogen, Q32854).
Drop-seq libraries were sequenced at paired-end (20–50) on a Nextseq500 using a Nextseq500/550 High Output v2 75-cycle kit (Illumina, FC-404-2005).
Mitigating cell-cycle variation
Before applying machine-learning techniques, cell cycle effects were reduced as follows. For each of five cell cycle phases, scores were computed by averaging expression within each cell over a set of genes found in the second workbook of table S2 from a reference (Macosko et al., 2015). Seurat’s RegressOut function was used to replace log2 normalized expression with standardized residuals from many linear regressions (one per gene). In each regression, points are cells; the response variable is log-normalized expression; and the covariates are the five cell cycle scores.
Data analysis pipeline
Each analysis followed a standard machine learning pipeline. The pipeline began with selection of highly variable genes using Seurat’s MeanVarPlot function, always with an expression cutoff of 0.1 on a log normalized expression scale (x.low.cutoff = 0.1.) Principal components analysis (PCA) was run on these variable genes, using the normalized residuals from RegressOut. The top principal components (PC’s) were used as input to t-Stochastic Neighbor Embedding (t-SNE) (Maaten and Hinton, 2008). Analyses were repeated with different parameter choices for variable gene selection and for the number of PC’s were to confirm that results remained qualitatively consistent. For all analyses, genes were selected if their coefficient of variation (CV) exceeded 0.5 times the local median CV (binning by expression; y.cutoff = 0.5 in MeanVarPlot). The final number of PC’s selected varied according to the complexity of the dataset. PC’s were fed into different clustering algorithms for different purposes as discussed below. Dendrograms relating the clusters were constructed based on Euclidean distances between cluster-averaged expression values via Seurat’s BuildClusterTree.
Differential expression testing and geneset annotation
For whole-thymus compartments, marker genes were filtered based on the fold change in the percent expressing (FCPE) to the next highest cluster. For instance, if a gene is expressed in 80% of BLD1 and 20% in the next highest cluster, the FCPE is 80/20 = 4. A gene was retained as a marker if the FCPE exceeded 2 (for regular clusters) or 4 (for blood or TEC superclusters). If both criteria were met, the gene was assigned to the smaller cluster.
Remaining marker lists were generated using a binomial generalized linear mixed model with gene detection as the response; cluster identity, genotype, or FTOC treatment as the covariate; and random-effects terms to allow correlation within replicates. Fitting was done via the R package ‘glmer’; approximate p-values were calculated using the R package ‘car’; and q-values were calculated from p-values using base R’s function ‘p.adjust’. Differential expression testing was carried out between each cluster and all other cells. To be tested, genes were filtered by the difference in average log2(1+CP10K) expression between values of the covariate (‘avg_diff’ in Seurat output; minimum 0.5 for whole organ and 0.25 all others) and were required to appear in >10% of cells in at least one cluster. All tables of cluster markers are filtered to have q < 0.01. Gene annotation was performed via Enrichr (Chen et al., 2013), which was accessed programmatically using the R package ‘enrichR’ (https://github.com/compbiomed). Input lists used the top 50 upregulated genes (ranking by avg_diff).
Quality control
Genes were excluded if expressed in less than 10 cells, and any cell expressing less than 1000 genes was excluded. Each in vivo replicate included in the paper contained at most three cells expressing the X-inactivation gene Xist, verifying that female embryos were excluded (females were not excluded from FTOC samples). To assess concordance across replicates, gene expression was aggregated over all cells in each replicate, taking both the gene’s average expression and the percent of cells expressing it. Each aggregation resulted in a gene-labeled column of values for each replicate. From these, Pearson correlations between replicates were calculated.
Doublet and contaminant removal
The microfluidics-based approach is expected to generate cell doublets at a low frequency. In addition, samples from E12.5 contained small amounts of non-thymic cell types due to the difficulty of dissecting the newly formed thymus. The machine learning pipeline was applied to remove these cells. Following visualization via tSNE, the clustering algorithm DBSCAN (Ester et al., 1996) was used to isolate clusters showing markers from multiple cell types, and these were removed. In DBSCAN, the t-SNE embedding was used as input. The DBSCAN parameters applied to the overview data were 1.1 (neighborhood size) and 5 (minPts), with the tSNE embedding using 25 PC’s. Four clusters were manually labeled as intra-thymic doublets or non-thymic cells (parathyroid, muscle) after inspection of individual genes. Looking at cells that coexpress Gcm2 and Pth, this process removed all but 5 such cells. In total, 128 cells were excluded from further analysis, leaving 15,292 cells.
Unsupervised modeling of cellular heterogeneity
Whole-thymus and thymocyte clustering were carried out using Seurat’s FindClusters function, which applies a variant of the Louvain algorithm (Waltman and van Eck, 2013) to a shared-nearest-neighbor graph constructed in the principal subspace. The resolution parameter was set to 0.5 and 25 PC’s were used. For thymocytes, analysis was repeated after removal of 32 doublets, leaving 9801 cells included.
The TEC clusters were extracted from the whole-thymus dataset (3375 cells). Gene selection, PCA, and tSNE (input: 12 PC’s) were reapplied on this subset. 34 predicted blood doublets were removed, leaving 3341 cells, and the machine learning pipeline was reapplied one final time (tSNE input: 12 PC’s). To handle uncertainty over the appropriate number of clusters, we followed a bootstrap aggregation (bagging) approach (Dudoit and Fridlyand, 2003). K-means served as the base clustering algorithm. As input, this bagging procedure used 25 PC’s from the machine learning pipeline. The procedure begins by resampling the data 100 times and clustering each resampled dataset, and it yields votes for each cell. For instance, a certain cell might fall into the first cluster 80% of the time. The complementary percentage (20% for the example cell) measures the labeling instability of the cell. This instability was averaged across cells and used as a criterion to select the seven-cluster model clusters. Note that a one-cluster model yields zero instability, and instability generally increases with the number of clusters. Thus, rather than an absolute minimum, a dip in the curve was selected.
From the whole-thymus data, cluster BLD5 was extracted (773 cells). Improved TCR counts were computed and merged as described above, and the machine learning pipeline was applied (tSNE input: 12 PCs). Bootstrap-based clustering was carried out using (input: 30 PC’s), with a 9-means model selected based on stability. One cluster contained only one cell, was unstable, and displayed TEC markers. All cells with >20% votes for that cluster were removed (4 cells). The machine learning pipeline and bagged clustering were carried out again, showing stable results for 8-,9-, or 10-means. Clusters may disappear during the voting process if they do not win a plurality in any cells, and bagged k-means yielded almost the same eight final clusters for each of k=8, 9, or 10 (data not shown). The results presented use k=10 for a more robust and flexible base learner.
Rag1−/− and FTOC alignment, quantification, and classification
Rag1−/− and FTOC data underwent the same alignment, quantification, and QC procedures as the wild-type in vivo data, except that 1) genes were only required to appear in at least three cells and 2) female embryos were not excluded from FTOC data. This yielded 2010 Rag1−/− cells and 6834 FTOC cells. Before Rag1−/− processing, all E16.5 cells were subsetted from the WT data. These cells were combined with the Rag1−/− cells, and the machine learning pipeline was applied (15 PC’s). For WT cells, labels were preserved, and Rag1−/− cells were labeled via a 25-nearest-neighbors classifier as described below.
To investigate non-conventional lymphoid cells, cluster BLD5 was subsetted from E16.5 WT and Rag1−/− cells. TCR realignment results were added to these subsetted cells. The machine learning pipeline was reapplied (8 PC’s). For WT cells, labels were preserved from unsupervised analysis, whereas Rag1−/− cells were labeled using the supervised machine learning procedure described below.
Before FTOC procession, an initial run of the analysis pipeline (25 PC’s; clusters based on Louvain algorithm) revealed parathyroid cells. These were removed, leaving 6778 cells. The remaining cells were classified using the atlas data as a training set. Cells labeled as TECs were subsetted and classified again using the atlas TECs as a training set.
Supervised classification
To label new data based on the Atlas, a 25-nearest-neighbors classifier was used. Distance was measured after projecting onto a 20-dimensional principal subspace, which was calculated from the training data with genes centered (but not scaled). For each query cell, genes present in the training data but not in the test data were filled in as zeroes. No cell cycle correction was employed.
TACS (Transcript-averaged cell scoring)
For each of two query transcripts, 100 transcripts with similar expression patterns are selected and ranked by their Pearson correlation with the query. In a process akin to compensation, the intersection of the transcript lists is removed from each list. The log normalized expression of the resulting genes are then averaged within each cell, and the resulting quantities are plotted.
Automatic ranking of cells by maturity
Unbiased estimates of thymocyte and TEC maturity were obtained by computing pseudo-bulk datasets from each embryonic day and assigning each cell a fractional identity via a quadratic programming approach (Camp et al., 2017). For each cell, maturity was calculated as a weighted average of embryonic days, using the identity fractions of that cell as weights.
Calculation of ILC and LTi scores
ImmGen ILC and LTi scores are calculated based on Robinette et al (Robinette et al., 2015). The LTi score is total log normalized expression of genes in their table S2, column 2. The ILC1, 2, and 3 scores are total log normalized expression of genes from columns 1, 7, and 10 (respectively) of their table S3.
Tests for change in cell-type proportions
For simple two-group comparisons, P-values were computed by Fisher’s exact test, with cells grouped by TACS quadrant. The tests establish that the findings are not due to measurement error on the level of individual cells. For cell-type proportions over time, linear models were fit using cell type proportions as the response and either an intercept term alone or a quadratic function of embryonic day as the predictor. To allow for batch effects, models used one observation per replicate, rather than one per cell. Observations were weighted by the number of cells in the replicate, and p-values were calculated using ANOVA.
Pseudotemporal analysis
The top 300 genes positively correlated with Cd74 were used as input to diffusion pseudotime via the R package “destiny”. Diffusion component 1 was used as pseudotime. cTEC and mTEC clusters were analyzed separately. Expression smoothing was performed using generalized additive models with a log link and a negative binomial response (via the R package “mgcv”). P-values were computed based on ANOVA of a 20-component piecewise linear model with knots placed at quantiles of the pseudotime distribution. P-values were adjusted via the Benjamini and Hochberg method, and heatmaps show all genes with adjusted p <0.1. Genes were clustered by applying k-means to vectors of smoothed expression values, with k selected manually after inspection of the gap statistic curve.
QUANTIFICATION AND STATISTICAL ANALYSIS
Statistical methods are described in this section or in the Method Details. Cell counts, replicate counts, and p-values are described in the Results or the figure legends.
Transcript quantification
The STAR aligner (v2.4.2), Picard tools (v1.96) and Drop-seq tools (v1.0) were used to convert raw FASTQ files into digital gene expression matrices. Below, we list in order the commands that were used.
| Purpose | Software Package | Command name | Specified Parameters |
|---|---|---|---|
| Convert to SAM | Picard tools | FastqToSam.jar | -- |
| Tag cell barcode | DropSeq tools | TagBamWithReadSequenceExtended | BASE_QUALITY=10, BARCODED_READ=1, NUM_BASES_BELOW_QUALITY=1, DISCARD_READ=False |
| Tag molecular barcode | DropSeq tools | TagBamWithReadSequenceExtended | BASE_QUALITY=10, BARCODED_READ=1, NUM_BASES_BELOW_QUALITY=1, DISCARD_READ=True |
| Remove low-quality barcodes | DropSeq tools | FilterBAM | -- |
| Remove polyA tail | DropSeq tools | PolyATrimmer | MISMATCHES=0, NUM_BASES=6 |
| Convert to FASTQ | Picard tools | SamToFastq.jar | -- |
| Align reads to exome | STAR | -- | -- |
| Sort BAM to speed merging | Picard tools | SortSam.jar | -- |
| Merge with tagging and alignment info | Picard tools | MergeBamAlignment.jar | INCLUDE_SECONDARY_ALIGNMENTS=False |
| Label read with exon | DropSeq tools | TagReadWithGeneExon | -- |
| Screen for bead errors | DropSeq tools | DetectBeadSynthesisErrors | NUM_BARCODES=2000 |
| Form DGE matrix | DropSeq tools | DigitalExpression | MIN_NUM_GENES_PER_CELL=1000 |
Raw molecule counts of each cell were scaled to sum to 10,000 and then transformed as x ↦ log2(1 + x). The number 10,000 was chosen by rounding the median UMI (unique molecular identifier) count up to the nearest power of 10. We refer to the resulting units of expression as log2(1 + CP10K) or log normalized expression.
In certain analyses as indicated below, T cell receptor alignment was improved by augmenting the reference genome. The augmented reference contained an artificial TCR contig in which known constant, joining, and variable regions of the TCR were concatenated. The boundaries were annotated as splice junctions, allowing STAR to position reads despite TCR recombination. TCR regions were extracted from TRACER annotation files, and the augmented reference is available from GEO as a supplemental file.
Reads aligning outside the TCR contig were discarded, and transcript quantification was performed as above. Two alterations were made: READ_MQ was lowered to 1, and in place of MIN_NUM_GENES_PER_CELL=1000, cell barcodes were selected based on output from the unmodified alignment pipeline. TCR counts were merged into existing digital gene expression matrices, overwriting any existing TCR counts.
Statistical analysis
Subsequent analysis was conducted using the R language (https://www.Rproject.org/) and the R package ‘Seurat’ version 1 (http://www.satijalab.org/seurat), with logging for reproducibility using the R package ‘freezr’ (https://github.com/ekernf01/freezr). Analysis scripts, R session info, and digital gene expression matrices will be made available from https://github.com/maehrlab prior to publication.
DATA AND SOFTWARE AVAILABILITY
FASTQ files, digital gene expression matrices, and the custom-built TCR contig have been deposited in GEO under accession number GEO: GSE107910.
Statistical analysis was implemented using in the R package thymusatlastools. This package and all analysis scripts are available from www.github.com/maehrlab.
Supplementary Material
Table S1: Cell-type markers. Related to Fig. 1.
Table S2: T-cell subset markers. Related to Fig. 2.
Table S3: NCL subset markers. Related to Fig. 3.
Table S4: Differential expression between Rag−/− and wt thymi. Related to Fig. 4.
Table S5: TEC subset markers and genes varying over pseudotime. Related to Fig. 5.
Table S6: Differential expression and cellularity between RA and control FTOCs. Related to Fig. 7.
Acknowledgments
We thank A. J. Choi for technical help in setting up Drop-seq runs; M.J. Ziller and D. Fischer for helpful suggestions on bioinformatics; N. Kearns, A. Reboldi, and J. Kang for thoughtful comments on the manuscript, and the UMass Medical School FACS core for support with cell sorting. We are grateful to P. Zamore and J. Luban for sequencer access. This work was funded by NIH grants (1DP3DK111898, R01 AI132963, UC4 DK104218), the Leona M. and Harry B. Helmsley Charitable Trust (2015PG-T1D035), and The Glass Charitable Foundation.
Footnotes
Author Contributions
E.K.: concept and design of data analysis, analysis and interpretation of data, writing of manuscript
R.G.: Tissue preparation, Drop-seq runs and library constructions, writing of manuscript
M.M.: embryo dissections, organ culture, and Drop-seq runs, writing of manuscript
K.N.: embryo dissections and Drop-seq runs
P.X.: mouse husbandry, embryo dissections and immunofluorescence
R.M.: concept and design of study, analysis and interpretation of data, writing of manuscript
Declaration of Interests
The authors declare no competing interests.
Publisher's Disclaimer: This is a PDF file of an unedited manuscript that has been accepted for publication. As a service to our customers we are providing this early version of the manuscript. The manuscript will undergo copyediting, typesetting, and review of the resulting proof before it is published in its final citable form. Please note that during the production process errors may be discovered which could affect the content, and all legal disclaimers that apply to the journal pertain.
References
- Abramson J, Anderson G. Thymic Epithelial Cells. Annu Rev Immunol. 2017;35:85–118. doi: 10.1146/annurev-immunol-051116-052320. [DOI] [PubMed] [Google Scholar]
- Akiyama N, Takizawa N, Miyauchi M, Yanai H, Tateishi R, Shinzawa M, Yoshinaga R, Kurihara M, Demizu Y, Yasuda H, et al. Identification of embryonic precursor cells that differentiate into thymic epithelial cells expressing autoimmune regulator. J Exp Med. 2016;213:1441–1458. doi: 10.1084/jem.20151780. [DOI] [PMC free article] [PubMed] [Google Scholar]
- Alves NL, Ribeiro AR. Thymus medulla under construction: Time and space oddities. Eur J Immunol. 2016;46:829–833. doi: 10.1002/eji.201646329. [DOI] [PubMed] [Google Scholar]
- Anderson P, Caligiuri M, Ritz J, Schlossman SF. CD3-negative natural killer cells express zeta TCR as part of a novel molecular complex. Nature. 1989;341:159–162. doi: 10.1038/341159a0. [DOI] [PubMed] [Google Scholar]
- Baik S, Jenkinson EJ, Lane PJL, Anderson G, Jenkinson WE. Generation of both cortical and Aire(+) medullary thymic epithelial compartments from CD205(+) progenitors. Eur J Immunol. 2013;43:589–594. doi: 10.1002/eji.201243209. [DOI] [PMC free article] [PubMed] [Google Scholar]
- Barbee SD, Woodward MJ, Turchinovich G, Mention JJ, Lewis JM, Boyden LM, Lifton RP, Tigelaar R, Hayday AC. Skint-1 is a highly specific, unique selecting component for epidermal T cells. PNAS. 2011;108:3330–3335. doi: 10.1073/pnas.1010890108. [DOI] [PMC free article] [PubMed] [Google Scholar]
- Baron M, Veres A, Wolock SL, Faust AL, Gaujoux R, Vetere A, Ryu JH, Wagner BK, Shen-Orr SS, Klein AM, et al. A Single-Cell Transcriptomic Map of the Human and Mouse Pancreas Reveals Inter- and Intra-cell Population Structure. Cell Syst. 2016;3:346–360e4. doi: 10.1016/j.cels.2016.08.011. [DOI] [PMC free article] [PubMed] [Google Scholar]
- Brennecke P, Reyes A, Pinto S, Rattay K, Nguyen M, Kuchler R, Huber W, Kyewski B, Steinmetz LM. Single-cell transcriptome analysis reveals coordinated ectopic gene-expression patterns in medullary thymic epithelial cells. Nat Immunol. 2015;16:933–941. doi: 10.1038/ni.3246. [DOI] [PMC free article] [PubMed] [Google Scholar]
- Britz JS, Hart GW. Biosynthesis of glycosaminoglycans by epithelial and lymphocytic components of murine thymus. J Immunol. 1983;130:1848–1855. [PubMed] [Google Scholar]
- Butler A, Hoffman P, Smibert P, Papalexi E, Satija R. Integrating single-cell transcriptomic data across different conditions, technologies, and species. Nat Biotech. 2018;48:1070. doi: 10.1038/nbt.4096. [DOI] [PMC free article] [PubMed] [Google Scholar]
- Camp JG, Sekine K, Gerber T, Loeffler-Wirth H, Binder H, Gac M, Kanton S, Kageyama J, Damm G, Seehofer D, et al. Multilineage communication regulates human liver bud development from pluripotency. Nature. 2017;546:533–538. doi: 10.1038/nature22796. [DOI] [PubMed] [Google Scholar]
- Chen EY, Tan CM, Kou Y, Duan Q, Wang Z, Meirelles GV, Clark NR, Ma’ayan A. Enrichr: interactive and collaborative HTML5 gene list enrichment analysis tool. BMC Bioinformatics. 2013;14:128. doi: 10.1186/1471-2105-14-128. [DOI] [PMC free article] [PubMed] [Google Scholar]
- DeLaughter DM, Bick AG, Wakimoto H, McKean D, Gorham JM, Kathiriya IS, Hinson JT, Homsy J, Gray J, Pu W, et al. Single-Cell Resolution of Temporal Gene Expression during Heart Development. Dev Cell. 2016;39:480–490. doi: 10.1016/j.devcel.2016.10.001. [DOI] [PMC free article] [PubMed] [Google Scholar]
- Dudoit S, Fridlyand J. Bagging to improve the accuracy of a clustering procedure. Bioinformatics. 2003;19:1090–1099. doi: 10.1093/bioinformatics/btg038. [DOI] [PubMed] [Google Scholar]
- Ester M, Kriegel HP, Sander J, Xu X. A density-based algorithm for discovering clusters in large spatial databases with noise. Kdd. 1996;96:226–231. [Google Scholar]
- Fischer DS, Fiedler AK, Kernfeld E, Genga RMJ, Hasenauer J, Maehr R, Theis FJ. Beyond pseudotime: Following T-cell maturation in single-cell RNAseq time series. 2017 https://doi.org/10.1101/219188.
- Godfrey DI, Kennedy J, Mombaerts P, Tonegawa S, Zlotnik A. Onset of TCR-beta gene rearrangement and role of TCR-beta expression during CD3-CD4-CD8- thymocyte differentiation. J Immunol. 1994;152:4783–4792. [PubMed] [Google Scholar]
- Gordon J, Manley NR. Mechanisms of thymus organogenesis and morphogenesis. Development. 2011;138:3865–3878. doi: 10.1242/dev.059998. [DOI] [PMC free article] [PubMed] [Google Scholar]
- Gruver AL, Sempowski GD. Cytokines, leptin, and stress-induced thymic atrophy. J Leukoc Biol. 2008;84:915–923. doi: 10.1189/jlb.0108025. [DOI] [PMC free article] [PubMed] [Google Scholar]
- Grun D, Lyubimova A, Kester L, Wiebrands K, Basak O, Sasaki N, Clevers H, van Oudenaarden A. Single-cell messenger RNA sequencing reveals rare intestinal cell types. Nature. 2015;525:251–255. doi: 10.1038/nature14966. [DOI] [PubMed] [Google Scholar]
- Haas JD, Ravens S, Duber S, Sandrock I, Oberdorfer L, Kashani E, Chennupati V, Fohse L, Naumann R, Weiss S, et al. Development of Interleukin-17-Producing γδ T Cells Is Restricted to a Functional Embryonic Wave. Immunity. 2012;37:48–59. doi: 10.1016/j.immuni.2012.06.003. [DOI] [PubMed] [Google Scholar]
- Haber AL, Biton M, Rogel N, Herbst RH, Shekhar K, Smillie C, Burgin G, Delorey TM, Howitt MR, Katz Y, et al. A single-cell survey of the small intestinal epithelium. Nature. 2017;551:333–339. doi: 10.1038/nature24489. [DOI] [PMC free article] [PubMed] [Google Scholar]
- Haghverdi L, Buttner M, Wolf FA, Buettner F, Theis FJ. Diffusion pseudotime robustly reconstructs lineage branching. Nat Meth. 2016;13:845–848. doi: 10.1038/nmeth.3971. [DOI] [PubMed] [Google Scholar]
- Hamazaki Y, Fujita H, Kobayashi T, Choi Y, Scott HS, Matsumoto M, Minato N. Medullary thymic epithelial cells expressing Aire represent a unique lineage derived from cells expressing claudin. Nat Immunol. 2007;8:304–311. doi: 10.1038/ni1438. [DOI] [PubMed] [Google Scholar]
- Hikosaka Y, Nitta T, Ohigashi I, Yano K, Ishimaru N, Hayashi Y, Matsumoto M, Matsuo K, Penninger JM, Takayanagi H, et al. The cytokine RANKL produced by positively selected thymocytes fosters medullary thymic epithelial cells that express autoimmune regulator. Immunity. 2008;29:438–450. doi: 10.1016/j.immuni.2008.06.018. [DOI] [PubMed] [Google Scholar]
- Hogquist KA, Baldwin TA, Jameson SC. Central tolerance: learning selfcontrol in the thymus. Nat Rev Immunol. 2005;5:772–782. doi: 10.1038/nri1707. [DOI] [PubMed] [Google Scholar]
- Ikawa T, Hirose S, Masuda K, Kakugawa K, Satoh R, Shibano-Satoh A, Kominami R, Katsura Y, Kawamoto H. An essential developmental checkpoint for production of the T cell lineage. Science. 2010;329:93–96. doi: 10.1126/science.1188995. [DOI] [PubMed] [Google Scholar]
- Ishizuka IE, Chea S, Gudjonson H, Constantinides MG, Dinner AR, Bendelac A, Golub R. Single-cell analysis defines the divergence between the innate lymphoid cell lineage and lymphoid tissue-inducer cell lineage. Nat Immunol. 2016;17:269–276. doi: 10.1038/ni.3344. [DOI] [PMC free article] [PubMed] [Google Scholar]
- Jaitin DA, Kenigsberg E, Keren-Shaul H, Elefant N, Paul F, Zaretsky I, Mildner A, Cohen N, Jung S, Tanay A, et al. Massively parallel single-cell RNA-seq for marker-free decomposition of tissues into cell types. Science. 2014;343:776–779. doi: 10.1126/science.1247651. [DOI] [PMC free article] [PubMed] [Google Scholar]
- Joost S, Zeisel A, Jacob T, Sun X, La Manno G, Lonnerberg P, Linnarsson S, Kasper M. Single-Cell Transcriptomics Reveals that Differentiation and Spatial Signatures Shape Epidermal and Hair Follicle Heterogeneity. Cell Syst. 2016;3:221–237. e229. doi: 10.1016/j.cels.2016.08.010. [DOI] [PMC free article] [PubMed] [Google Scholar]
- Kearns NA, Genga RMJ, Ziller M, Kapinas K, Peters H, Brehm MA, Meissner A, Maehr R. Generation of organized anterior foregut epithelia from pluripotent stem cells using small molecules. Stem Cell Res. 2013;11:1003–1012. doi: 10.1016/j.scr.2013.06.007. [DOI] [PubMed] [Google Scholar]
- Kisielow J, Kopf M, Karjalainen K. SCART scavenger receptors identify a novel subset of adult gammadelta T cells. J Immunol. 2008;181:1710–1716. doi: 10.4049/jimmunol.181.3.1710. [DOI] [PubMed] [Google Scholar]
- Kyewski B, Derbinski J. Self-representation in the thymus: an extended view. Nat Rev Immunol. 2004;4:688–698. doi: 10.1038/nri1436. [DOI] [PubMed] [Google Scholar]
- Li L, Leid M, Rothenberg EV. An early T cell lineage commitment checkpoint dependent on the transcription factor Bcl11b. Science. 2010;329:89–93. doi: 10.1126/science.1188989. [DOI] [PMC free article] [PubMed] [Google Scholar]
- Luc S, Luis TC, Boukarabila H, Macaulay IC, Buza-Vidas N, Bouriez-Jones T, Lutteropp M, Woll PS, Loughran SJ, Mead AJ, et al. The earliest thymic T cell progenitors sustain B cell and myeloid lineage potential. Nat Immunol. 2012;13:412–419. doi: 10.1038/ni.2255. [DOI] [PMC free article] [PubMed] [Google Scholar]
- Maaten LVD, Hinton G. Visualizing Data using t-SNE. J Mach Learn Res. 2008;9:2579–2605. [Google Scholar]
- Maazi H, Patel N, Sankaranarayanan I, Suzuki Y, Rigas D, Soroosh P, Freeman GJ, Sharpe AH, Akbari O. ICOS:ICOS-ligand interaction is required for type 2 innate lymphoid cell function, homeostasis, and induction of airway hyperreactivity. Immunity. 2015;42:538–551. doi: 10.1016/j.immuni.2015.02.007. [DOI] [PMC free article] [PubMed] [Google Scholar]
- Mabuchi T, Takekoshi T, Hwang ST. Epidermal CCR6+ γδ T cells are major producers of IL-22 and IL-17 in a murine model of psoriasiform dermatitis. J Immunol. 2011;187:5026–5031. doi: 10.4049/jimmunol.1101817. [DOI] [PubMed] [Google Scholar]
- Macosko EZ, Basu A, Satija R, Nemesh J, Shekhar K, Goldman M, Tirosh I, Bialas AR, Kamitaki N, Martersteck EM, et al. Highly Parallel Genome-wide Expression Profiling of Individual Cells Using Nanoliter Droplets. Cell. 2015;161:1202–1214. doi: 10.1016/j.cell.2015.05.002. [DOI] [PMC free article] [PubMed] [Google Scholar]
- Markert ML, Devlin BH, Chinn IK, McCarthy EA. Thymus transplantation in complete DiGeorge anomaly. Immunol Res. 2009;44:61–70. doi: 10.1007/s12026-008-8082-5. [DOI] [PMC free article] [PubMed] [Google Scholar]
- Marrella V, Poliani PL, Notarangelo LD, Grassi F, Villa A. Rag defects and thymic stroma: lessons from animal models. Front Immunol. 2014;5:259. doi: 10.3389/fimmu.2014.00259. https://doi.org/10.3389/fimmu.2014.00259. [DOI] [PMC free article] [PubMed] [Google Scholar]
- Meredith M, Zemmour D, Mathis D, Benoist C. Aire controls gene expression in the thymic epithelium with ordered stochasticity. Nat Immunol. 2015;16:942–949. doi: 10.1038/ni.3247. [DOI] [PMC free article] [PubMed] [Google Scholar]
- Michel C, Miller CN, Kuchler R, Brors B, Anderson MS, Kyewski B, Pinto S. Revisiting the Road Map of Medullary Thymic Epithelial Cell Differentiation. J Immunol. 2017;199:3488–3503. doi: 10.4049/jimmunol.1700203. [DOI] [PubMed] [Google Scholar]
- Miragaia RJ, Zhang X, Gomes T, Svensson V, Ilicic T, Henriksson J, Kar G, Lonnberg T. Single-cell RNA-sequencing resolves self-antigen expression during mTEC development. Sci Rep. 2018;8:685. doi: 10.1038/s41598-017-19100-4. https://doi:10.1038/s41598-017-19100-4. [DOI] [PMC free article] [PubMed] [Google Scholar]
- Mombaerts P, Iacomini J, Johnson RS, Herrup K, Tonegawa S, Papaioannou VE. RAG-1-deficient mice have no mature B and T lymphocytes. Cell. 1992;68:869–877. doi: 10.1016/0092-8674(92)90030-g. [DOI] [PubMed] [Google Scholar]
- Muraro MJ, Dharmadhikari G, Grun D, Groen N, Dielen T, Jansen E, van Gurp L, Engelse MA, Carlotti F, de Koning EJP, et al. A Single-Cell Transcriptome Atlas of the Human Pancreas. Cell Syst. 2016;3:385–394. e3. doi: 10.1016/j.cels.2016.09.002. [DOI] [PMC free article] [PubMed] [Google Scholar]
- Narayan K, Sylvia KE, Malhotra N, Yin CC, Martens G, Vallerskog T, Kornfeld H, Xiong N, Cohen NR, Brenner MB, et al. Intrathymic programming of effector fates in three molecularly distinct γδ T cell subtypes. Nat Immunol. 2012;13:2247–2518. doi: 10.1038/ni.2247. [DOI] [PMC free article] [PubMed] [Google Scholar]
- Nishikawa Y, Hirota F, Yano M, Kitajima H, Miyazaki JI, Kawamoto H, Mouri Y, Matsumoto M. Biphasic Aire expression in early embryos and in medullary thymic epithelial cells before end-stage terminal differentiation. J Exp Med. 2010;207:963–971. doi: 10.1084/jem.20092144. [DOI] [PMC free article] [PubMed] [Google Scholar]
- Oettinger MA, Schatz DG, Gorka C, Baltimore D. RAG-1 and RAG-2, adjacent genes that synergistically activate V(D)J recombination. Science. 1990;248:1517–1523. doi: 10.1126/science.2360047. [DOI] [PubMed] [Google Scholar]
- Ohigashi I, Kozai M, Takahama Y. Development and developmental potential of cortical thymic epithelial cells. Immunol Rev. 2016;271:10–22. doi: 10.1111/imr.12404. [DOI] [PubMed] [Google Scholar]
- Okada Y, Diogo D, Greenberg JD, Mouassess F, Achkar WAL, Fulton RS, Denny JC, Gupta N, Mirel D, Gabriel S, et al. Integration of sequence data from a Consanguineous family with genetic data from an outbred population identifies PLB1 as a candidate rheumatoid arthritis risk gene. PloS One. 2014;9:e87645. doi: 10.1371/journal.pone.0087645. https://doi.org/10.1371/journal.pone.0087645. [DOI] [PMC free article] [PubMed] [Google Scholar]
- Pers TH, Karjalainen JM, Chan Y, Westra HJ, Wood AR, Yang J, Lui JC, Vedantam S, Gustafsson S, Esko T, et al. Biological interpretation of genome-wide association studies using predicted gene functions. Nat Commun. 2015;6:5890. doi: 10.1038/ncomms6890. https://doi:10.1038/ncomms6890. [DOI] [PMC free article] [PubMed] [Google Scholar]
- Radtke F, Wilson A, Stark G, Bauer M, van Meerwik J, HR, Aguet M. Deficient T cell fate specification in mice with an induced inactivation of Notch1. Immunity. 1999;10(5):547–558. doi: 10.1016/s1074-7613(00)80054-0. [DOI] [PubMed] [Google Scholar]
- Ramond C, Berthault C, Burlen-Defranoux O, de Sousa AP, Guy-Grand D, Vieira P, Pereira P, Cumano A. Two waves of distinct hematopoietic progenitor cells colonize the fetal thymus. Nat Immunol. 2014;15:27–35. doi: 10.1038/ni.2782. [DOI] [PubMed] [Google Scholar]
- Rhinn M, Dolle P. Retinoic acid signalling during development. Development. 2012;139:843–858. doi: 10.1242/dev.065938. [DOI] [PubMed] [Google Scholar]
- Robinette ML, Fuchs A, Cortez VS, Lee JS, Wang Y, Durum SK, Gilfillan S, Colonna M Immunological Genome Consortium. Transcriptional programs define molecular characteristics of innate lymphoid cell classes and subsets. Nat Immunol. 2015;16:306–317. doi: 10.1038/ni.3094. [DOI] [PMC free article] [PubMed] [Google Scholar]
- Scialdone A, Tanaka Y, Jawaid W, Moignard V, Wilson NK, Macaulay IC, Marioni JC, Gottgens B. Resolving early mesoderm diversification through single-cell expression profiling. Nature. 2016;535:289–293. doi: 10.1038/nature18633. [DOI] [PMC free article] [PubMed] [Google Scholar]
- Sekai M, Hamazaki Y, Minato N. Medullary thymic epithelial stem cells maintain a functional thymus to ensure lifelong central T cell tolerance. Immunity. 2014;41:753–761. doi: 10.1016/j.immuni.2014.10.011. [DOI] [PubMed] [Google Scholar]
- Sitnik KM, Kotarsky K, White AJ, Jenkinson WE, Anderson G, Agace WW. Mesenchymal cells regulate retinoic acid receptor-dependent cortical thymic epithelial cell homeostasis. J Immunol. 2012;188:4801–4809. doi: 10.4049/jimmunol.1200358. [DOI] [PubMed] [Google Scholar]
- Streb JW, Long X, Lee TH, Sun Q, Kitchen CM, Georger MA, Slivano OJ, Blaner WS, Carr DW, Gelman IH, et al. Retinoid-induced expression and activity of an immediate early tumor suppressor gene in vascular smooth muscle cells. PloS One. 2011;6:e18538. doi: 10.1371/journal.pone.0018538. https://doi.org/10.1371/journal.pone.0018538. [DOI] [PMC free article] [PubMed] [Google Scholar]
- Takaba H, Takayanagi H. The Mechanisms of T Cell Selection in the Thymus. Trends Immunol. 2017;38:805–816. doi: 10.1016/j.it.2017.07.010. [DOI] [PubMed] [Google Scholar]
- Takahama Y, Ohigashi I, Baik S, Anderson G. Generation of diversity in thymic epithelial cells. Nat Rev Immunol. 2017;17:295–305. doi: 10.1038/nri.2017.12. [DOI] [PubMed] [Google Scholar]
- Waltman L, van Eck NJ. A smart local moving algorithm for large-scale modularity-based community detection. Eur Phys J B. 2013;86:471. https://doi.org/10.1140/epjb/e2013-40829-0. [Google Scholar]
- Wilson A, Held W, MacDonald HR. Two waves of recombinase gene expression in developing thymocytes. J Exp Med. 1994;179:1355–1360. doi: 10.1084/jem.179.4.1355. [DOI] [PMC free article] [PubMed] [Google Scholar]
- Xiao SY, Li Y, Chen WF. Kinetics of thymocyte developmental process in fetal and neonatal mice. Cell Res. 2003;13:265–273. doi: 10.1038/sj.cr.7290171. [DOI] [PubMed] [Google Scholar]
- Zeisel A, Munoz-Manchado AB, Codeluppi S, Lonnerberg P, La Manno G, Jureus A, Marques S, Munguba H, He L, Betsholtz C, et al. Brain structure. Cell types in the mouse cortex and hippocampus revealed by single-cell RNA-seq. Science. 2015;347:1138–1142. doi: 10.1126/science.aaa1934. [DOI] [PubMed] [Google Scholar]
Associated Data
This section collects any data citations, data availability statements, or supplementary materials included in this article.
Supplementary Materials
Table S1: Cell-type markers. Related to Fig. 1.
Table S2: T-cell subset markers. Related to Fig. 2.
Table S3: NCL subset markers. Related to Fig. 3.
Table S4: Differential expression between Rag−/− and wt thymi. Related to Fig. 4.
Table S5: TEC subset markers and genes varying over pseudotime. Related to Fig. 5.
Table S6: Differential expression and cellularity between RA and control FTOCs. Related to Fig. 7.