ABSTRACT
Recent studies have demonstrated that a subpopulation of neutrophils express the TCRαβ combinatorial immunoreceptor in humans and mice. Here, we report that a Plasmodium berghei ANKA murine malaria infection induces expansion of TCRβ expressing CD11b+ Ly6G+ neutrophils in the spleen during the early phase of infection. Measurement of TCRβ transcript and protein levels of neutrophils in wild-type versus nude and Rag1 knockout mice establishes that the observed expression is not a consequence of nonspecific antibody staining or passive receptor expression due to phagocytosis or trogocytosis of peripheral T cells. Remarkably, on day 3 postinfection, we observed a highly significant correlation between the proportion of neutrophils that express TCRβ and peripheral blood parasite burden. In addition, TCRβ+ neutrophils phagocytose parasitized erythrocytes with 4-fold greater efficiency than TCRβ− neutrophils. Together these results signify that TCR expression by the neutrophil plays an important role in the regulation of parasite burden by enhancing the phagocytic capacity of the neutrophil.
KEYWORDS: Plasmodium berghei ANKA, neutrophil, TCRβ
INTRODUCTION
Neutrophils are considered the first line of defense against invading pathogens and injury. Neutrophils perform their protective function against pathogens through phagocytic clearance, release of reactive oxygen species and proteases, and formation of extracellular traps (1). More recent studies depict neutrophils as part of a sophisticated innate surveillance system that influences the downstream immune response by modulating components of the innate and adaptive immune systems (2).
The roles of neutrophils in malaria immunity and pathogenesis are under extensive investigation. In a study of Plasmodium falciparum-infected patients in Thailand, neutrophil granulocyte counts were significantly higher in patients with high parasitemias than in patients with low and moderate parasitemias (3). In vitro studies have demonstrated that the addition of activated neutrophils to P. falciparum cultures suppresses the growth of parasites (4). However, in one study, early depletion of neutrophils with the RB6-8C4 monoclonal antibody during a P. berghei ANKA infection of CBA/NSlc mice did not modify parasitemia, suggesting that neutrophils do not affect parasite growth (5).
In contrast to the unresolved role of neutrophils in regulating parasite density, several studies have established that neutrophils can be pathogenic during a malaria infection. An association of activated neutrophils with parasitized erythrocyte sequestration during pediatric cerebral malaria was recently identified in Malawian children (6), and studies in the strain ANKA murine model have shown that FcεRI+ neutrophils are essential for the pathogenesis of experimental cerebral malaria (ECM) (5, 7). In addition, hemolysis during a malaria infection can result in heme oxygenase-1-dependent neutrophil dysfunction, which impairs the ability of developing neutrophils to mount a competent oxidative burst and consequently causes increased susceptibility to coinfection with nontyphoidal Salmonella (8, 9). Lastly, a recent study suggests that neutrophil activation by type I interferon mediates liver pathology during P. vivax and P. chabaudi malaria (10).
Neutrophils have been generally considered a homogenous population of leukocytes that recognize their targets through a set of invariant receptors. However, recent research has suggested a vast degree of heterogeneity and plasticity in neutrophil populations that are governed by the cellular environment and biological functions being performed (11). Puellmann et al. have identified a subpopulation (5 to 8%) of mammalian neutrophils that express the TCRαβ combinatorial receptor (12). In this study, it was shown that TCRαβ expression in neutrophils is modulated by granulocyte colony-stimulating factor, and stimulation of TCRαβ protects neutrophils from apoptosis and results in increased interleukin-8 (IL-8) secretion. A case study reporting that 80% of circulating neutrophils expressed membrane-bound TCRαβ in a patient diagnosed with autoimmune hemolytic anemia who also displayed extensive neutrophil erythrophagocytosis suggests that TCR expression by the neutrophil can have important consequences in the immunopathogenesis of disease (13).
In this study, we report that early strain ANKA infection induces the expression of combinatorial TCRβ on murine CD11b+ Ly6G+ neutrophils in the spleen. We demonstrate through extensive experimentation that expression of TCRβ by the splenic neutrophil is not an artifact of passive receptor expression or anti-TCRβ binding to a cross-reactive epitope or Fc receptor on the neutrophil. Remarkably, we identified a highly significant correlation in the proportion of splenic neutrophils that express TCRβ and parasite burden on day 3 postinfection. Furthermore, we show that TCRβ expression also associates with enhanced neutrophil phagocytosis of strain ANKA-infected erythrocytes. Our results have improved our knowledge of the biological diversity of neutrophil populations and demonstrate that neutrophil TCRβ may regulate parasite burden by facilitating phagocytosis of parasitized erythrocytes during the early phase of a strain ANKA infection.
RESULTS
Effect of strain ANKA infection on the neutrophil population in the brain and spleen.
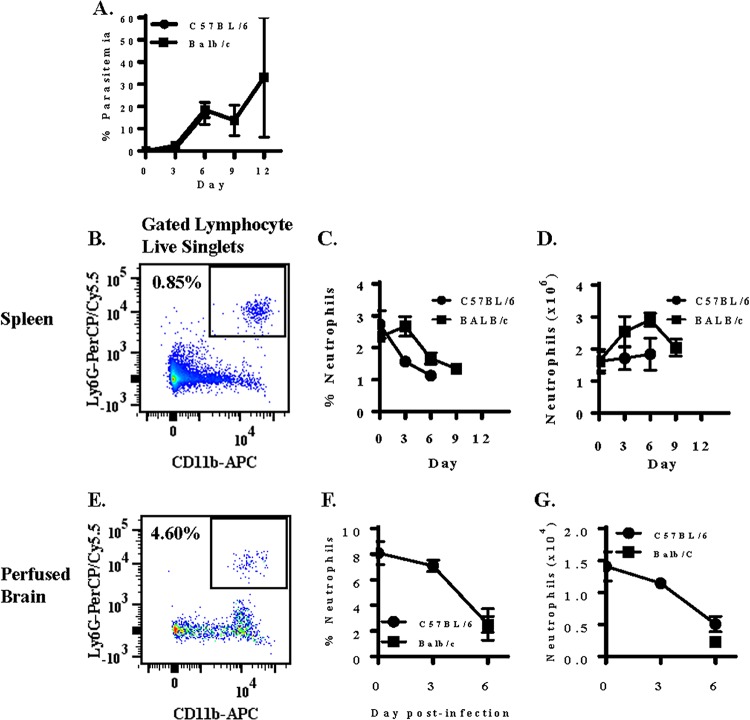
We first measured the effect of a P. berghei ANKA infection (Fig. 1A) on the neutrophil population in the spleen in C57BL/6 mice, which are susceptible to ECM, and BALB/c mice, which are resistant to ECM (Fig. 1B). Although the symptoms displayed and pathogenesis exhibited differ greatly between ECM-susceptible C57BL/6 mice and ECM-resistant BALB/c mice, there was no significant difference in parasitemia between the two strains of mice (Fig. 1A). In naive C57BL/6 mice (n = 5), approximately 2.7% (1.6 × 10⁶) of live lymphocyte singlets are CD11b+ Ly6G+ neutrophils (Fig. 1C). Enumeration of neutrophils on days 3 and 6 postinfection indicates that strain ANKA infection of C57BL/6 mice does not result in expansion of the neutrophil compartment of the spleen. In contrast, the splenic neutrophil compartment of BALB/c mice expanded over the course of a strain ANKA infection; a 1.8-fold expansion of splenic neutrophils from day 0 (1.6 × 10⁶) to day 6 (2.9 × 10⁶) postinfection was observed (Fig. 1D).
FIG 1.
Measurement of neutrophils during a Plasmodium berghei ANKA infection in ECM-susceptible C57BL/6 and -resistant BALB/c mice. Mice were infected with 106 Plasmodium berghei ANKA (Pb-A) parasites. (A to D) Parasitemia was enumerated in the two strains of mice (A), and neutrophils were quantitated by measuring the expression of CD11b and Ly6G on live lymphocyte singlets in spleen tissue (B) and plotted as proportion (C) and absolute number (D) over the course of a strain ANKA infection. (E to G) Neutrophils were also quantitated in perfused brain tissue (E), and the percentage (F) and absolute number (G) of brain-sequestered leukocytes that were CD11b+ Ly6G+ neutrophils was also determined in perfused brain tissue of susceptible C57BL/6 mice on days 0, 3, and 6 postinfection and resistant BALB/c mice on day 6 postinfection. n = 5 (spleen) and n = 4 (brain) for each time point for each strain of mouse, and results presented are representative of three independent experiments.
We also quantitated the number of sequestered neutrophils in perfused brain tissue (Fig. 1E to G) of ECM-susceptible C57BL/6 mice on days 0, 3, and 6 postinfection and ECM-resistant BALB/c mice on day 6 postinfection. In naive C57BL/6 mice, 8.1% (1.4 × 10⁴ ± 0.2 × 10⁴) of live brain-sequestered leukocytes (BSLs) were CD11b+ Ly6G+ neutrophils. On day 3 postinfection, 7.1% (1.1 × 10⁴ ± 0.1 × 10⁴) of live BSLs were neutrophils. By day 6 postinfection, when ECM-susceptible C57BL/6 mice are moribund, only 2.5% (0.5 × 10⁴ ± 0.1 × 10⁴) of live BSLs were CD11b+ Ly6G+ neutrophils. A 2.8-fold decrease in brain-sequestered neutrophils in naive versus moribund C57BL/6 mice was unexpected and is contrary to the observed 14.3-fold increase in brain-sequestered CD8+ T cells (data not shown). However, a paucity of brain-sequestered neutrophils during the cerebral phase is consistent with previous findings demonstrating that neutrophils are pathogenic during the early phase of ECM (5).
Strain ANKA infection induces expansion of a novel population of TCRβ-expressing neutrophils.
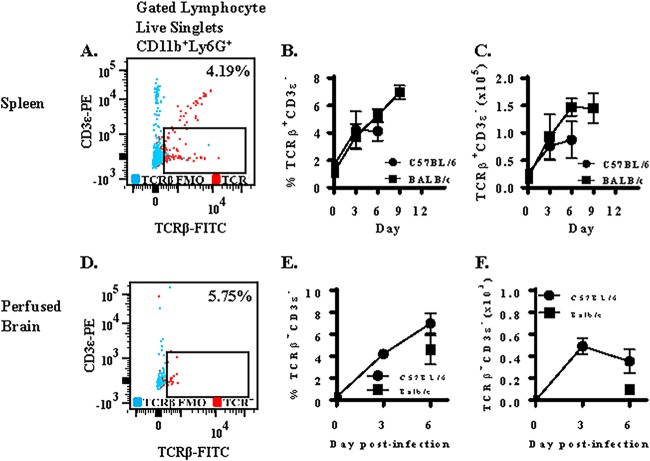
Previous studies report that a small subset of neutrophils expresses TCRαβ in humans and mice. We measured the effect of strain ANKA infection on the expression of TCRβ on neutrophils in spleen tissue of C57BL/6 and BALB/c mice. In response to strain ANKA infection, we observed expansion of a subset of neutrophils that expressed TCRβ but was negative for the T lymphocyte marker CD3ε (Fig. 2A). This population of TCRβ+ CD3ε− neutrophils was also CD4− CD8− and F4/80− (data not shown). In C57BL/6 mice, only 1.6% (2.5 × 10⁴) of neutrophils were TCRβ+ and CD3ε− in naive mice. However, 4.2% (7.6 × 10⁴) and 4.1% (8.7 × 10⁴) of neutrophils were TCRβ+ CD3ε− on days 3 and 6 postinfection with strain ANKA, respectively (Fig. 2B). Therefore, early but not late infection of C57BL/6 mice with strain ANKA caused a significant increase (3.5-fold) in the absolute number of TCRβ+ CD3ε− neutrophils (Fig. 2C). Importantly, this novel population of TCRβ-expressing neutrophils selectively expanded in the neutrophil compartment of the spleen that otherwise remained unaltered in size in response to parasitemia (Fig. 1D). In BALB/c mice, there was a 5.5-fold increase in the number of TCRβ+ CD3ε− neutrophils from day 0 to day 3 and a 1.6-fold increase from day 3 to day 6 in BALB/c spleen tissue (Fig. 2C), indicating that TCRβ+ CD3ε− neutrophils expanded significantly from day 0 to day 6 postinfection in spleen tissue.
FIG 2.
Plasmodium berghei ANKA induces expression of TCRβ on neutrophils in C57BL/6 and BALB/c mice. Mice were infected with 106 Plasmodium berghei ANKA (Pb-A) parasites. The proportion of neutrophils that were TCRβ+ CD3ε− (A) was then determined and graphed as proportion (B) and absolute number (C) during a strain ANKA infection in C57BL/6 and BALB/c mice. (D) TCRβ and CD3ε expression was also measured on brain-sequestered neutrophils of susceptible C57BL/6 mice on days 0, 3, and 6 postinfection and resistant BALB/c mice on day 6 postinfection. Findings are presented as proportion (E) and absolute number (F). A fluorescence-minus-one control for TCRβ was used for gating purposes. n = 5 (spleen) and n = 4 (brain) for each time point for each strain of mouse, and results presented are representative of three independent experiments.
We also quantitated the proportion and number of neutrophils that express TCRβ in perfused brain tissue of ECM-susceptible C57BL/6 mice on days 0, 3, and 6 postinfection and ECM-resistant BALB/c mice on day 6 postinfection (Fig. 2D to F). In C57BL/6 mice, TCRβ expression on brain-sequestered neutrophils increased over the course of infection and was similar to TCRβ expression on splenic neutrophils. We observed no significant difference in the proportion of neutrophils that express TCRβ in the brain (6.0%) versus the spleen (4.1%), indicating that TCRβ-expressing neutrophils do not preferentially migrate to the brain. However, on day 6 postinfection, we observed a 4.4-fold difference in brain-sequestered TCRβ+ neutrophils between moribund C57BL/6 and resistant BALB/c mice that approached significance (P value of 0.057 by Mann-Whitney test).
Measurement of TCRβ on neutrophils isolated from nude and rag1 knockout mice.
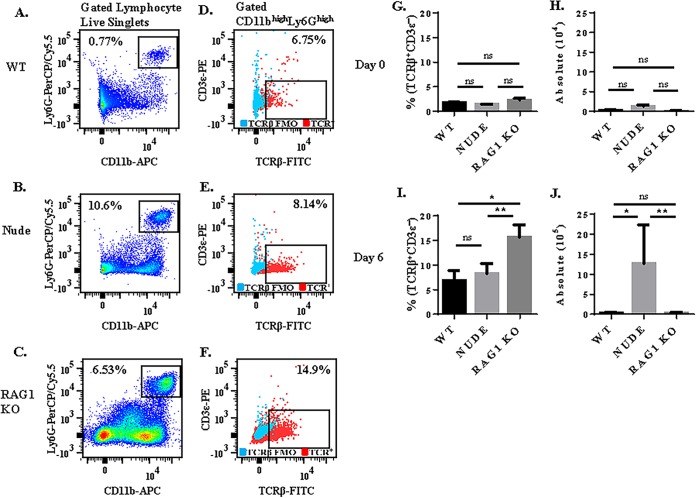
To confirm that observed TCRβ expression by the neutrophil was not due to phagocytosis or trogocytosis of peripheral T cells, we compared expression of TCRβ on the surface of splenic neutrophils in C57BL/6 wild-type (WT) versus nude (which lack T cells) and rag1 knockout (KO; which lack T and B cells) mice on the C57BL/6 background (Fig. 3A to F).
FIG 3.
Comparison of TCRβ expression on neutrophils in C57BL/6 wild-type versus nude and rag1 knockout mice. Mice were infected with 106 Plasmodium berghei ANKA (Pb-A) parasites, and TCRβ expression was compared in gated CD11b+ Ly6G+ neutrophils isolated from wild-type (A and D) versus nude (B and E) and rag1 knockout (C and F) spleen tissue. The proportion of neutrophils that express TCRβ and the absolute number of TCRβ-expressing neutrophils was compared in naive mice (G and H) and in strain ANKA-infected mice on day 6 postinfection (I and J). Absence of peripheral T cells in nude and Rag1 knockout mice did not reduce TCRβ expression by neutrophils. A fluorescence-minus-one control was used to select the gate for TCRβ. n = 5 for each time point for each group of mice, and results presented are representative of two independent experiments. ns, not significant; *, P < 0.05; **, P < 0.01 (P values calculated using the Mann-Whitney U test).
Previous studies have shown that nude (14) and rag1 KO (15) mice are resistant to ECM. Consistent with these studies, in our hands, following strain ANKA infection, nude and rag1 KO mice did not exhibit symptoms of ECM, whereas 100% of WT mice were moribund. In naive mice, we observed no significant difference in the proportion (Fig. 3G) of splenic neutrophils that expressed TCRβ or the absolute number (Fig. 3H) of TCRβ-expressing neutrophils in WT versus nude and rag1 KO mice (Fig. 3G). On day 6 postinfection, a significantly higher proportion of lymphocyte live singlets were CD11b+ Ly6G+ neutrophils in nude (10.6%) and rag1 KO (6.53%) mice compared to WT controls (0.77%). While a similar proportion of neutrophils expressed TCRβ in nude (8.7%) versus WT (6.8%) mice (P value 0.35 by Mann-Whitney test), a significantly higher proportion (14.9%) of neutrophils expressed TCRβ in rag1 KO mice than in WT mice (P value of 0.018 by Mann-Whitney test) (Fig. 3I). However, because rag1 KO mice had very small spleens, when normalized for cell volume, there was no significant difference between the absolute number of TCRβ-expressing neutrophils in WT (3.0 × 10⁴) and rag1 KO (2.8 × 10⁴) mice. However, due to an abundance of splenic neutrophils likely caused by immune compensatory mechanisms (10.6% of lymphocyte live singlets were neutrophils in nude mice compared to 0.77% in WT mice), nude mice had 42-fold more TCRβ-expressing neutrophils than WT mice (Fig. 3J). In summary, these results demonstrate that the proportion of neutrophils that express TCRβ is not increased by the presence of peripheral T cells in WT mice.
Neutrophils express comparable levels of TCRβ transcript and protein.
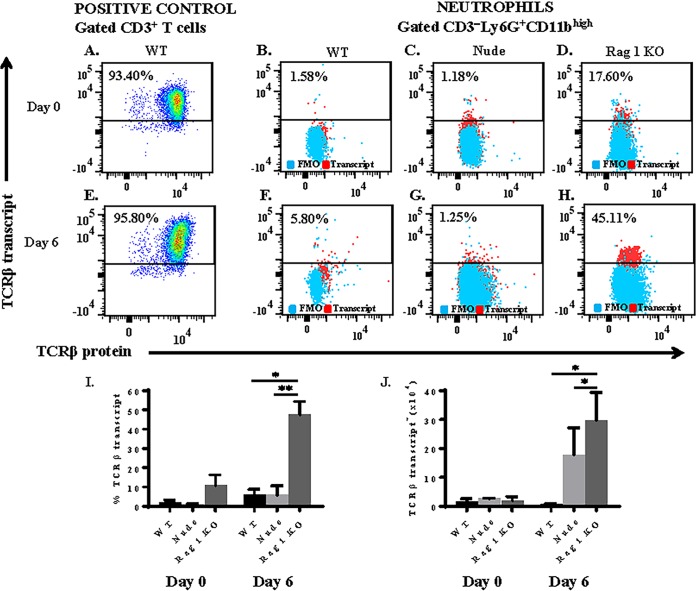
To verify that TCRβ expression by the neutrophil was not a consequence of anti-TCRβ binding to an Fc receptor or a cross-reactive epitope on the neutrophil, we measured intracellular transcript levels of mouse T cell receptor beta, constant region 1 (TRBC1), using a flow cytometry-based PrimeFlow RNA assay (Fig. 4A to H). This assay detects RNA using a set of 40 short oligonucleotide probes specific for a target gene. Due to the small size of each oligonucleotide probe, a single-nucleotide difference in TRBC1 transcript will prevent hybridization of the probe to TRBC1 RNA. In WT mice, the proportion of splenic neutrophils that express TCRβ transcript increased from 2.1% to 5.8% from day 0 to day 6 postinfection with strain ANKA (Fig. 4I). Importantly, the proportion of neutrophils that express TCRβ transcript was similar to the proportion of neutrophils that express TCRβ protein in both naive and strain ANKA-infected mice (Fig. 2B and 3G and I). Similar results were observed in nude mice: the percentage of splenic neutrophils that express TCRβ transcript increased from 1.1% (day 0) to 6.5% (day 6). In rag1 KO mice, 10.9% of neutrophils expressed TCRβ transcript in naive mice, and this proportion increased to 47.6% by day 6 postinfection. Therefore, strain ANKA infection induced TCRβ transcription in neutrophils in all three types of mice. Consistent with protein results, a significantly higher proportion of neutrophils expressed TCRβ transcript in rag1 KO compared to WT and nude mice (Fig. 4).
FIG 4.
Plasmodium berghei ANKA infection induces expression of TCRβ mRNA by neutrophils. Mice were infected with 106 strain ANKA parasites, and TCRβ transcription was assessed by the PrimeFlow RNA assay. (A and E) Abundant levels of TCRβ mRNA were observed in positive-control CD3ε+ T cells isolated from spleen tissue of naive and strain ANKA wild-type mice. TCRβ mRNA was also quantitated in gated CD3ε− CD11b+ Ly6G+ neutrophils isolated from naive (day 0) and strain ANKA-infected (day 6) C57BL/6 wild-type (B and F), nude (C and G), and rag1 knockout (D and H) spleen tissue. Results are presented as proportion of neutrophils that express TCRβ transcript (I) and absolute number of TCRβ transcript-expressing neutrophils (J). A fluorescence-minus-one (FMO) control was used to select the gate for TCRβ transcript, and values plotted were calculated by subtracting the background in each FMO control from its corresponding sample. Results shown are representative of two independent experiments. *, P < 0.05; **, P < 0.01 (P values calculated using the Mann-Whitney U test).
Neutrophils preferentially use Vβ3 and Vβ8.1/8.2 TCR subtypes.
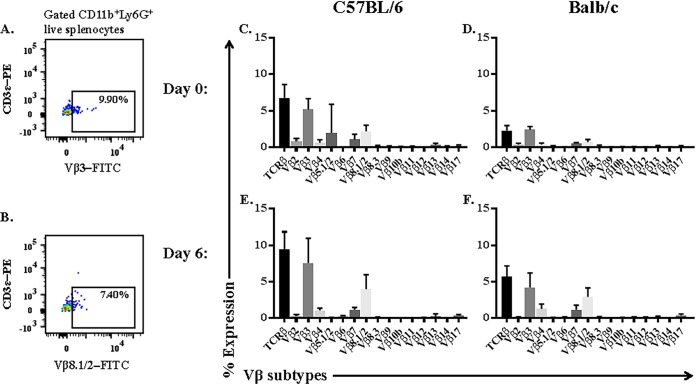
We measured the expression of 15 Vβ TCR subtypes on the splenic neutrophil by flow cytometry to assess the diversity of and preference for Vβ subtypes (Fig. 5A and B). In this experiment, CD11b+ Ly6G+ neutrophils expressed an array (Vβ2, Vβ3, Vβ4, Vβ5.1/2, Vβ7, and Vβ8.1/8.2) of subtypes (Fig. 5C to F). However, neutrophils isolated from both C57BL/6 and BALB/c mice preferentially expressed the Vβ3 subtype and, to a lesser degree, the Vβ8.1/2 subtype. For example, on day 6 postinfection, when 9.4% ± 1.1% of neutrophils in C57BL/6 mice expressed TCRβ, the majority of these neutrophils expressed the Vβ3 subtype. Importantly, Vβ3 was the dominant subtype on neutrophils in both naive and strain ANKA-infected mice, and we note that although strain ANKA infection increased the proportion of neutrophils that express TCRβ, it did not dramatically influence the diversity of and preference for Vβ subtypes.
FIG 5.
Analysis of the TCR Vβ repertoire of splenic neutrophils during Plasmodium berghei ANKA (Pb-A) infection of C57BL/6 and BALB/c mice. Mice were infected with strain ANKA, and expression of 15 Vβ TCR subtypes was then assessed by flow cytometry. (A and B) Vβ subtype expression was measured on gated CD11b+ Ly6G+ splenic neutrophils in naive (C and D) and strain ANKA-infected (E and F) C57BL/6 and BALB/c mice. An FITC channel fluorescence-minus-one control was used to select the most appropriate gate that was applied to all Vβ subtypes. n = 5 for each time point for each strain of mice, and results presented are representative of two independent experiments.
Neutrophil TCRβ undergoes productive gene rearrangements.
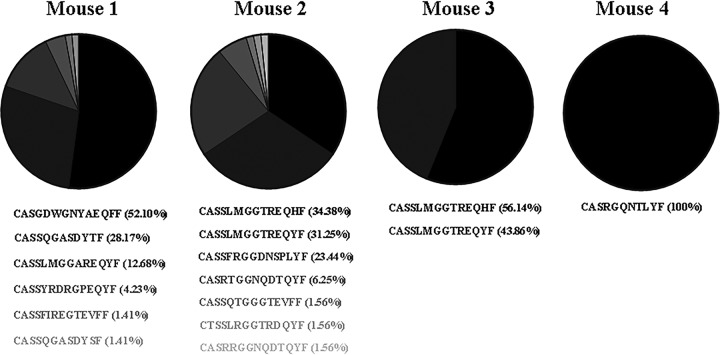
We next sequenced the complementarity-determining region 3 (CDR3) of TCRβ transcripts purified from approximately 1,000 TCRβ+ CD3ε− CD11b+ LyG+ neutrophils sorted from splenocytes isolated from four individual C57BL/6 mice exhibiting symptoms of ECM on day 6 postinfection with strain ANKA using an established protocol (16) (Fig. 6). Using this approach, we found that neutrophil TCRβ was capable of undergoing productive gene rearrangements. We also used this molecular method to measure the diversity of the TCRβ repertoire in the neutrophil population. We analyzed a minimum of 50 productive TCRβ rearranged sequences per mouse and found that the repertoire of TCRβ was limited (mice expressed only 1 to 7 types of TCRβ), and each mouse expressed a dominant TCRβ CDR3 region, indicating preferred usage.
FIG 6.
Repertoire of productive TCRβ gene rearrangements. Mice were infected with strain ANKA, and unbiased molecular analysis of T cell receptor expression was performed on TCRβ+ CD3ε− CD11b+ Ly6G+ neutrophils sorted from spleen tissue of four moribund mice. Although neutrophil TCRβ undergoes productive gene rearrangements, neutrophil TCRβ has a restricted repertoire and displays preferred usage.
TCRβ expression on CD11b+ Ly6G+ neutrophils correlates with parasite burden on day 3 after strain ANKA infection.
It is well recognized that neutrophils are critical during the early immune response to acute infections. Remarkably, on day 3 postinfection, we observed a highly significant positive correlation (P value of ≤0.01, Pearson r correlation R2 value of 0.92) between the proportion of splenic neutrophils that were TCRβ+ CD3ε− and peripheral parasitemia in individual C57BL/6 mice (Fig. 7); a smaller percentage of neutrophils were TCRβ+ CD3ε− in mice with low parasitemia than in mice with high parasitemia. A similar but less significant correlation was also observed in BALB/c mice (data not shown). However, on day 6 postinfection, there was no significant correlation between the proportion of neutrophils that were TCRβ+ CD3ε− and peripheral parasitemia. These results suggest that rising parasite burden is driving the expansion of TCRβ-expressing neutrophils. In turn, this could play an important role in regulating parasite burden during the early phase of a strain ANKA infection, which fits the prescribed role of neutrophils in early host defense.
FIG 7.
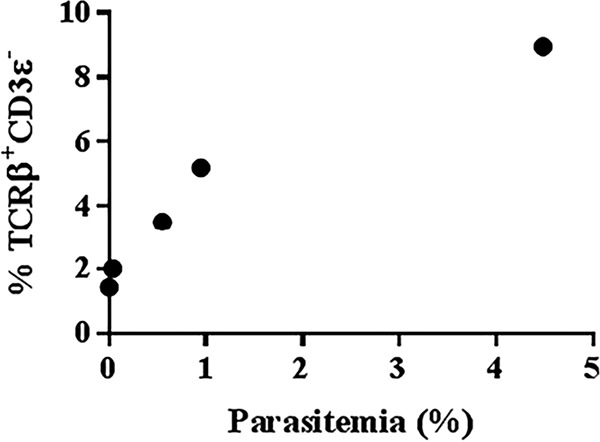
TCRβ expression by the neutrophil correlates with parasite burden on day 3 postinfection with Plasmodium berghei ANKA. On day 3 postinfection, the percentage of live singlet CD11b+ Ly6G+ neutrophils in the spleen that are TCRβ+ CD3ε− was correlated with peripheral parasitemia (parasitized erythrocytes/total erythrocytes × 100) in five individual mice. Results presented are representative of four independent experiments. P ≤ 0.01; Pearson r correlation R2 value of 0.92.
TCRβ+ neutrophils display enhanced phagocytosis of pRBC compared to TCRβ− neutrophils.
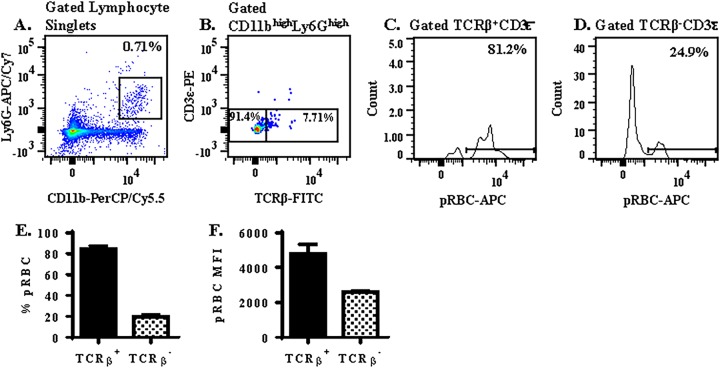
To better understand whether neutrophil TCRβ plays a role in regulating parasite burden during a strain ANKA infection, we measured the effect of TCRβ expression on the ability of neutrophils to phagocytose parasitized erythrocytes in an in vitro assay. In this assay, splenocytes isolated from day 3 strain ANKA-infected C57BL/6 mice were labeled with neutrophil (Ly6G and CD11b) and T cell (TCRβ and CD3ε) markers and incubated for 90 min at 37°C with CellTrace-labeled parasitized red blood cells (pRBC) also isolated from day 3 strain ANKA-infected C57BL/6 mice. Phagocytosis of pRBC by gated TCRβ+ versus TCRβ− CD11b+ Ly6G+ neutrophils was then compared by flow cytometry (Fig. 8A to D). Remarkably, expression of TCRβ was associated with enhanced phagocytosis of pRBC by the neutrophil; 84.3% ± 3.2% of TCRβ+ versus 19.9% ± 2.7% TCRβ− samples were CellTrace-allophycocyanin (APC) positive by flow cytometric analysis (Fig. 8E). Furthermore, we also compared the CellTrace-APC median fluorescence intensity (MFI) of CellTrace-positive TCRβ+ versus TCRβ− neutrophils. The MFI of TCRβ+ neutrophils (4,784 ± 521) was significantly higher (1.8-fold) than that of TCRβ− neutrophils (2,601 ± 103) (Fig. 8F), suggesting that each TCRβ+ neutrophil had phagocytosed a greater number or different stage of pRBC than each TCRβ− neutrophil. Together, these results demonstrate a strong positive association between TCRβ expression and neutrophil phagocytosis of pRBC.
FIG 8.
TCRβ+ neutrophils display enhanced phagocytosis of pRBC compared to TCRβ− neutrophils. (A to D) The ability of CD11b+ Ly6G+ neutrophils (A) that are TCRβ+ versus TCRβ− (B) to phagocytose pRBC (C and D) after 90 min was analyzed in an in vitro phagocytosis assay consisting of a 1:1 ratio of pRBC (labeled with CellTrace Far Red), and splenocytes (stained with neutrophil and T cell markers) isolated from C57BL/6 mice on day 3 postinfection with strain ANKA. (E) The percentage of neutrophils that phagocytosed pRBC was compared in TCRβ+ versus TCRβ− neutrophils. (F) In addition, the pRBC MFI was compared in TCRβ+ versus TCRβ− neutrophils that had undergone phagocytosis to determine if TCRβ expression influenced the quantity of pRBC phagocytosed by a single neutrophil. A fluorescence-minus-one control was used to select the gate for TCRβ. n = 3 for each phagocytosis assay, and results presented are a replicate from three independent experiments.
DISCUSSION
Since the discovery of TCR in 1984 (17, 18), it is widely accepted that expression of this molecule is limited to T lymphocytes. Combinatorial rearrangement permits T cells to express antigen-specific TCR combinations that enable recognition of potentially inordinate numbers of existing and emerging pathogens that a host may encounter over a lifetime. On the other hand, nonlymphoid cells are known to express invariant receptors for nonspecific phagocytic clearance of invading pathogens as a part of early host defense (19). However, in recent years, a few studies have reported TCR expression by nonlymphoid cells (20), including neutrophils, eosinophils, and monocytes/macrophages. In 2006, Puellmann et al. reported that a subpopulation (5 to 8%) of human neutrophils expressed TCRαβ, and engagement of the neutrophil TCRαβ complex inhibited apoptosis and increased IL-8 secretion (12). A case report documenting that 80% of circulating neutrophils expressed TCR in a patient diagnosed with autoimmune hemolytic anemia who also displayed abundant neutrophil erythrophagocytosis suggests that neutrophil TCR plays a biologically relevant role in the immunopathogenesis of disease (13). Likewise, macrophages have also been shown to express TCR, and high numbers of TCRαβ-bearing macrophages have been reported in tuberculosis granulomas (21), atherosclerotic lesions (22), and the tumor microenvironment (23).
In this study, we report that early infection with P. berghei ANKA malaria results in significant expansion of TCRβ-expressing CD11b+ Ly6G+ neutrophils in the splenic compartment of C57BL/6 and BALB/c mice. Importantly, we demonstrate experimentally that the observed malaria-induced expression of TCRβ by the neutrophil is not simply an artifact of (i) passive receptor expression via phagocytosis or trogocytosis of peripheral T cells or (ii) nonspecific anti-TCRβ binding to a cross-reactive epitope or Fc receptor on the neutrophil surface. Strain ANKA infection induces expression of both TCRβ transcript and protein in neutrophils isolated from nude (which lack T cells) and rag1 knockout (which lack T and B cells) mice, eliminating the likelihood that peripheral T cells are the source of neutrophil TCRβ. In addition, measurement of TCRβ RNA in neutrophils by PrimeFlow, molecular analysis of the TCRβ repertoire by template switch PCR of neutrophil RNA, and demonstration of preferential usage of Vβ by neutrophils using a flow cytometry-based Vβ TCR screening panel confirm that expression of TCR by the neutrophil is not a consequence of nonspecific binding of the H57-597 clone of anti-TCRβ to a non-TCRβ epitope on the neutrophil.
An unexpected result of our study was that TCRβ-expressing neutrophils were CD3ε−. On classical T cells, TCR forms a complex with CD3. This complex consists of two TCR chains (usually αβ) and six CD3 chains (δε, γε, and ζζ). While it is difficult to conceive how TCR can operate in the absence of CD3ε, previous studies of TCR-expressing neutrophils (12) and macrophages (21) also reported undetectable levels of CD3ε. Detection of high levels of TCRβ transcript and protein on neutrophils in rag1 KO mice in our study and the Puellmann et al. study support the notion that the requirements for TCR expression differ between lymphoid and nonlymphoid cells. Future studies in our laboratory will be directed at defining the TCR machinery in myeloid cells of the immune system.
A signature finding of our study was that there was a highly significant correlation between the proportion of splenic neutrophils that express TCRβ and parasitemia in the peripheral blood of individual C57BL/6 mice on day 3 postinfection. This finding suggests that parasite burden influences the recruitment of TCRβ-expressing neutrophils from the bone marrow (the site of neutrophil production) to the spleen (the site of parasite clearance) during the early phase of a strain ANKA infection.
An important function of the neutrophil is the phagocytosis of invading pathogens. In an in vitro phagocytosis assay, we found that TCRβ+ neutrophils phagocytosed pRBC with considerably higher efficiency than TCRβ− neutrophils; 84.3% of TCRβ+ versus 19.9% of TCRβ− neutrophils had phagocytosed pRBC in this in vitro phagocytosis assay, indicating that TCRβ expression by neutrophils contributes toward regulation of parasite density prior to acquisition of adaptive immunity. This strong association between TCRβ expression by the neutrophil and erythrophagocytosis of pRBC is reminiscent of the case report documenting massive induction of TCR expression by neutrophils in a patient diagnosed with autoimmune hemolytic anemia who also displayed extensive neutrophil erythrophagocytosis (13).
In summary, our findings demonstrate a highly significant correlation between TCRβ expression and (i) parasite burden and (ii) neutrophil phagocytic capacity, warranting further investigation of a novel immune mechanism whereby induction of TCRβ expression by the neutrophil regulates parasite burden by enhancing phagocytosis of parasitized erythrocytes during the innate immune response to a strain ANKA infection.
MATERIALS AND METHODS
Mice and parasite infections.
Six- to 10-week-old female C57BL/6, BALB/c, B6.129S7-Rag1tm1Mom/J, and B6.Cg-Foxn1nu/J (nude) mice purchased from The Jackson Laboratory (Bar Harbor, ME) were maintained at the Food and Drug Administration animal care facility and treated in accordance with the guidelines of the Animal Care and Use Committee. For infections, a donor mouse was first injected with a thawed vial of an uncloned line of strain ANKA parasites. When peripheral parasitemia reached approximately 5%, blood was collected from the donor mouse and diluted in phosphate-buffered saline (PBS) to 107 parasites/ml. Experimental mice were then infected by intraperitoneal injection of 106 parasites in a 100-μl volume. Infected mice were monitored for clinical symptoms of ECM as previously described (24–26), and thin blood films were prepared to assess parasite burden. Parasite burden in peripheral blood was enumerated by calculating the percent parasitemia (parasitized erythrocytes/total erythrocytes × 100) of Giemsa-stained thin blood films.
Flow cytometry.
Expression of TCRβ and the Vβ subtypes on the neutrophil was assessed by flow cytometry, as previously described (26, 27), in C57BL/6, BALB/c, nude, and rag1 KO mice. Expression of TCRβ was measured on splenic and brain-sequestered neutrophils. Briefly, a single-cell suspension was prepared from spleens of naive and strain ANKA-infected mice harvested on days 3, 6, and 9 postinfection. This single-cell suspension was subjected to ACK (Gibco by Life Technologies) lysis for 4 min to eliminate erythrocytes, and lymphocytes were then stained with efluor 506 viability dye (eBiosciences, Santa Clara, CA) for 30 min, washed three times, and then seeded at 106 cells/100 μl of staining buffer (Hanks' balanced salt solution [HBSS] containing 1% bovine serum albumin [BSA]). A single-cell suspension of brain-sequestered leukocytes isolated from perfused brain tissue of C57BL/6 and BALB/c mice was prepared by treatment with DNase (3 U/ml) and collagenase (0.5 mg/ml) (Roche Applied Sciences, Indianapolis, IN) for 1 h at room temperature, followed by purification by centrifugation at 515 × g for 30 min at 21°C on 33% Percoll (Sigma-Aldrich, Saint Louis, MO). Lymphocytes were then blocked with TruStain FcX (anti-mouse CD16/32) (BioLegend, San Diego, CA) for 15 min, stained with APC anti-mouse/human CD11b, peridinin chlorophyll protein (PerCP)/Cy5.5 anti-mouse Ly-6G, fluorescein isothiocyanate (FITC) anti-mouse TCRβ chain (clone H57-597), phycoerythrin (PE) anti-mouse CD3ε, Alexa Fluor 700 anti-mouse CD4, and APC/Cy7 anti-mouse CD8a antibodies, purchased from BioLegend (San Diego, CA) for 30 min, and washed three times with wash buffer (HBSS containing 0.1% BSA and 0.05% sodium azide). All incubations were performed at 4°C and were protected from light. Unfixed cells were resuspended in 150 to 200 μl of wash buffer and then acquired on an LSR Fortessa X-20 (BD Biosciences, San Jose, CA). All data analysis was performed using FlowJo software. Importantly, a fluorescence-minus-one control was used to determine the appropriate gate for TCRβ. Expression of Vβ2, Vβ3, Vβ4, Vβ5.1, 5.2, Vβ6, Vβ7, Vβ8.1,8.2, Vβ8.3, Vβ9, Vβ10b, Vβ11, Vβ12, Vβ13, Vβ14, and Vβ17a TCR was also measured on splenic neutrophils isolated from C57BL/6 and BALB/c mice on days 0 and 6 postinfection with strain ANKA using the mouse Vβ screening panel (BD Biosciences, San Jose, CA).
PrimeFlow RNA assay.
The PrimeFlow RNA assay (eBiosciences, Santa Clara, CA) was used to compare transcript levels of the mouse T cell receptor beta, constant region 1 (TRBC1), gene in naive and infected (day 6) wild-type, nude, and rag1 KO mice on the C57BL/6 background. Splenocytes isolated from strain ANKA-infected mice were treated with ACK buffer (Gibco by Life Technologies) to remove erythrocytes, stained with efluor 506 viability dye (eBiosciences), incubated with TruStain FcX (anti-mouse CD16/32) (BioLegend, San Diego, CA), and then stained with antibodies specific for extracellular neutrophil markers (CD11b and Ly-6G) and T cell markers (TCRβ and CD3ε). To prepare cells for target probe hybridization, cells were fixed with fixation buffer 1 for 30 min at 4°C, washed 3 times with permeabilization buffer containing RNase inhibitors, fixed again with fixation buffer 2 for 60 min at room temperature, and then washed 3 times. Cells were then incubated with a target probe specific for the trbc1 gene for 2 h at 40°C in a hybridization oven. Amplification of signal was then performed in three sequential hybridization steps; briefly, cells were first incubated with preamplifier DNA (which hybridizes to the target probe) for 1.5 h at 40°C, incubated with amplifier DNA (which hybridizes to the preamplifier molecules) for 1.5 h at 40°C, and lastly incubated with label probe oligonucleotide (which hybridizes to the amplifier molecules) conjugated to the Alexa Fluor 647 fluorescent dye for 1 h at 40°C. When possible, a minimum of 200,000 lymphocyte events were acquired on an LSR Fortessa X-20 (BD Biosciences, San Jose, CA).
Unbiased molecular analysis of TCR expression by neutrophils.
Unbiased quantification and characterization of all expressed TCR gene products within CD11b+ Ly6G+ neutrophils was performed using an established protocol (16). Approximately 1,000 CD11b+ Ly6G+ TCRβ+ CD3ε− neutrophils sorted from spleen tissue of moribund C57BL/6 mice on day 6 postinfection with strain ANKA were snap frozen in RNAlater and stored at −80°C until use. mRNA was extracted from TCRβ-expressing neutrophils using the Oligotex direct mRNA minikit (Qiagen, Valencia, CA), and cDNA was then synthesized using the SMARTer PCR cDNA synthesis kit (Clontech, Mountain View, CA). The MuMBC primer (TGGCTCAAACAAGGAGACCT), specific for mouse TRBC (Eurofins, Huntsville, AL), permits sequencing across the CDR3 region of the TCR gene and was used for PCR amplification of rearranged TCR products. After amplification, TCR gene products were run on a 1% agarose gel, and amplicons that were appropriate in size (500 to 700 bp) were extracted from the gel and purified using the NucleoSpin extract II kit (Clontech, Mountain View, CA). Each TCR gene product was then ligated into the pGEM-T Easy vector and transformed into competent Escherichia coli cells. After transformation, a minimum of 50 colonies were picked for amplification of plasmid inserts using the commercially obtained M13F (TTTTCCCAGTCACGAC) and M13R (CAGGAAACAGCTATGAC) primers (Eurofins, Huntsville, AL). Amplified products were then run on a 1% agarose gel to confirm sizes of products prior to sequencing using MuMBC primer. Alignment of the sequences was performed using the IMGT/V-QUEST alignment tool for TCR nucleotide sequences.
Phagocytosis assay.
The effect of TCRβ on the ability of neutrophils to phagocytose parasitized red blood cells (pRBC) during a strain ANKA infection was assessed in an in vitro assay. This in vitro phagocytosis assay was performed using a 1:1 ratio of pRBC (labeled with CellTrace Far Red [Invitrogen, Carlsbad, CA]) and splenocytes (labeled with neutrophil and T cell markers) isolated from C57BL/6 mice at postinfection day 3. A single-cell suspension of harvested spleen was prepared and subjected to ACK (Gibco by Life Technologies) lysis to eliminate RBC. A total of 106 lymphocytes were then blocked with TruStain FcX (anti-mouse CD16/32) (BioLegend, San Diego, CA) and stained with neutrophil (PerCP/Cy5.5 anti-mouse/human CD11b and APC/Cy7 anti-mouse Ly-6G) and T cell (FITC anti-mouse TCRβ chain and PE anti-mouse CD3ε) markers. A total of 105 CellTrace-labeled pRBC and 105 antibody-labeled splenocytes were then mixed together and incubated at 37°C. After 90 min of incubation, samples were then washed once with PBS prior to acquisition on a FACSCanto II flow cytometer (BD Biosciences, San Jose, CA). Phagocytosis of CellTrace Far Red pRBC by TCRβ+ versus TCRβ− neutrophils was compared using FlowJo software. A fluorescence-minus-one control was used to select an appropriate gate to distinguish TCRβ+ from TCRβ− neutrophils.
Statistics.
Differences in cell proportions and counts were determined using the Mann-Whitney U test. Correlation between the proportion of neutrophils that were TCRβ+ CD3ε− and peripheral parasitemia was determined using the Pearson correlation coefficient.
ACKNOWLEDGMENTS
This research was supported by intramural funding from the Food and Drug Administration.
We thank the Center for Biologics Evaluation and Research veterinary staff for the care and maintenance of mice.
REFERENCES
- 1.Deniset JF, Kubes P. 2016. Recent advances in understanding neutrophils. F1000 Res 5:2912. doi: 10.12688/f1000research.9691.1. [DOI] [PMC free article] [PubMed] [Google Scholar]
- 2.Nathan C. 2006. Neutrophils and immunity: challenges and opportunities. Nat Rev Immunol 6:173–182. doi: 10.1038/nri1785. [DOI] [PubMed] [Google Scholar]
- 3.Kotepui M, Piwkham D, PhunPhuech B, Phiwklam N, Chupeerach C, Duangmano S. 2015. Effects of malaria parasite density on blood cell parameters. PLoS One 10:e0121057. doi: 10.1371/journal.pone.0121057. [DOI] [PMC free article] [PubMed] [Google Scholar]
- 4.Nnalue NA, Friedman MJ. 1988. Evidence for a neutrophil-mediated protective response in malaria. Parasite Immunol 10:47–58. doi: 10.1111/j.1365-3024.1988.tb00202.x. [DOI] [PubMed] [Google Scholar]
- 5.Chen L, Zhang Z, Sendo F. 2000. Neutrophils play a critical role in the pathogenesis of experimental cerebral malaria. Clin Exp Immunol 120:125–133. doi: 10.1046/j.1365-2249.2000.01196.x. [DOI] [PMC free article] [PubMed] [Google Scholar]
- 6.Feintuch CM, Saidi A, Seydel K, Chen G, Goldman-Yassen A, Mita-Mendoza NK, Kim RS, Frenette PS, Taylor T, Daily JP. 2016. Activated neutrophils are associated with pediatric cerebral malaria vasculopathy in Malawian children. mBio 7:e01300-. doi: 10.1128/mBio.01300-15. [DOI] [PMC free article] [PubMed] [Google Scholar]
- 7.Porcherie A, Mathieu C, Peronet R, Schneider E, Claver J, Commere PH, Kiefer-Biasizzo H, Karasuyama H, Milon G, Dy M, Kinet JP, Louis J, Blank U, Mecheri S. 2011. Critical role of the neutrophil-associated high-affinity receptor for IgE in the pathogenesis of experimental cerebral malaria. J Exp Med 208:2225–2236. doi: 10.1084/jem.20110845. [DOI] [PMC free article] [PubMed] [Google Scholar]
- 8.Cunnington AJ, de Souza JB, Walther M, Riley EM. 2011. Malaria impairs resistance to Salmonella through heme- and heme oxygenase-dependent dysfunctional granulocyte mobilization. Nat Med 18:120–127. doi: 10.1038/nm.2601. [DOI] [PMC free article] [PubMed] [Google Scholar]
- 9.Orf K, Cunnington AJ. 2015. Infection-related hemolysis and susceptibility to Gram-negative bacterial co-infection. Front Microbiol 6:666. doi: 10.3389/fmicb.2015.00666. [DOI] [PMC free article] [PubMed] [Google Scholar]
- 10.Rocha BC, Marques PE, Leoratti FM, Junqueira C, Pereira DB, Antonelli LR, Menezes GB, Golenbock DT, Gazzinelli RT. 2015. Type I interferon transcriptional signature in neutrophils and low-density granulocytes are associated with tissue damage in malaria. Cell Rep 13:2829–2841. doi: 10.1016/j.celrep.2015.11.055. [DOI] [PMC free article] [PubMed] [Google Scholar]
- 11.Garley M, Jablonska E. 2017. Heterogeneity among neutrophils. Arch Immunol Ther Exp (Warsz) 66:21–30. doi: 10.1007/s00005-017-0476-4. [DOI] [PMC free article] [PubMed] [Google Scholar]
- 12.Puellmann K, Kaminski WE, Vogel M, Nebe CT, Schroeder J, Wolf H, Beham AW. 2006. A variable immunoreceptor in a subpopulation of human neutrophils. Proc Natl Acad Sci U S A 103:14441–14446. doi: 10.1073/pnas.0603406103. [DOI] [PMC free article] [PubMed] [Google Scholar]
- 13.Fuchs T, Puellmann K, Schneider S, Kruth J, Schulze TJ, Neumaier M, Beham AW, Kaminski WE. 2012. An autoimmune double attack. Lancet 379:1364. doi: 10.1016/S0140-6736(11)61939-9. [DOI] [PubMed] [Google Scholar]
- 14.Finley RW, Mackey LJ, Lambert PH. 1982. Virulent P. berghei malaria: prolonged survival and decreased cerebral pathology in cell-dependent nude mice. J Immunol 129:2213–2218. [PubMed] [Google Scholar]
- 15.Amante FH, Haque A, Stanley AC, Rivera Fde L, Randall LM, Wilson YA, Yeo G, Pieper C, Crabb BS, de Koning-Ward TF, Lundie RJ, Good MF, Pinzon-Charry A, Pearson MS, Duke MG, McManus DP, Loukas A, Hill GR, Engwerda CR. 2010. Immune-mediated mechanisms of parasite tissue sequestration during experimental cerebral malaria. J Immunol 185:3632–3642. doi: 10.4049/jimmunol.1000944. [DOI] [PubMed] [Google Scholar]
- 16.Quigley MF, Almeida JR, Price DA, Douek DC. 2011. Unbiased molecular analysis of T cell receptor expression using template-switch anchored RT-PCR. Curr Protoc Immunol Chapter 10:Unit10.33. [DOI] [PMC free article] [PubMed] [Google Scholar]
- 17.Hedrick SM, Cohen DI, Nielsen EA, Davis MM. 1984. Isolation of cDNA clones encoding T cell-specific membrane-associated proteins. Nature 308:149–153. doi: 10.1038/308149a0. [DOI] [PubMed] [Google Scholar]
- 18.Yanagi Y, Yoshikai Y, Leggett K, Clark SP, Aleksander I, Mak TW. 1984. A human T cell-specific cDNA clone encodes a protein having extensive homology to immunoglobulin chains. Nature 308:145–149. doi: 10.1038/308145a0. [DOI] [PubMed] [Google Scholar]
- 19.Taylor PR, Martinez-Pomares L, Stacey M, Lin HH, Brown GD, Gordon S. 2005. Macrophage receptors and immune recognition. Annu Rev Immunol 23:901–944. doi: 10.1146/annurev.immunol.23.021704.115816. [DOI] [PubMed] [Google Scholar]
- 20.Chavez-Galan L, Olleros ML, Vesin D, Garcia I. 2015. Much more than M1 and M2 macrophages, there are also CD169(+) and TCR(+) macrophages. Front Immunol 6:263. [DOI] [PMC free article] [PubMed] [Google Scholar]
- 21.Beham AW, Puellmann K, Laird R, Fuchs T, Streich R, Breysach C, Raddatz D, Oniga S, Peccerella T, Findeisen P, Kzhyshkowska J, Gratchev A, Schweyer S, Saunders B, Wessels JT, Mobius W, Keane J, Becker H, Ganser A, Neumaier M, Kaminski WE. 2011. A TNF-regulated recombinatorial macrophage immune receptor implicated in granuloma formation in tuberculosis. PLoS Pathog 7:e1002375. doi: 10.1371/journal.ppat.1002375. [DOI] [PMC free article] [PubMed] [Google Scholar]
- 22.Fuchs T, Puellmann K, Emmert A, Fleig J, Oniga S, Laird R, Heida NM, Schafer K, Neumaier M, Beham AW, Kaminski WE. 2015. The macrophage-TCRalphabeta is a cholesterol-responsive combinatorial immune receptor and implicated in atherosclerosis. Biochem Biophys Res Commun 456:59–65. doi: 10.1016/j.bbrc.2014.11.034. [DOI] [PubMed] [Google Scholar]
- 23.Fuchs T, Hahn M, Riabov V, Yin S, Kzhyshkowska J, Busch S, Pullmann K, Beham AW, Neumaier M, Kaminski WE. 2017. A combinatorial alphabeta T cell receptor expressed by macrophages in the tumor microenvironment. Immunobiology 222:39–44. doi: 10.1016/j.imbio.2015.09.022. [DOI] [PubMed] [Google Scholar]
- 24.Oakley MS, McCutchan TF, Anantharaman V, Ward JM, Faucette L, Erexson C, Mahajan B, Zheng H, Majam V, Aravind L, Kumar S. 2008. Host biomarkers and biological pathways that are associated with the expression of experimental cerebral malaria in mice. Infect Immun 76:4518–4529. doi: 10.1128/IAI.00525-08. [DOI] [PMC free article] [PubMed] [Google Scholar]
- 25.Oakley MS, Majam V, Mahajan B, Gerald N, Anantharaman V, Ward JM, Faucette LJ, McCutchan TF, Zheng H, Terabe M, Berzofsky JA, Aravind L, Kumar S. 2009. Pathogenic roles of CD14, galectin-3, and OX40 during experimental cerebral malaria in mice. PLoS One 4:e6793. doi: 10.1371/journal.pone.0006793. [DOI] [PMC free article] [PubMed] [Google Scholar]
- 26.Oakley MS, Sahu BR, Lotspeich-Cole L, Solanki NR, Majam V, Pham PT, Banerjee R, Kozakai Y, Derrick SC, Kumar S, Morris SL. 2013. The transcription factor T-bet regulates parasitemia and promotes pathogenesis during Plasmodium berghei ANKA murine malaria. J Immunol 191:4699–4708. doi: 10.4049/jimmunol.1300396. [DOI] [PubMed] [Google Scholar]
- 27.Oakley MS, Sahu BR, Lotspeich-Cole L, Majam V, Thao Pham P, Sengupta Banerjee A, Kozakai Y, Morris SL, Kumar S. 2014. T-bet modulates the antibody response and immune protection during murine malaria. Eur J Immunol 44:2680–2691. doi: 10.1002/eji.201344437. [DOI] [PubMed] [Google Scholar]


