Abstract
Ionospheric signatures of ultra-low frequency (ULF) wave in the Pc3–5 band (1.7–40.0 mHz) were surveyed using ~6 s resolution data from Super Dual Auroral Radar Network (SuperDARN) radars in the northern hemisphere from 2010 to 2016. Numerical experiments were conducted to derive wave period dependent thresholds for automated detection of ULF waves using the Lomb-Scargle periodogram technique. The spatial occurrence distribution, frequency characteristics, seasonal effects, solar wind condition and geomagnetic activity level dependence have been studied. Pc5 wave events were found to dominate at high and polar latitudes with a most probable frequency of 2.08 ± 0.07 mHz while Pc3–4 waves were relatively more common at midlatitudes on the nightside with a most probable frequency of 11.39 ± 0.14 mHz. At high latitudes, the occurrence rate of Pc4–5 waves maximizes in the dusk sector and during winter. These events tend to occur during low geomagnetic activity and northward interplanetary magnetic field (IMF). For the category of radially bounded but longitudinally extended Pc4 events in the duskside ionosphere, an internal driving source is suggested. At midlatitudes, the Pc3–4 occurrence rate maximizes premidnight and during equinox. This tendency becomes more prominent with increasing auroral electrojet (AE) index and during southward IMF, which suggests many of these events are Pi2 and Pc3–4 pulsations associated with magnetotail dynamics during active geomagnetic intervals. The overall occurrence rate of Pc3–5 wave events is lowest in summer, which suggests that the ionospheric conductivity plays a role in controlling ULF wave occurrence.
1. Introduction
Ultra-low frequency (ULF) waves are magnetohydrodynamic (MHD) plasma waves in the frequency band of roughly 1 mHz to several Hz. They are ubiquitous and have been observed in geospace and on the ground for over fifty years [e.g., Dungey, 1954; Saito, 1969]. ULF waves were originally called micropulsations or magnetic pulsations since they were first observed by ground magnetometers. ULF pulsations are classified into two types: pulsations continuous (Pc) and pulsations irregular (Pi) with several subclasses (Pc1–5 and Pi1–2) according to their frequencies and durations [Jacobs et al., 1964]. With respect to polarization, ULF waves can be categorized into three modes: poloidal (ΔBr, ΔEφ), compressional (ΔB//, ΔEφ), and toroidal (ΔBφ, ΔEr). Here, Br (Er), B//, and Bφ (Eφ) are the radial, parallel (or compressional), and azimuthal components in the local magnetic field system, respectively. ULF waves are believed to play important roles in magnetospheric plasma energization and loss and energy transfer from the solar wind to the Earth’s magnetosphere and ionosphere [Elkington et al., 1999; Mathie and Mann, 2000; Zong et al., 2009].
Numerous studies have used ground magnetometer and spacecraft measurements to study ULF pulsation occurrence statistics and source mechanisms [e.g., Anderson, 1994]. Several theories have been proposed for the excitation mechanisms of ULF waves observed in the Earth’s magnetosphere. For example, it has been shown that poloidal Pc4 (6.7–22.2 mHz) waves, which are believed to be an example of a second harmonic field line resonance (FLR) [Takahashi and McPherron, 1984; Hughes and Grard, 1984], are most often seen in the afternoon sector and are associated with localized sources [e.g., Anderson et al., 1990]. Compressional and poloidal Pc5 (1.7–6.7 mHz) waves are usually observed on the nightside and flanks of the magnetosphere and are related to internal driving sources such as the drift mirror instability [Hasegawa, 1969] and the drift/drift-bounce resonance instability [Southwood et al., 1969; Southwood and Kivelson, 1982; Dai et al., 2013]. The internal sources are expected to generate poloidal waves with high azimuthal wave numbers (high-m). Toroidal Pc5 waves of fundamental mode FLR are more often seen on the dawn and dusk flanks and are often associated with external driving sources such as variations in the solar wind dynamic pressure [Kepko and Spence, 2003; Hudson et al., 2004] and Kelvin-Helmholtz waves at the magnetopause [Anderson et al., 1990; Lin et al., 2014]. The externally driven waves mostly propagate anti-sunward with low azimuthal wave numbers (low-m). Modeling has shown that many external or internal mechanisms can be viable under appropriate conditions [Kivelson and Southwood, 1985; Lee and Lysak, 1989; Ozeke and Mann, 2001]; however, positively identifying a source mechanism has proven to be rather difficult due to limited measurements.
ULF waves in the ionosphere have been studied using radars. The Super Dual Auroral Radar Network (SuperDARN) is a global network of ground-based high frequency (HF: 3–30 MHz) radars designed primarily for studying ionospheric plasma convection [Chisham et al., 2007]. The line-of-sight (LOS) velocity measured by SuperDARN radars can be used to detect and monitor ionospheric ULF wave signatures with both high- and low-m [Fenrich et al., 1995; James et al., 2013] and with a total geographical coverage area that cannot be achieved with any other ground- or space-based instrumentation. Based on a new data display technique developed by Ponomarenko et al. [2003], SuperDARN detected ULF wave signatures have been characterized in a few recent studies [e.g., Sakaguchi et al., 2012; Bland et al., 2014; Norouzi-Sedeh et al., 2015]. These studies have been largely limited to the Pc5 range since SuperDARN radars are normally scheduled for 1-min azimuthal sweeps in the common mode [e.g., Bland et al., 2014; Sakaguchi et al., 2012]. ULF wave studies using higher time resolution SuperDARN data have been either case studies [e.g., Shi et al., 2017] and/or statistical studies using one or two radars covering a limited range of latitudes [e.g., Norouzi-Sedeh et al., 2015]. The lack of comprehensive studies could be partially attributed to the absence of a database of high time resolution observations and no efficient way to identify ULF wave signatures in the SuperDARN dataset. Recently, Bland et al. [2014] presented a method for automatically detecting signatures of ULF waves in SuperDARN radar data, which used the Lomb-Scargle periodogram to identify periodic fluctuations in the Doppler velocity. In this study we improve upon this method and apply it to seven years of high time resolution data from seventeen SuperDARN radars in the northern hemisphere. We investigate the occurrence and frequency characteristics of ULF wave signatures in the Pc3–5 band and discuss possible source mechanisms for these waves.
2. Instrumentation and Event Detection Method
2.1. SuperDARN
SuperDARN is an international network consisting of more than 30 low-power HF (8–20 MHz) coherent scatter radars at middle to polar latitudes in both hemispheres that look into Earth’s ionosphere [Baker et al., 2007; Chisham et al., 2007]. The radars measure Doppler shifts of ionospheric irregularities at F region altitudes undergoing E⃗ × B⃗ plasma drift. When ULF waves pass through the ionosphere, the associated electric field produces a Doppler velocity oscillation that can be measured by the radars.
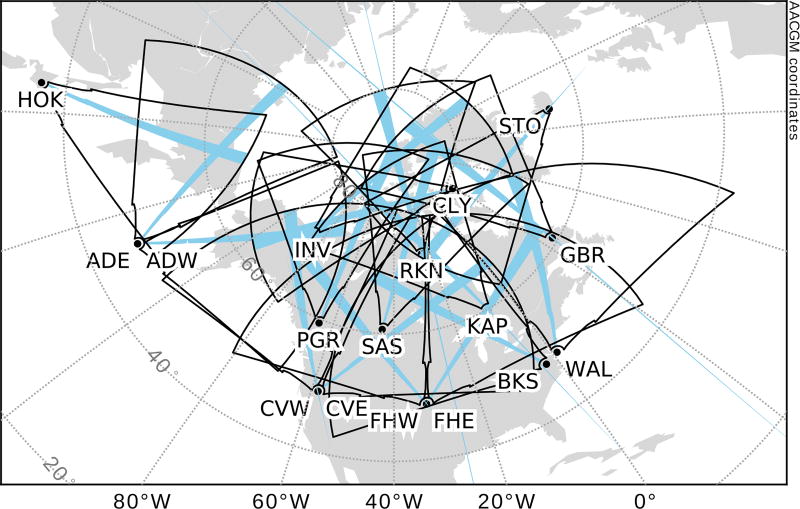
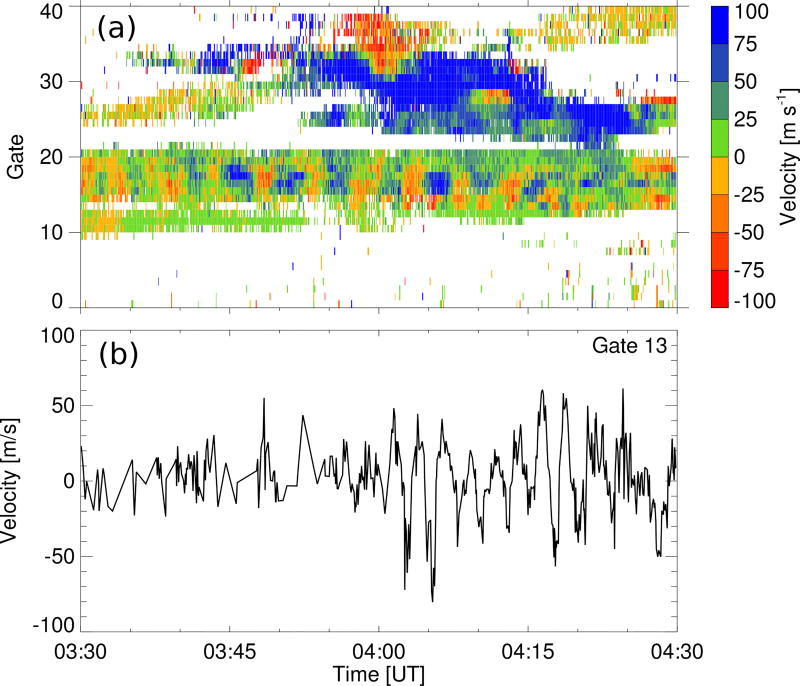
Normally, the SuperDARN radars are scheduled for 1-min azimuthal sweeps in the “common” mode. The step in azimuth between adjacent beams is 3.24° and the range resolution is 45 km. Sometimes, radars are scheduled to operate in a special mode called “THEMIS” mode, in which a camping beam is sampled at a higher rate of ~6 s by interleaving soundings on the camping beam with successive beams of the normal scan. Figure 1 shows the fields of view of seventeen northern hemisphere SuperDARN radars in Altitude Adjusted Corrected Geomagnetic (AACGM) coordinates [Baker and Wing, 1989]. Only radars which have been operated regularly in the THEMIS mode in channel A during the interval 2010–2016 are shown, and the camping beam for each radar is highlighted in cyan. An example period of THEMIS mode observations from beam 6 of the Saskatoon (SAS) radar during 03:30 – 04:30 UT on 16 February 2015 is shown in Figure 2. ULF signatures manifest themselves as alternating red and blue stripes in the range-time intensity (RTI) plot in Figure 2a with positive (blue-green) values corresponding to motion toward the radar. Figure 2b shows the time series of Doppler velocity measured in range gate 13, where wave-like signatures with a few gaps are visible.
Figure 1.
Fields of view of seventeen northern hemisphere SuperDARN radars in AACGM coordinates. Cyan highlighted beams indicate the camping beams.
Figure 2.
Time series of THEMIS mode data measured on beam 6 of the SAS radar on 16 February 2015 from 03:30–04:30 UT: (a) RTI plot of Doppler velocity; (b) Time series of Doppler velocity for range gate 13.
2.2. Data Processing and Event Selection
The data processing procedures are similar to those in Bland et al. [2014]. Firstly, we select for ionospheric backscatter and reject ground scatter by requiring backscatter to satisfy one of the following conditions: (1) Doppler velocity |V| ≥ 50 m/s; (2) spectral width W ≥ 50 m/s; (3) backscatter is flagged as ionospheric backscatter by the standard SuperDARN ground/ionospheric condition [Blanchard et al., 2009]. Next, poor quality data is filtered out if backscatter power is less than 3 dB or errors in Doppler velocity or spectral width is greater than 100 m/s. Data from ranges less than 765 km are excluded to minimize contamination from meteor and E region scatter. To search for Pc5 (Pc3–4) signatures, a 1-h (0.5-h) interval is used which is incremented by 15 (7.5) min iteratively. The ionospheric backscatter time series is high-pass filtered by subtracting the median value of a sliding window of 10 (5) min length for Pc5 (Pc3–4). Further restrictions are applied to the candidate intervals to weaken large data gap effects: (1) the largest time step between consecutive records should be less than 10% of the time interval (i.e., 6 min for Pc5 and 3 min for Pc3–4); (2) the number of measurements should be no less than 400 for Pc5 and 200 for Pc3–4 (i.e., two thirds of the total number assuming a 6 s sampling rate). Qualified intervals are selected as valid ionospheric backscatter measurements and tested for periodic behavior in the Doppler velocity.
Data gaps occur in the radar time series complicating the application of Fourier spectral analysis. While data interpolation can be applied, spurious spikes in the spectrogram are likely to mislead the identification of wave period. We instead applied the Lomb-Scargle periodogram technique for ULF wave signature identification, which is especially advantageous for unevenly sampled signals [Lomb, 1976; Scargle, 1982]. A sufficiently high value of the normalized peak power (NPP) of a Lomb-Scargle periodogram indicates the existence of a wave signature at the associated period. In order to establish the significance of spectral peaks resulting from the Lomb-Scargle periodogram analysis and implement the automated algorithm to search wave signatures, wave period-dependent spectrum thresholds are derived based on a series of numerical experiments. Details about the derivation of threshold NPP can be found in the Appendix.
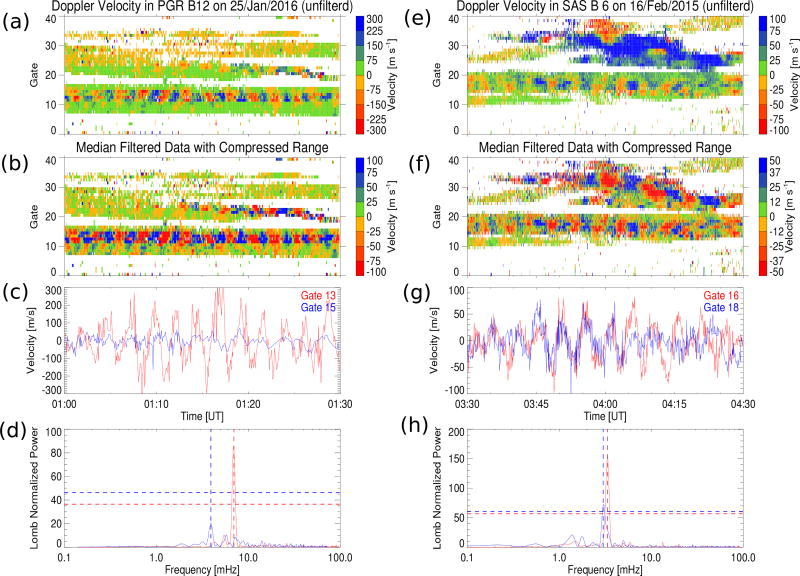
A ULF wave event is identified if the returned NPP is above the threshold listed in Table 1. The event is classified as Pc5 waves if the frequency is within 1.7–6.7 mHz and Pc3–4 waves if within 6.7–40.0 mHz. ULF wave event examples detected by the automated algorithm are shown in Figure 3. Left panels are measurements from beam 12 of the Prince George (PGR) radar during 01:00 – 01:30 UT on 25 January 2016 and right panels are measurements from beam 6 of the SAS radar during 03:30 – 04:30 UT on 16 February 2015. Comparing the first two rows shows that the ULF signatures are highlighted after median filtering and expansion of the color scale [Ponomarenko et al., 2003]. The filtered Doppler velocity time series are illustrated for two range gates of each radar in the third row and the Lomb-Scargle periodograms of these signals are shown in the fourth row. ULF oscillations are visible in PGR range gate 13 with ~300 m/s amplitude (red) but are not obvious in range gate 15 (blue) as shown in Figure 3c. Dimensionless NPP values of 85.95 and 20.70 are returned at frequencies of 6.98 mHz and 3.92 mHz for range gate 13 (red) and range gate 15 (blue) in Figure 3d. The horizontal dashed lines indicate the threshold NPPs for these two frequencies, which are 36.45 and 46.25 according to Table 1. A Pc4 event is therefore reported for PGR range gate 13 while a null event is reported for range gate 15. Similarly in Figure 3h, the Lomb-Scargle periodogram for the SAS radar range gate 16 returns an NPP of 156.43 which is much greater than the threshold value of 56.61 at 3.34 mHz, while gate 18 returns an NPP of 72.50 which is slightly greater than the threshold of 60.66 at 3.00 mHz. A Pc5 event is therefore reported for SAS range gate 16 and a marginal Pc5 event for range gate 18. These examples illustrate how the algorithm works and the sensitivity of event determination.
Table 1.
Empirical equations of threshold NPP dependence on wave period with signal length from 66.7% to 133.3% of ideally even sampled length in the Pc3–4 and Pc5 range.
| Npts | Pc3–4 | Npts | Pc5 |
|---|---|---|---|
|
| |||
| 200 | NPP = 0.72T̃sin +6.8 | 400 | NPP = 0.49T̃sin +16.7 |
| 250 | NPP = 0.94T̃sin +6.3 | 500 | NPP = 0.60T̃sin +19.0 |
| 300 | NPP = 1.09T̃sin +6.5 | 600 | NPP = 0.71T̃sin +21.2 |
| 350 | NPP = 1.25T̃sin +6.6 | 700 | NPP = 0.82T̃sin +23.8 |
| 400 | NPP = 1.40T̃sin +7.0 | 800 | NPP = 0.95T̃sin +25.0 |
Figure 3.
Event examples identified by the automatic detection algorithm using data collected on beam 12 of the PGR radar at 01:00–01:30 UT on 25 January 2016 (left) and beam 6 of the SAS radar at 03:30–04:30 UT on 16 February 2015 (right). (From top to bottom) RTI plots of unfiltered Doppler velocity; RTI plots of median filtered Doppler velocity; time series of filtered Doppler velocity for two particular range gates (red and blue); Lomb-Scargle periodograms of data shown in (c) and (g).
A few factors should be noted before statistically analyzing Pc3–5 oscillations in the Doppler velocity with the automated detection algorithm. First, the algorithm searches overlapping 1-h or 0.5-h intervals for ULF wave signatures from each individual range gate of every radar. Events with a long duration and/or a large spatial scale size will be counted multiple times. Second, only ionospheric scatter is analyzed because of difficulties in correctly identifying ground/sea backscatter. This produces a bias toward nightside events when ionospheric backscatter is dominant. Third, this method cannot distinguish between pulsation irregular and pulsation continuous. Finally, large amplitude short-lived Doppler velocity fluctuations other than ULF wave activity are another potential source of contamination.
3. Statistical Results
The automated detection algorithm was applied to THEMIS mode measurements collected with SuperDARN radars in the northern hemisphere from 2010 to 2016 to identify Pc3–4 events (0.5-h intervals) and Pc5 events (1-h intervals) separately. In total, we identified 5182 Pc3–4 events, 2518 events (48.6%) of which had NPP values greater than 1.2 times their NPP thresholds. For Pc5 events, 7419 out of 17580 events (42.2%) had NPP values greater than 1.2 times their NPP thresholds. In this section, we present statistical results regarding spatial occurrence of the observed ionospheric Pc3–5 ULF signatures, their frequency characteristics, seasonal effects, and dependence on solar wind and geomagnetic conditions.
3.1. Spatial Occurrence Distribution
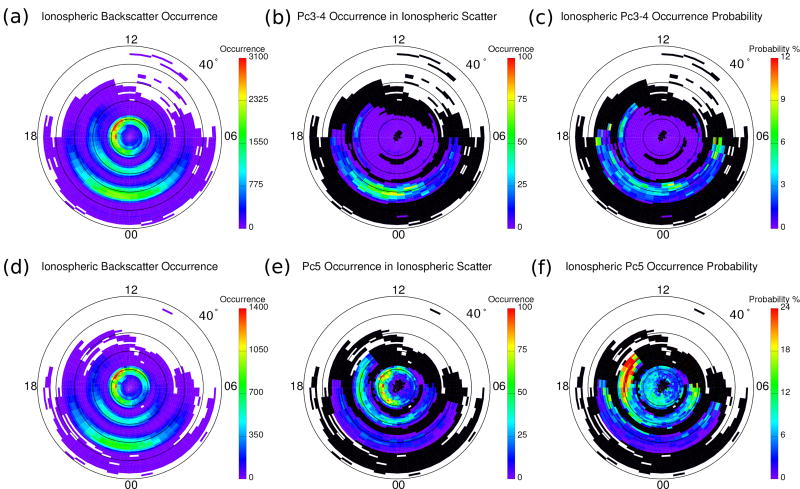
Figure 4 shows the Pc3–4 (upper panels) and Pc5 (lower panels) occurrence statistics as a function of magnetic latitude (MLAT) and magnetic local time (MLT) in the northern hemisphere. The geomagnetic location of each event is obtained from standard ionospheric backscatter mapping in the AACGM coordinate system, assuming a virtual reflection height of 300 km. The MLAT-MLT maps are organized into bins of 1° MLAT and 0.5 h MLT. Areas where no ionospheric backscatter was observed are shown in white, while black identifies regions where ionospheric backscatter was observed but the observation time in each MLAT-MLT cell was less than 50 h. We exclude those black regions from further analysis due to insufficient backscatter echoes. The left, middle, and right panels show the distributions of ionospheric backscatter occurrence, ULF event occurrence, and the ULF occurrence probability, respectively. Here the ULF occurrence probability is defined as the ULF event occurrence normalized by the ionospheric backscatter occurrence. The upper panels show the results for Pc3–4 events and lower panels show Pc5 events.
Figure 4.
MLAT-MLT maps of ionospheric backscatter occurrence (left), occurrence (middle), and occurrence rate (right) of Pc3–4 (upper panels) and Pc5 events (lower panels).
Considering first the occurrence of ionospheric backscatter, measurements from 0.5 h intervals (Figure 4a) and 1 h intervals (Figure 4d) clearly show the coverage provided by the tiers of radars at polar, high, and middle latitudes. Ionospheric backscatter covers most MLTs in the polar region but is mostly seen on the nightside at midlatitudes with an extension to the afternoon sector at high latitudes. Turning now to consideration of ULF wave occurrence, Pc3–4 waves occurred predominantly at midlatitudes on the nightside and at high latitudes on the duskside (Figure 4b). Very few events were observed at polar latitudes despite the presence of sufficient ionospheric backscatter there (Figure 4a). In contrast to the Pc3–4 events, Pc5 events are detected mostly at high and polar latitudes (Figures 4e). Note that Pc5 events (Figure 4e) at high latitudes mainly occur in the afternoon and nightside and have a larger longitudinal and latitudinal extent than Pc3–4 events at high latitudes (Figure 4b). Finally, the occurrence probability suggests that Pc3–4 events (Figure 4c) at high latitudes have a peak occurrence probability of ~7% on the duskside (16–18 MLT) at 67–68° MLAT. While the occurrence rate of Pc3–4 events above 70° is essentially zero at almost all MLTs. At midlatitudes, the occurrence rates of Pc3–4 events are generally greater premidnight than postmidnight, except there is a peak right after midnight above 60° MLAT and another peak at predawn. For Pc5 events, the occurrence probability peaks at ~70° MLAT on the duskside (Figure 4f). While in the polar region, the Pc5 occurrence rate peaks at ~80–83° MLAT in the premidnight sector. The overall occurrence rate of Pc5 events is much higher than that of Pc3–4 (note different occurrence probability color scales in Figures 4c and 4f).
3.2. Frequency Characteristics
Previous studies suggested that certain ULF frequencies show up more often than others and the variation of frequency with latitude can be used to identify FLR [Fenrich et al., 1995]. We applied the Lomb-Scargle periodogram with an oversampling rate of 4, which leads to a frequency resolution of ~0.07 mHz for 1-h intervals and ~0.14 mHz for 0.5-h intervals. While the Lomb-Scargle Periodogram technique could be used to identify multiple wave components, in this study we focus on the single component corresponding to the strongest spectrum power for a given time interval and range gate. Since we identify the Pc3–4 and Pc5 events separately with different high-pass filter windows, it is thus possible that a single time interval with multiple frequencies (e.g., harmonic frequencies) could be identified as separate events (e.g., Pc5 and Pc3–4).
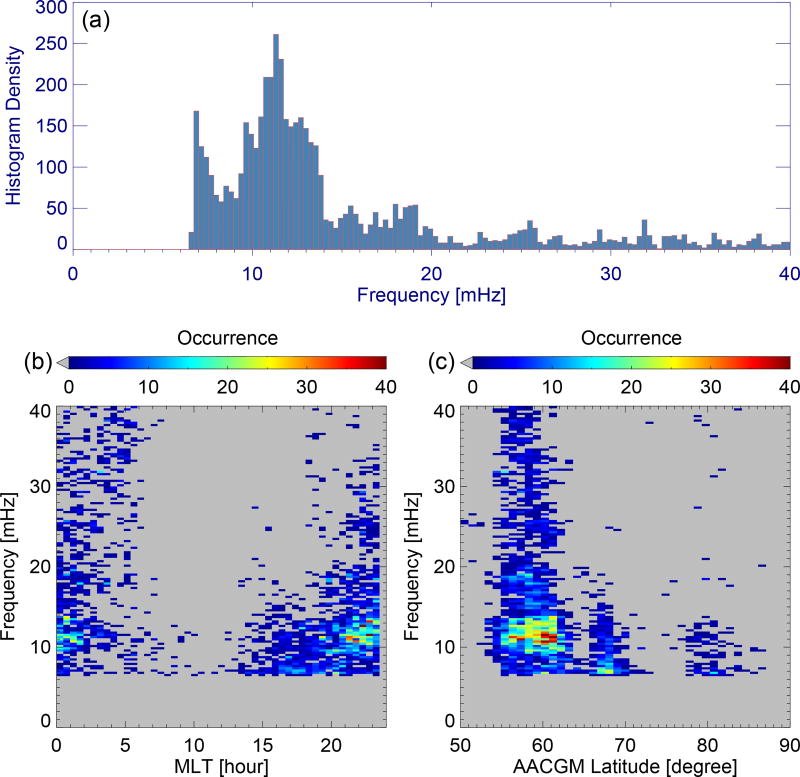
The frequency distribution of Pc3–4 events within 6.7–40.0 mHz are shown in Figure 5a with the most probable frequency of 11.39 ± 0.14 mHz. The Pc3–4 frequency distribution also shows a steep rise with decreasing frequency below 8 mHz. The lower panels of Figure 5 show distributions of the frequency versus MLT (Figure 5b) and MLAT (Figure 5c). Pc3–4 events preferentially occur on the duskside and nightside (Figure 5b) and cover a broader frequency range at midlatitude than at high latitudes where the most probable frequency is ~7 mHz (Figure 5c). For Pc3–4 events at midlatitudes, a dominant 11 mHz peak exists from 54° to 62° MLAT with no obvious frequency variation with latitude. However, Pc3–4 events observed from high-latitude radars generally have lower frequencies (< 15 mHz) than those from midlatitude radars (Figure 5c). We thus put the Pc3–4 events from high-latitude radars into the category of Pc4 events.
Figure 5.
Frequency distribution of Pc3–4 events. Upper panel (a) shows the histogram of event frequencies while the lower panels show two-dimensional histograms of (b) frequency versus MLT and (c) frequency versus AACGM latitude.
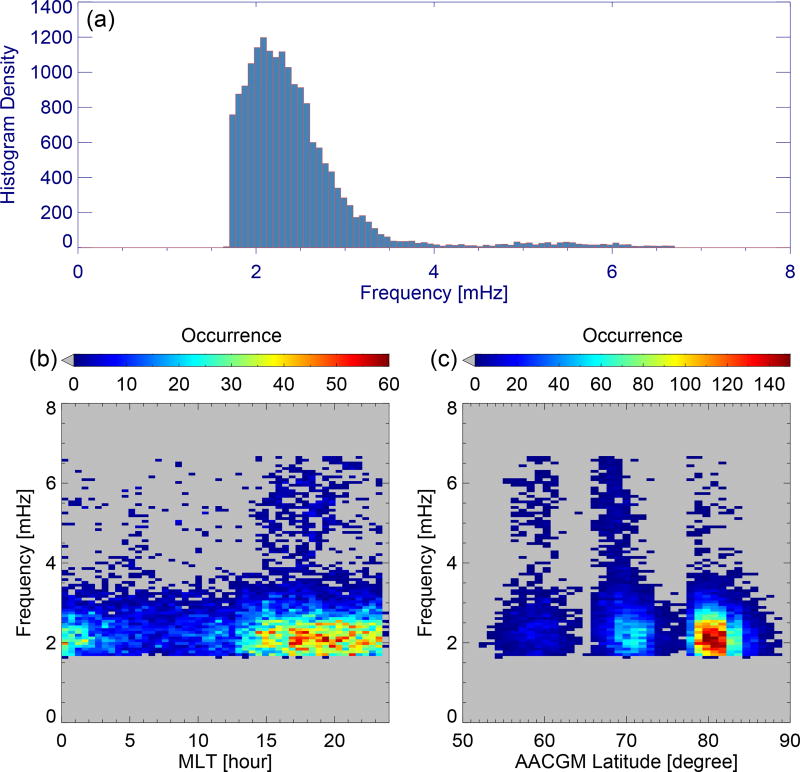
Figure 6 shows the frequency distribution of Pc5 events in a similar format to Figure 5 but in the frequency range of 1.7–6.7 mHz. The most probable frequency is 2.08 ± 0.07 mHz (Figure 6a). The majority of Pc5 events were seen with frequencies below 4 mHz and in almost all MLT sectors and at middle, high, and polar latitudes. While the Pc5 events with frequencies above 4 mHz were more often observed on the duskside (Figure 6b) at high and middle latitudes (Figure 6c). For Pc5 events at high latitudes, the occurrence of lower frequency events around 2 mHz peaks above 70 degrees with a clear trend towards lower latitudes as the frequency increases. The 0.07 mHz frequency resolution should be sufficient to resolve discrete frequencies in the Pc5 range, however, we do not find strong evidence of preferred frequencies except perhaps the 2.36 ± 0.07 mHz when considering 506 Pc5 events with NPP values greater than 1.8 times the lower threshold (not shown).
Figure 6.
Frequency distribution of Pc5 events. Same format as Figure 5.
3.3. Seasonal Effects
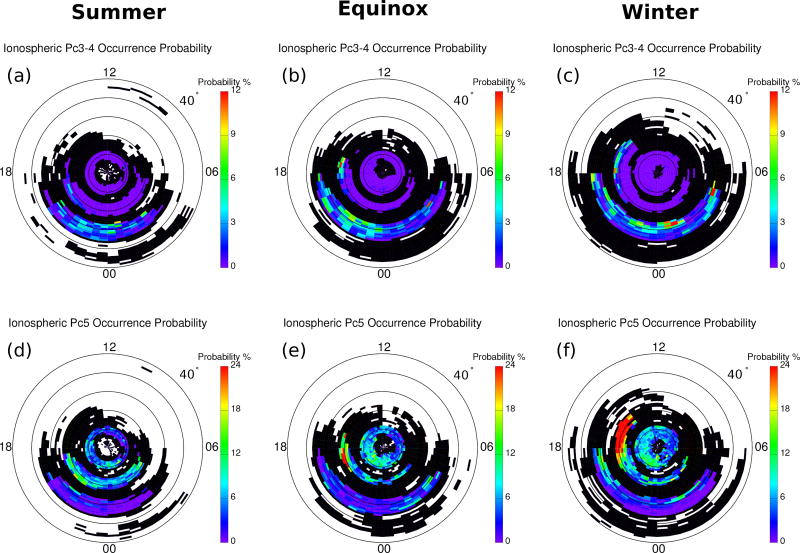
The ionospheric conductivity varies with season and may affect the ionospheric backscatter and ULF wave occurrence. To investigate these effects, ULF events were categorized by season: summer (May–August), equinox (March–April and September–October), and winter (November–February). Figure 7 shows the seasonal dependence of Pc3–4 (upper panels) and Pc5 (lower panels) occurrence rate. The overall spatial coverage of ionospheric backscatter is highest in winter and lowest in summer. The premidnight peak in occurrence of Pc3–4 events at midlatitudes becomes much more prominent at equinox (Figure 7b). While the predawn and postmidnight occurrence rate peaks of Pc3–4 events at midlatitudes appear to be features in winter (Figure 7c). Turning now to the Pc5 events, the duskside occurrence of Pc5 events peaks at high latitudes and becomes most prominent in winter (Figure 7f). For Pc5 events at polar latitudes, the overall occurrence rate is lowest in summer.
Figure 7.
MLAT-MLT maps of Pc3–4 (upper panels) and Pc5 (lower panels) event occurrence rate at different seasons: summer (left), equinox (middle), and winter (right).
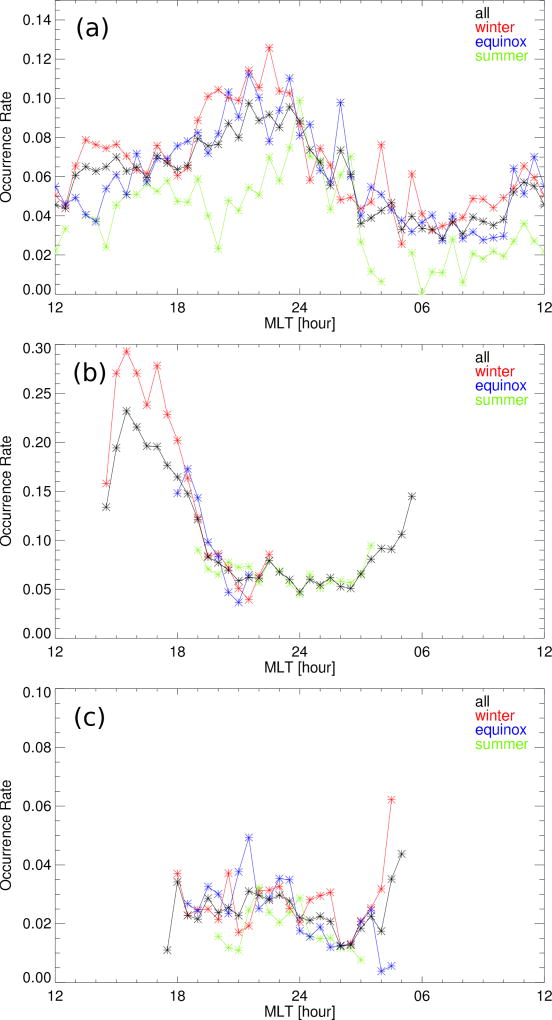
To better visualize the seasonal behaviors, line plots of Pc3–4 and Pc5 occurrence rate at specific latitudes are shown in Figure 8. The overall occurrence rate of polar latitude Pc5 events increases from summer to equinox and winter (Figure 8a). Figure 8b shows an occurrence rate peak of high latitude Pc5 events during winter (red curve) reaching ~30% at about 15 MLT and another peak during equinox (blue curve) reaching ~18% at dusk. The premidnight occurrence rate peak of Pc3–4 at midlatitudes during equinox is clearly seen from the blue curve in Figure 8c.
Figure 8.
Occurrence rate variation as a function of MLT at specific latitudes color coded by season. Occurrence rate variation of (a) Pc5 at polar latitudes (79–83°), (b) Pc5 at high latitudes (66–74°), and (c) Pc3–4 at midlatitudes (54–62°). Black curves indicate data from all seasons.
3.4. Solar Wind and Geomagnetic Disturbance Dependencies
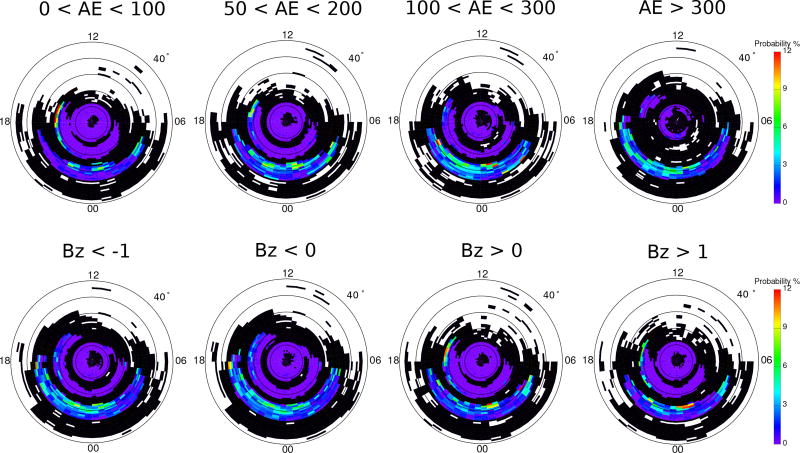
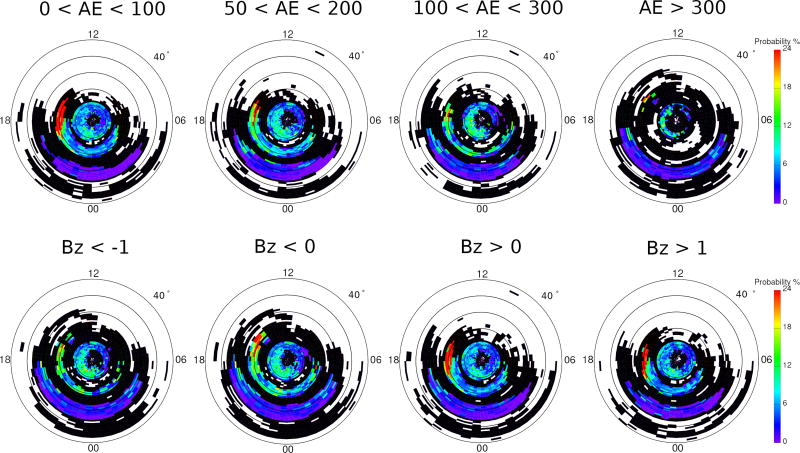
The manner in which ULF occurrence varies with solar wind and geomagnetic conditions can provide information about possible generation mechanisms. The Pc3–4 and Pc5 occurrence rate distributions are sorted by 0.5 h and 1 h average AE index and IMF BZ. Figure 9 shows that Pc4 events at high latitudes tend to occur during low geomagnetic activity as characterized by the AE index and have a higher occurrence rate during northward IMF than southward IMF. At midlatitudes, the premidnight peak in occurrence rate of Pc3–4 events becomes more prominent with increasing AE index value and during southward IMF. Figure 10 shows the dependence for Pc5 events in a similar format. Pc5 events at high latitudes tend to occur during low geomagnetic activity and northward IMF, which is similar to Pc4 events at high latitudes as shown in Figure 9.
Figure 9.
MLAT-MLT maps of Pc3–4 event occurrence rate sorted by 0.5 h average AE index (upper panels) and IMF BZ (lower panels).
Figure 10.
MLAT-MLT maps of Pc5 event occurrence rate sorted by 1 h average AE index (upper panels) and IMF BZ (lower panels).
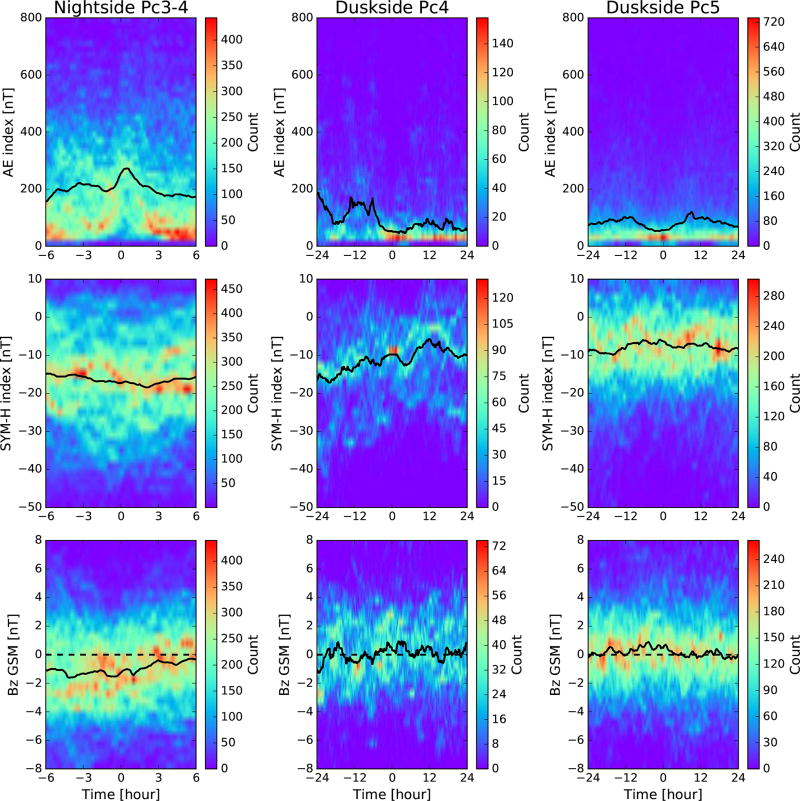
To further help identify sources that generate categories of ULF waves, we show the time evolution of average AE index, SYM-H index, and IMF BZ before and after the occurrence time of ULF wave events in Figure 11. The results are shown in histograms color coded by count of the Pc3–4 events (left, 4274 0.5-h intervals) at midlatitudes (54–64°) on the nightside (MLT ≥ 18 or MLT ≤ 6), the Pc4 events (middle, 409 0.5-h intervals) at 64–70° MLAT and 14–20 MLT, and the Pc5 events (right, 2249 1-h intervals) at high latitudes (65–75°) in the dusk sector (14–20 MLT). Solid black lines show the variation with time of the median values of AE index (top row), SYM-H index (middle row), and IMF BZ (bottom row). Note that the time span in Figure 11 varies with category of ULF wave depending on the type of geomagnetic activity that appears to be most relevant to it, e.g., substorms, storms. Nightside Pc3–4 events (left) tend to occur at a sharp increase of AE index, a decrease of SYM-H index, and during southward IMF, which suggests that substorm activity favors their occurrence. By contrast, Pc4 events (middle) tend to occur at an AE minimum with a sharp AE drop several hours before the events and during positive IMF BZ. The gradual increase of SYM-H index suggests that these events occur during the recovery phase of geomagnetic storms. Pc5 events (right) mostly occur during quiet geomagnetic intervals as characterized by the AE and SYM-H indices and during positive IMF BZ. These quiet conditions usually occur long before the events and last several hours after the events.
Figure 11.
Time evolution of histograms of average AE index (top row), SYM-H index (middle row), and IMF BZ (bottom row) for Pc3–4 events at midlatitudes on the nightside (left column), Pc4 (middle column) and Pc5 (right column) events at high latitudes on the duskside. Zero hour indicates the ULF wave event occurrence time. Solid black lines show the median AE (top row), SYM-H index (middle row), and IMF BZ (bottom row) values. Dashed black lines in the bottom row indicate zero IMF Bz.
4. Discussion
In this study, an automated detection algorithm has been used to identify ionospheric signatures of Pc3–4 and Pc5 waves in seven years of high time resolution SuperDARN radar data. Pc5 events were found to occur predominantly at high and polar latitudes with a most probable frequency of 2.08 ± 0.07 mHz while Pc3–4 events were relatively more common at midlatitudes on the nightside with a most probable frequency of 11.39 ± 0.14 mHz. At high latitudes, Pc4–5 wave occurrence probability peaks in the dusk sector and in winter during low geomagnetic activity and under northward IMF. At midlatitudes, the occurrence probability of Pc3–4 events peaks premidnight and during equinox with this tendency being more prominent with increasing AE index value and under southward IMF.
For Pc5 events in the polar region, classical Pc5 waves observed at lower latitudes on closed field lines are rarely observed beyond the auroral oval inside the polar cap by ground magnetometers [Kozyreva et al., 2016]. Since our algorithm cannot distinguish between irregular and continuous pulsations, it is likely that these events are distinct polar cap pulsations of ~2 mHz, designated as Picap3 pulsations [Yagova et al., 2004]. These polar Pc5/Picap3 events show a seasonal effect with the lowest occurrence rate in summer (Figure 8a). At high latitudes, Pc5 events were observed from afternoon to postmidnight (Figure 4e) with a peak occurrence rate in the duskside ionosphere (Figure 4f). This diurnal variation is generally consistent with a recent study using data from the SuperDARN Tasman International Geospace Environment Radars (TIGER) and the magnetometers located on Macquarie Island by Norouzi-Sedeh et al. [2015]. The majority of ULF signatures seen in the radar data from a beam pointing toward the southern AACGM pole were detected between 15 and 21 local time in their study. The duskside occurrence rate peak of Pc5 events in our study becomes most prominent in winter as shown in Figure 7 and Figure 8b. Both the diurnal and seasonal behaviors of Pc5 occurrence at high and polar latitudes imply that decreased ionospheric conductivity leads to increased amplitude of wave electric fields in the ionosphere [Sakaguchi et al., 2012; Pilipenko et al., 2012]. The occurrence of ULF waves as measured by ground magnetometers is also sensitive to ionospheric conductivity, but in the opposite sense with HF radar measurements [see Figure 11 in Sakaguchi et al., 2012], i.e., the occurrence peak is on the dayside [Baker et al., 2003].
Most Pc5 events in this study occurred in the range 1.7–4.0 mHz with a most common frequency of ~2 mHz, which is consistent with previous statistical results using SuperDARN data [Bland et al., 2014; Norouzi-Sedeh et al., 2015]. Discrete frequencies at 1.6, 2.1, 2.9, and 3.3 mHz were reported by Norouzi-Sedeh et al. [2015] and earlier at 1.3, 1.9, 2.6, and 3.4 mHz by Samson et al. [1991] and Ruohoniemi et al. [1991]. However, in this study the frequency distribution is continuous in the Pc5 range and no discrete frequencies were observed. The source of ~2 mHz dominance at almost all latitudes is unclear, but possible source mechanisms include linkage to dominant frequencies in solar wind perturbations [Stephenson and Walker, 2002; Kepko and Spence, 2003], and magnetospheric cavity/waveguide modes of natural frequencies varying with changes in the cavity topology [Kivelson and Southwood, 1985; Baker et al., 2003].
Pc4 events were mostly observed at 66–70° MLAT from the afternoon to the premidnight sector (Figure 4b). The radially bounded but longitudinally extended Pc4 events observed during quiet geomagnetic intervals have been reported previously and were attributed to localized instabilities [Anderson et al., 1990; Engebretson et al., 1995]. The sharp AE drop several hours before the Pc4 events and gradual increase of SYM-H index are consistent with ULF waves occurring during the late recovery phase of geomagnetic storms [Engebretson et al., 1995; Dai et al., 2015]. This indicates a connection between the occurrence of Pc4 events with prior substorm activity and the decay of the ring current. Numerous studies have shown that poloidal ULF waves are capable of efficiently interacting with energetic particles in the ring current and the radiation belt during both geomagnetically quiet and active times [Hudson et al., 2004; James et al., 2013; Chi and Le, 2015; Dai et al., 2015]. A small convection electric field at quiet times and plasmaspheric refilling during the recovery phase of geomagnetic storms might play roles in the generation of internal instabilities that drive these waves. Localized effects such as the drift or drift-bounce resonance instability are suggested to be possible sources of Pc4 pulsations at high latitudes in the duskside ionosphere.
Pc3–4 events at midlatitudes were seen on the nightside with a premidnight peak in the occurrence rate. The left column of Figure 11 shows that they occurred at a sharp increase of AE index, a decrease of SYM-H index and southward IMF. This evidence indicates that they are most likely Pi2 and Pc3–4 pulsations associated with magnetotail dynamics during geomagnetically active times such as substorm onsets or intensification. The fact that the premidnight occurrence rate peak becomes most prominent during equinox also supports this idea [Russell and McPherron, 1973]. Multiple frequency peaks in the frequency histogram shown in Figure 5 and no obvious frequency variation at midlatitudes from 54° to 62° MLAT suggest they might be associated with plasmaspheric cavity mode/virtual resonances as reported by Teramoto et al. [2016] and Shi et al. [2017].
Finally, it is possible that some of the identified Pc3–5 events in this study are ionospheric plasma drift fluctuations [Cousins and Shepherd, 2012] which are not related to MHD waves, because our algorithm cannot differentiate between them. To definitely determine whether these events are MHD waves, we would need nearby ground magnetometer and/or conjugate spacecraft measurements, which is beyond the scope of this study and will be explored in future studies.
5. Summary and Conclusions
In this study, ionospheric ULF wave signatures in the Pc3–5 band (1.7–40.0 mHz) were surveyed in the SuperDARN THEMIS mode data from 2010 to 2016 by means of the Lomb-Scargle periodogram. Empirical relationships between the Lomb-Scargle periodogram NPP and associated wave period are derived based on a series of numerical experiments to guide automated detection of ULF signatures. Statistics regarding the occurrence and frequency distributions, seasonal effects, solar wind condition and geomagnetic activity level dependence have been studied. The main results are summarized as follows: (1) Pc5 events occur predominantly at high and polar latitudes while Pc3–4 are relatively more common at midlatitudes on the nightside; (2) The most probable Pc5 (Pc3–4) frequency is ~2 (11) mHz; (3) At high latitudes, Pc4–5 occurrence probability peaks in the dusk sector and in winter and is elevated during northward IMF and quiet geomagnetic intervals with decreasing geomagnetic activity; (4) At midlatitudes, Pc3–4 occurrence probability peaks at premidnight and becomes most prominent at equinox with a preference for southward IMF conditions and increasing geomagnetic disturbance level. An internal wave-particle interaction source is suggested for Pc4 events at high latitudes in the duskside ionosphere and a source associated with the magnetotail dynamics during active geomagnetic times for Pc3–4/Pi2 events at midlatitudes in the nightside ionosphere. Our results also emphasize the role of ionospheric conductivity in controlling ULF wave occurrence.
Keypoints.
Pc5 waves occur predominantly at high and polar latitudes with a most probable frequency of 2.08 ± 0.07 mHz while Pc3–4 waves are relatively more common at midlatitudes on the nightside with a most probable frequency of 11.39 ± 0.14 mHz.
At high latitudes, Pc4–5 wave occurrence rate peaks in the duskside ionosphere and during winter.
At midlatitudes, Pc3–4 wave occurrence rate peaks premidnight and during equinox.
Acknowledgments
X. Shi was supported by NSF grant AGS-1341918 and NASA Headquarters under the NASA Earth and Space Science Fellowship Program - Grant 80NSSC17K0456 P00001. E. C. Bland was supported by the Research Council of Norway/CoE under contract 223252/F50. M. D. Hartinger was supported by NASA NNX17AD35G. The authors acknowledge the use of SuperDARN data, which are freely available through the SuperDARN website at Virginia Polytechnic Institute and State University (http://vt.superdarn.org/). SuperDARN is a collection of radars funded by national scientific funding agencies of Australia, Canada, China, France, Italy, Japan, Norway, South Africa, United Kingdom and the United States of America.
Appendix A
Methodology: Lomb-Scargle Periodogram
The Lomb-Scargle periodogram is a spectrum analysis technique especially advantageous for unevenly sampled data [Lomb, 1976; Scargle, 1982]. It has recently been used to search Pc5 ULF oscillations from the SuperDARN common mode data [Bland et al., 2014]. The periodogram at angular frequency ω is defined as
| (A1) |
where xi is the sampled signal at sampling time ti, σ is the standard deviation of the data, and the constant τ is defined such that and P(ω) is invariant under a constant shift applied to all the time stamps. The power spectrum is normalized by the variance of the signal (σ2). A sufficiently high value of NPP indicates the existence of a wave signature at the associated frequency. The significance of this prediction used to be evaluated by the false alarm probability, namely the probability that the peak was produced by white Gaussian noise:
| (A2) |
Here M is the number of independent frequencies which is roughly the number of signal points, and z is the NPP. However, this evaluation is frequency-independent and may become unevenly fair when the target frequency has a broad range. The ULF wave frequency range is typically from 1.0 to 1000 mHz, which covers three orders of magnitude. Assuming the observed wave signatures have a comparable number of cycles, the NPP of a high-frequency wave should be lower than that of a low-frequency wave due to lower duty cycle, as verified in the numerical experiments below.
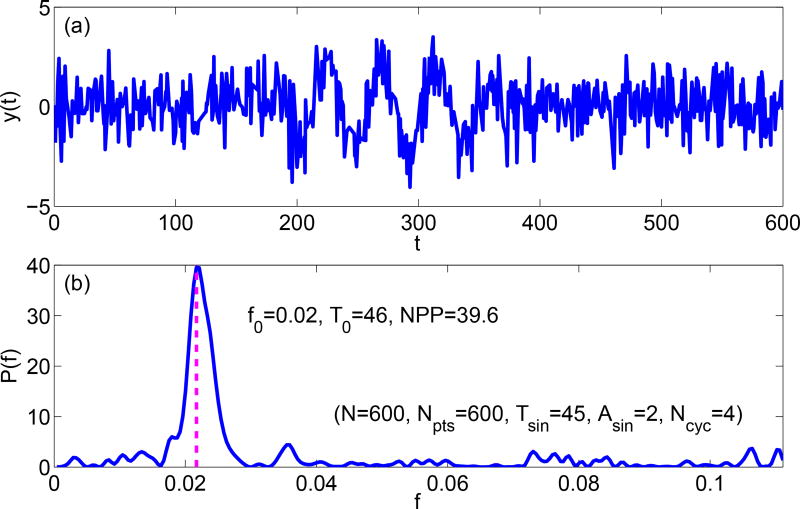
In order to determine thresholds of NPP that account for wave periods, numerical experiments were conducted to explore the statistically expected NPP of signals with different wave periods. SuperDARN measurements are simulated by assuming the signal as a mixture of a sinusoidal component and a Gaussian background noise. It should be pointed out that besides the wave period, NPP also depends on signal parameters including the number of data points, duty cycle of the sinusoidal component, and the signal-to-noise-ratio (SNR). The duty cycle is defined as NCYC · Tsin/N, where NCYC is the number of sinusoidal cycles, Tsin is the wave period, and N is the signal length. The SNR is determined by the wave amplitude Asin normalized by the standard deviation of Gaussian noise. In the simulations presented in this paper, Asin and Tsin are both assumed to be constant within one signal. Figure A1(a) shows a sample simulation with a signal length of N = 600. This length is equivalent to 1 h given 6 s sampling rate of the SuperDARN THEMIS mode data. The length is chosen so as to cover a few Pc5 wave cycles. The sinusoidal signal component has a period of 45 6-s steps in time (i.e., 270 s) and an amplitude of 2. The signal consists of 4 cycles. Figure A1(b) shows the Lomb-Scargle periodogram of the sample simulation. The NPP is found to be 37.6 at a period of 46 time steps, which is within 5% of the designed value.
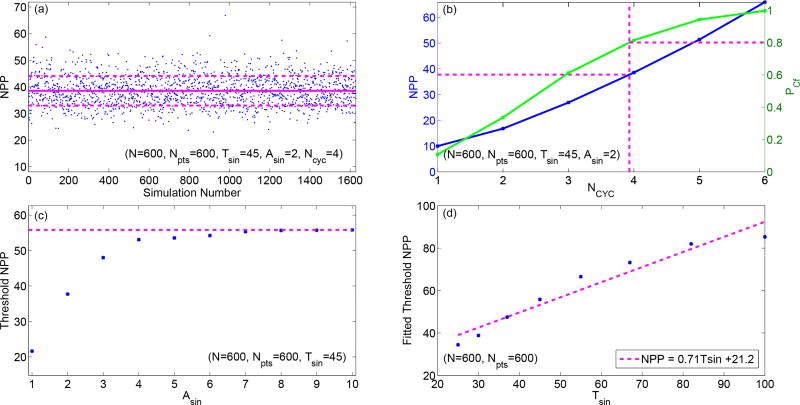
Figure A2 illustrates the procedures to derive a wave-period dependent threshold NPP for signals with length of N = 600. 2000 simulations were performed to be statistically significant for the same parameter set as in Figure A1 (N = 600, Tsin = 45, Asin = 2, NCYC = 4). The effectiveness of Lomb-Scargle periodogram for this parameter set is evaluated by the correct-period probability PCf, which is defined as the ratio between the number of simulations for which the wave period is consistently identified by Lomb-Scargle periodogram and the total number of simulations. Figure A2(a) shows the distribution of NPPs with consistently identified wave period. The PCf of this parameter set is 1658/2000 = 0.83. The mean value of the period-consistent NPPs is 38.2 and the standard deviation is 5.0. Figure A2(b) shows the mean NPP (blue) and PCf (green) for NCYC from 1 to 6 with (N = 600, Tsin = 45, Asin = 2). It is visible that Lomb-Scargle periodogram has a better performance in identifying wave period correctly with more cycles. The NPP also increases with cycle number monotonically. Defining a threshold PCf of 80%, the threshold NPP corresponding to this probability can be calculated via linear interpolation as shown by the magenta dashed lines. The threshold NPP for (N = 600, Tsin = 45, Asin = 2) is 36.8. Figure A2(c) shows the threshold NPP for Asin from 1 to 10 with (N = 600, Tsin = 45). The threshold NPP increases with the wave amplitude and approaches a stable level of ~54.3 when Asin is above 4. The asymptotic level represents the threshold NPP of the given signal length and wave period. Figure A2(d) shows the threshold NPPs of 8 wave periods in the Pc5 range (150 s – 600 s): 25, 30, 37, 45, 55, 67, 82, and 100. These threshold NPPs are linearly fitted by NPP = 0.71Tsin + 21.2. NPP above the value specified by this equation indicates the existence of a wave signature at the associated period with a probability of more than 80%.
It should be noted that the empirical equation obtained by fitting values of NPP depends on two observables of Lomb-Scargle periodogram: Tsin and NPP. The threshold NPP for a high frequency wave signature is lower than for a lower frequency wave, which is reasonable considering that more cycles of high frequency waves are needed to achieve the same duty cycle. The classical false alarm probability uniquely dependent on NPP is overly strict for high frequency wave signatures and not strict enough for low frequency wave signatures. In Figure A2(c), the asymptotic level may raise the threshold for small amplitude wave signatures. However, this could exclude weak signals relative to the background noise, thus increasing the reliability of wave signature identification. In real SuperDARN data, the number of data points available in a 1-h interval could deviate from 600 due to gaps or oversampling. Gaps and oversampling effects were simulated and analyzed with the same method introduced above. The threshold NPP equations for different numbers of points (Npts) are listed in Table 1. The threshold equations for Pc3–4 wave identification are based on a basic length of 30 minutes.
Figure A1.
Example Lomb-Scargle periodogram analysis: (a) A simulated signal with length of 600 points, wave period of 45 points, wave amplitude of 2, and 4 sinusoidal cycles; (b) Lomb-Scargle periodogram of the simulated signal. The magenta dashed line indicates the NPP is 37.6, the wave frequency is 0.02, and the wave period is 46.
Figure A2.
Procedure to derive wave period-dependent threshold NPP. (a) NPP distribution for (N = 600, Tsin = 45, Asin = 2, NCYC = 4); (b) PCf (green) and mean NPP (blue) for NCYC = 1 − 6 with (N = 600, Tsin = 45, Asin = 2); (c) Threshold NPP for Asin = 1 − 10 with (N = 600, Tsin = 45); (d) Asymptotic threshold NPP for Tsin = 25 − 100 with (N = 600). See text for details.!
References
- Anderson BJ. An overview of spacecraft observations of 10 s to 600 s period magnetic pulsations in the Earth’s magnetosphere. In: Engebretson MJ, Takahashi K, Scholer M, editors. Solar Wind Sources of Magnetospheric Ultra-Low-Frequency Waves. AGU; Washington, D. C: 1994. pp. 25–43. [Google Scholar]
- Anderson BJ, Engebretson MJ, Rounds SP, Zanetti LJ, Potemra TA. A statistical study of Pc3–5 pulsations observed by the AMPTE/CCE magnetic field experiment, 1. Occurrence distributions. J. Geophys. Res. 1990;95(A7):10,495–10,523. [Google Scholar]
- Baker KB, Wing S. A new magnetic coordinate system for conjugate studies at high latitudes. J. Geophys. Res. 1989;94(A7):9139–9143. doi: 10.1029/JA094iA07p09139. [DOI] [Google Scholar]
- Baker G, Donovan EF, Jackel BJ. A comprehensive survey of auroral latitude Pc5 pulsation characteristics. J. Geophys. Res. 2003;108(A10):1384. doi: 10.1029/2002JA009801. [DOI] [Google Scholar]
- Baker JBH, Greenwald RA, Ruohoniemi JM, Oksavik K, Gjerloev JW, Paxton LJ, Hairston MR. Observations of ionospheric convection from the Wallops SuperDARN radar at middle latitudes. J. Geophys. Res. 2007;112:A01303. doi: 10.1029/2006JA011982. [DOI] [Google Scholar]
- Blanchard GT, Sundeen S, Baker KB. Probabilistic identification of high-frequency radar backscatter from the ground and ionosphere based on spectral characteristics. Radio Sci. 2009;44:RS5012. doi: 10.1029/2009RS004141. [DOI] [Google Scholar]
- Bland EC, McDonald AJ, Menk FW, Devlin JC. Multipoint visualization of ULF oscillations using the Super Dual Auroral Radar Network. Geophys. Res. Lett. 2014;41:6314–6320. doi: 10.1002/2014GL061371. [DOI] [Google Scholar]
- Chisham G, et al. A decade of the Super Dual Auroral Radar Network (SuperDARN): Scientific achievements, new techniques and future directions. Surv. Geophys. 2007;28(1):33–109. doi: 10.1007/s10712-007-9017-8. [DOI] [Google Scholar]
- Chi P, Le JG. Observations of magnetospheric high-m poloidal waves by ST-5 satellites in low Earth orbit during geomagnetically quiet times. J. Geophys. Res. Space Physics. 2015;120:4776–4783. doi: 10.1002/2015JA021145. [DOI] [Google Scholar]
- Cousins EDP, Shepherd SG. Statistical characteristics of small-scale spatial and temporal electric field variability in the high-latitude ionosphere. J. Geophys. Res. 2012;117:A03317. doi: 10.1029/2011JA017383. [DOI] [Google Scholar]
- Dai L, et al. Excitation of poloidal standing Alfvén waves through drift resonance wave-particle interaction. Geophys. Res. Lett. 2013;40:4127–4132. doi: 10.1002/grl.50800. [DOI] [Google Scholar]
- Dai L, et al. Storm time occurrence and spatial distribution of Pc4 poloidal ULF waves in the inner magnetosphere: A Van Allen Probes statistical study. J. Geophys. Res. Space Physics. 2015;120:4748–4762. doi: 10.1002/2015JA021134. [DOI] [Google Scholar]
- Dungey DW. Sci. Rep. Vol. 69. Penn. State Univ.; Univ. Park: 1954. Electrodynamics of the outer atmosphere. [Google Scholar]
- Elkington SR, Hudson MK, Chan AA. Acceleration of relativistic electrons via drift-resonant interaction with toroidal-mode Pc-5 ULF oscillations. Geophys. Res. Lett. 1999;26(21):3273–3276. doi: 10.1029/1999GL003659. [DOI] [Google Scholar]
- Engebretson MJ, et al. The spatial extent of radial magnetic pulsation events observed in the dayside near synchronous orbit. J. Geophys. Res. 1992;97(A9):13741–13758. doi: 10.1029/92JA00992. [DOI] [Google Scholar]
- Fenrich FR, Samson JC, Sofko G, Greenwald RA. ULF high- and low-m field line resonances observed with the Super Dual Auroral Radar Network. J. Geophys. Res. 1995;100(A11):21,53–21,547. doi: 10.1029/95JA02024. [DOI] [Google Scholar]
- Hasegawa A. Drift mirror instability in the magnetosphere. Phys. Fluids. 1969;12:2642. [Google Scholar]
- Hudson MK, Denton RE, Lessard MR, Miftakhova EG, Anderson RR. A study of Pc-5 ULF oscillations. Ann. Geophys. 2004;22:289–302. [Google Scholar]
- Hughes WJ, Grard RJL. A second harmonic geomagnetic field line resonance at the inner edge of the plasma sheet: GEOS 1, ISEE 1, and ISEE 2 observations. J. Geophys. Res. 1984;89(A5):2755–2764. doi: 10.1029/JA089iA05p02755. [DOI] [Google Scholar]
- Jacobs JA, Kato Y, Matsushita S, Troitskaya VA. Classification of geomagnetic micropulsations. J. Geophys. Res. 1964;69:180–181. [Google Scholar]
- James MK, Yeoman TK, Mager PN, Klimushkin DY. The spatiotemporal characteristics of ULF waves driven by substorm injected particles. J. Geophys. Res. Space Physics. 2013;118:1737–1749. doi: 10.1002/jgra.50131. [DOI] [Google Scholar]
- Kepko L, Spence HE. Observations of discrete, global magnetospheric oscillations directly driven by solar wind density variations. J. Geophys. Res. 2003;108(A6):1257. doi: 10.1029/2002JA009676. [DOI] [Google Scholar]
- Kivelson MG, Southwood DJ. Resonant ULF waves: A new interpretation. Geophys. Res. Lett. 1985;12:49–52. doi: 10.1029/GL012i001p00049. [DOI] [Google Scholar]
- Kozyreva OV, Pilipenko VA, Engebretson MJ, Klimushkin DYu, Mager PN. Correspondence between the ULF wave power distribution and auroral oval. Solar-Terrestrial Physics. 2016;2(2):46–65. doi: 10.12737/20999. [DOI] [Google Scholar]
- Lee D-H, Lysak RL. Magnetospheric ULF wave coupling in the dipole model: The impulsive excitation. J. Geophys. Res. 1989;94(A12):17097–17103. doi: 10.1029/JA094iA12p17097. [DOI] [Google Scholar]
- Lin D, Wang C, Li WY, Tang BB, Guo XC, Peng Z. Properties of Kelvin-Helmholtz waves at the magnetopause under northward interplanetary magnetic field: Statistical study. J. Geophys. Res. Space Physics. 2014;119(9):7485–7494. doi: 10.1002/2014JA020379. [DOI] [Google Scholar]
- Lomb NR. Least-squares frequency analysis of unequally spaced data. Astrophys. Space Sci. 1976;39(2):447–462. doi: 10.1007/BF00648343. [DOI] [Google Scholar]
- Mathie RA, Mann IR. A correlation between extended intervals of ULF wave power and storm-time geosynchronous relativistic electron flux enhancements. Geophys. Res. Lett. 2000;27(20):3261–3264. doi: 10.1029/2000GL003822. [DOI] [Google Scholar]
- Norouzi-Sedeh L, Waters CL, Menk FW. Survey of ULF wave signatures seen in the Tasman International Geospace Environment Radars data. J. Geophys. Res. Space Physics. 2015;120:949–963. doi: 10.1002/2014JA020652. [DOI] [Google Scholar]
- Ozeke LG, Mann IR. Modeling the properties of high-m Alfvén waves driven by the drift-bounce resonance mechanism. J. Geophys. Res. 2001;106(A8):15583– 15597. doi: 10.1029/2000JA000393. [DOI] [Google Scholar]
- Pilipenko V, Belakhovsky V, Kozlovsky A, Fedorov E, Kauristie K. Determination of the wave mode contribution into the ULF pulsations from combined radar and magnetometer data: Method of apparent impedance. J. Atmos. Sol. Terr. Phys. 2012;77:85–95. doi: 10.1016/j.jastp.2011.11.013. [DOI] [Google Scholar]
- Ponomarenko PV, Menk FW, Waters CL. Visualization of ULF waves in SuperDARN data. Geophys. Res. Lett. 2003;30(18):1926. doi: 10.1029/2003GL017757. [DOI] [Google Scholar]
- Ruohoniemi JM, Greenwald RA, Baker KB, Samson JC. HF radar observations of Pc5 field line resonances in the midnight/early morning MLT sector. J. Geophys. Res. 1991;96:15,697–15,710. doi: 10.1029/91JA00795. [DOI] [Google Scholar]
- Russell CT, McPherron RL. Semiannual variation of geomagnetic activities. J. Geophys. Res. 1973;78:92–108. [Google Scholar]
- Saito T. Geomagnetic pulsations. Space Sci. Rev. 1969;10:319–412. [Google Scholar]
- Sakaguchi K, Nagatsuma T, Ogawa T, Obara T, Troshichev OA. Ionospheric Pc5 plasma oscillations observed by the King Salmon HF radar and their comparison with geomagnetic pulsations on the ground and in geostationary orbit. J. Geophys. Res. 2012;117:A03218. doi: 10.1029/2011JA016923. [DOI] [Google Scholar]
- Samson JC, Greenwald RA, Ruohoniemi JM, Hughes TJ, Wallis DD. Magnetometer and radar observations of magnetohydrodynamic cavity modes in the Earth’s magnetosphere. Can. J. Phys. 1991;69(8–9):929–937. doi: 10.1139/p91-147. [DOI] [Google Scholar]
- Scargle JD. Studies in astronomical time series analysis. II Statistical aspects of spectral analysis of unevenly spaced data. Astrophys. J. 1982;263:835–853. doi: 10.1086/160554. [DOI] [Google Scholar]
- Shi X, Baker JBH, Ruohoniemi JM, Hartinger MD, Frissell NA, Liu J. Simultaneous space and ground-based observations of a plasmaspheric virtual resonance. J. Geophys. Res. Space Physics. 2017;122:4190–4209. doi: 10.1002/2016JA023583. [DOI] [Google Scholar]
- Southwood D, Dungey J, Etherington R. Bounce resonant interaction between pulsations and trapped particles. Planet. Space Sci. 1969;17:349–361. doi: 10.1016/0032-0633(69)90068-3. [DOI] [Google Scholar]
- Southwood DJ, Kivelson MG. Charged particle behavior in low-frequency geomagnetic pulsations. II. Graphical approach. J. Geophys. Res. 1982;87:1707–1710. doi: 10.1029/JA087iA03p01707. [DOI] [Google Scholar]
- Stephenson JA, Walker ADM. HF radar observations of Pc5 ULF pulsations driven by the solar wind. Geophys. Res. Lett. 2002;29:1297. doi: 10.1029/2001GL014291. [DOI] [Google Scholar]
- Takahashi K, McPherron RL. Standing hydromagnetic oscillations in the magnetosphere. Planet. Space Sci. 1984;32:1343–1359. [Google Scholar]
- Teramoto M, Nishitani N, Nishimura Y, Nagatsuma T. Latitudinal dependence on the frequency of Pi2 pulsations near the plasmapause using THEMIS satellites and Asian-Oceanian SuperDARN radars. Earth Planets Space. 2016;68(1):1. doi: 10.1186/s40623-016-0397-1. [DOI] [Google Scholar]
- Yagova NV, Pilipenko VA, Lanzerotti LJ, Engebretson MJ, Rodger AS, Lepidi S, Papitashvili VO. Two-dimensional structure of long-period pulsations at polar latitudes in Antarctica. J. Geophys. Res. 2004;109:A03222. doi: 10.1029/2003JA010166. [DOI] [Google Scholar]
- Zong Q-G, Zhou X-Z, Wang YF, Li X, Song P, Baker DN, Fritz TA, Daly PW, Dunlop M, Pedersen A. Energetic electron response to ULF waves induced by interplanetary shocks in the outer radiation belt. J. Geophys. Res. 2009;114:A10204. doi: 10.1029/2009JA014393. [DOI] [Google Scholar]


