Abstract
Carbon nanodots are nanometer sized fluorescent particles studied for their distinct photoluminescent properties and biocompatibility. Although extensive literature reports the modification and application of carbon nanodot fluorescence, little has been published pertaining to phosphorescence emission from carbon nanodots. The use of phosphors in biological imaging can lead to clearer detection, as the long lifetimes of phosphorescent emission permit off-gated collection that avoids noise from biological autofluorescence. Carbon nanodots present a desirable scaffold for this application, with advantageous qualities ranging from photostability to multi-color emission. This research reports the generation of a novel phosphorescent “heavy carbon” nanodot via halogenation of the carbon nanodot structure. By employing a collection pathway that effectively incorporates bromine into the nanostructure, T1 triplet character is introduced, and subsequently phosphorescence is observed in liquid media at room temperature for the first time in the nanodot literature. Further experiments are reported characterizing the conditions of observed phosphorescence and its pH-dependence. Our approach for producing “heavy carbon nanodots” is a low-cost and relatively simple method for generating the phosphorescent nanodots, which sets the foundation for its potential future use as a phosphorescent probe in application.
Keywords: Carbon nanodots, quantum dot, luminescence, fluorescence, phosphorescence, heavy atom effect, spin orbit coupling, brominated nanodot, heavy carbon
1.0. INTRODUCTION
Carbon nanodots have been studied extensively throughout the past decade due to their favorable photophysical properties, yet the generation of phosphorescence from these particles has seen little investigation until very recently.1–5 Primary emphasis has been placed on developing carbon nanodots as fluorescent probes, either as ion sensors or as agents used in drug delivery and biological imaging.6–8 The modification of these structures to generate phosphorescence, however, provides a distinct avenue for improved or expanded applications. Phosphorescent agents have been thoroughly explored in the literature with small organic molecules, but often these molecules have drawbacks in synthetic complexity, photostability, and biocompatibility.9–11 Inorganic nanomaterials are similarly investigated for luminescence applications, but toxicity concerns are frequently raised.12, 13 As such, we have studied carbon nanodots to determine their suitability for the generation of phosphorescence.
Carbon nanodots are quasi-spherical structures, generally on the order of 1–10 nanometers in diameter, and are comprised of many-layered sheets of oxidized graphene. As such, they contain a graphitic core that is decorated by surface functional groups such as hydroxyl, carboxyl, and carbonyl moieties.7 Due to their unique structure, carbon nanodots display distinct spectral properties as compared to small organic fluorophores or inorganic quantum dots. Namely, carbon nanodots frequently exhibit excitation-dependent emission, which can permit multi-color tuning and imaging.8 This observation is largely attributed to the presence of multiple fluorescent sources within a single carbon nanodot sample. Quantum confinement is thought to play a role in carbon nanodot fluorescence properties, with increasing particle size corresponding to bathochromic spectral shifts.14 Yet size also plays a role depending on the distribution of lateral aromatic arrays within the internal structure, with each aromatic unit corresponding to its own defined band gap energy.7 Surface defects and trap states have similarly been identified as sources of luminescence in carbon nanodots, as surface passivation permits the stabilization of imperfect sp2 domains and has been reported to enhance luminescence.6 For phosphorescent carbon nanodots, authors have observed increased phosphorescence emission after rigidifying C=O bonds in the nanostructure, pointing to this molecular component as a contributor to triplet emission.5, 15
Carbon nanodots are superior particles for luminescence applications for a variety of additional reasons. Firstly, these structures can be collected following a simple, low-cost synthetic method. The strategy described herein is a model example of this; a combustion-based strategy, it requires only a gaseous carbon source and the solvent in which the nanodots are collected. The resulting structures additionally require no further filtration or surface passivation prior to spectroscopic use. These qualities establish this method as distinctly advantageous over not only synthetic organic methods, but over many other nanodot collection methods as well.16 In addition, carbon nanodots exhibit good photostability, tolerance to extreme fluctuations in environmental conditions, and excellent biocompatibility.17–19 Because carbon nanodots can be continually excited over numerous excitation-emission event cycles, they see significant utility in immunodiagnostics.20, 21, 25, 26 This is further reinforced by the afore mentioned strong resistance to degradation in high-stress environments, which permits a higher degree of flexibility in immunodiagnostics, allowing researchers to subject systems to large pH and thermal variations without notable loss of fluorescence.22, 23
Given this foundation, carbon nanodots present a promising scaffold for the development of a new phosphorescent nanostructure. Significant research in luminescence sensing and imaging techniques has already been devoted to developing phosphorescence agents.27–31 Phosphors have longer lifetimes, and therefore allow for favorable gated luminescence collection.32 When used in biological systems, this effectively removes any emission collection resulting from the natural luminescence of biological tissues and therefore reduces noise from autofluorescence.33 Phosphors are of additional interest in biomedical fields, as the photosensitization of reactive oxygen species (ROS) can be a competitive pathway to phosphorescence for triplet excited decay. This process is employed in photodynamic therapies, providing a treatment option for malignant tumors. The ROS generated oxidize various species at local tumor sites for destruction of the cancerous region.34 Singlet oxygen, which is one form of reactive oxygen, is known to be generated via energy transfer from the triplet state to dissolved oxygen, allowing phosphors to be photosensitizers for this therapeutic technique.35 Small molecule organic photosensitizers, however, suffer from limitations similar to those of organic fluorophores. In this regard, carbon dots with high occupancy of the triplet excited state present strong potential as new photosensitizers in the field of photodynamic therapy.
It has been long established that phosphorescence can be achieved by employing the heavy atom effect, with numerous studies exploring the addition of either bromine or iodine to a system to encourage intersystem crossing from the excited singlet to triplet state.36–38 Although limited research is available on the halogenation of carbon nanodots, researchers have focused on their use as functionalization intermediates or as contrast agents rather than exploring spectroscopic effects.24, 39 Herein we report a simple method for generating phosphorescence from carbon nanodots through the structural incorporation of bromine and iodine, particles we refer to as “heavy carbon nanodots.”
2.0. MATERIALS AND METHODS
2.1. Carbon nanodot collection
Carbon nanodots were prepared via combustion collection of natural gas, as shown in Scheme S1. Combustion of methane occurred in a standard Bunsen burner with low oxygen input to produce a sooting flame. A vacuum was applied to the impinger system and the resulting airborne products of combustion were pulled through deionized water. The impinger was placed in a room temperature water bath during collection to ensure constant temperature. Burns were conducted for a period of 4 hours. Flame height and bubbling rate from the vacuum were carefully monitored throughout the burn time. All particles were filtered through a 0.22 μm pore to remove large soot particles prior to analysis or spectroscopic characterization. The resulting particles of this procedure are termed “water dots” in later discussion.
2.2. Heavy carbon nanodot collection
Heavy atom carbon nanodots were collected using a strategy similar to what is outlined in Section 2.1; however, the solvent was now 5M hydrobromic acid (pure, ca. 48 wt% solution in water, ACROS Organics) and 5M hydriodic acid (57 wt% in H2O, 99.95%, Sigma-Aldrich) for brominated and iodated carbon nanodots, respectively. Iodated dots were also prepared via a second method. For this set up, an additional chamber was incorporated into the gas line (Scheme S1b). Solid iodine was lightly heated in this chamber to encourage sublimation; methane gas was subsequently mixed with the gaseous iodine. This mixture underwent combustion and the airborne products were pulled through water. Brominated carbon nanodots were also collected and analyzed at 2 and 6 hour intervals, so as to understand luminescence properties as a function of synthesis time. Control samples of carbon nanodots collected into 5M sodium bromide were prepared (NaBr dots) via this same strategy, with subsequent adjustment to acidic pH using hydrochloric acid. For all studies, it can be assumed that the nanodots referenced are 4 hour burns unless stated otherwise. All particles were filtered through a 0.22 μm pore to remove large soot particles prior to analysis or spectroscopic characterization. Following collection and prior to analysis, samples were mixed overnight with glycerol (spectranalyzed®, Fisher Scientific). The addition of glycerol, which is a highly viscous polar solvent, raises the viscosity of solution to slow diffusion of dissolved oxygen. This allows dynamic quenching by dissolved species to be reduced, permitting clearer detection of phosphorescence emission. Stability tests were conducted by storing sample vials on an open bench, exposed to ambient conditions.
2.3. Strategy for pH adjustment
In order to study the effect of pH on luminescence, the pH was monitored using a accumet® XL600 dual channel pH/mV/ion/conductivity/dissolved oxygen meter (Fisher Scientific). Prior to mixing in glycerol, the initial pH was recorded; 5M HCl (37%, Sigma-Aldrich) and 5M NaOH (Fisher Scientific) were then added in microliter volumes to obtain the desired pH. Within an experiment set, all aliquots originated from the same burn sample. Once all desired pH valued samples were collected, volume additions were summed, and appropriate calculations were performed to determine the relative dilution of each aliquot. The samples were then diluted to equal concentrations, mixed overnight with glycerol in a consistent ratio, and analyzed. Immediately prior to analysis, sample pH was confirmed using Sigma® pH test strips to ensure no change. This procedure was followed for both brominated and water dots.
2.4. Instrumentation and analysis
Absorbance values for carbon nanodots and heavy carbon nanodots in both water and glycerol were collected using an Agilent Technologies Cary 60 UV-Vis spectrophotometer with Cary WinUV Scan application software. Emission spectra for both fluorescence and phosphorescence of these samples were collected using a Horiba Scientific FluoroMax®-4P spectrofluorometer at 20°C. All phosphorescence spectra were collected with the following parameters: flash count, 100; time per flash (flash rate), 61 msec (16 Hz); flash delay, 0.05 msec; and sample window, 0.20 msec. Fluorescence photostability studies were conducted using a 405 nm laser excitation source at 5 mW power, with sufficient beam area to cover the sample surface area. Samples absorption intensities were matched at the excitation wavelength, and real-time emission spectra were collected using an Ocean Optics HR2000+ spectrophotometer and SpectraSuite® software (Fig. S1). Under these conditions, no phosphorescence has been reported or detected; photostability therefore is assessed only for fluorescent emission. Fluorescence lifetimes were collected at 20°C using time-correlated single photon counting (TCSPC) instrumentation from Horiba Scientific, equipped with a NanoLED light source (λex = 311 nm, λem > 350nm). Fluorescence decays were analyzed using impulse reconvolution with Decay Analysis Software v6.8. A multiexponential model (eq. 1) with a minimized χ2 criterion was used. Values are reported as both amplitude weighted and mean lifetimes, calculated using Equations 2 and 4 respectively.40 For these equations t is time, τi are the lifetime component values, αi are the amplitudes for each component and Σiαi = 1.
| (1) |
| (2) |
| (3) |
| (4) |
A biexponential, rather than single exponential, model was determined to provide the best fit for the fluorescence decays of carbon nanodots, based on χ2 and residual values. This could be attributed to either different sized particles in solution, or the presence of multiple emitters within a single carbon nanodot structure. Phosphorescence decays of the acidic brominated carbon nanodots were collected with a Varian Cary Eclipse Florescence Spectrophotometer with the lifetime application software (λex = 300 nm, λem = 550nm). Decay traces were fit using a single exponential (i = 1) model of equation 1, minimizing the sum square residuals of the model (R2 > 0.95) as shown in Figure S2. Fluorescence quantum yields (ϕF) were determined using quinine sulfate dihydrate (Fluka™) in 0.5M H2SO4 (95–98%, A.C.S. reagent, Sigma-Adlrich) as a standard.41 Real-color photographs of luminescence emission were taken at 302 nm excitation through longpass filters of 355, 515, 550, and 610 nm cutoff wavelengths using a Nikon D7000 digital SLR camera. Each filter was also stacked with the 355 nm longpass filter to reduce filter fluorescence from ultraviolet excitation.
Dynamic light scattering experiments were conducted for both water and brominated carbon nanodots using a Malvern Zetasizer Nano-ZS. Particle sizes of 0.70 ± 0.09 and 11 ± 4 nm were detected for water dots when distributions were analyzed by intensity; when analyzed by number, the only peak detected reported sizes of 0.70 ± 0.09 nm (Fig. S3a). For brominated carbon nanodots, size distribution by intensity included particles of 0.7 ± 0.1, 8 ± 2, and 190 ± 80 nm; when analyzed by number, only the 0.7 ± 0.1 nm size was detected (Fig. S3b).
3.0. RESULTS AND DISCUSSION
3.1. Bromination of carbon nanodots yields unique phosphorescence
In order to ascertain the spectroscopic impact of introducing bromine into the collection conditions for carbon nanodots, we carefully compared the resulting products of 4 hour burns into both hydrobromic acid (brominated dots) and water (water dots). Although dynamic light scattering (DLS) experiments showed the presence of a new nanodot size under the acid synthesis procedure, DLS data distribution by number revealed the dominate particle size to be ~0.7 nm in diameter for both the water and brominated carbon nanodots (Fig. S3); therefore, it is thought that these particles are largely responsible for luminescence by this collection method. Photostability of both carbon nanodot structures are shown in Figure S1; while the emission signal of carbon nanodots remains fairly stable over five minutes of irradiation, the brominated carbon nanodots see slightly lower photostability. As compared to Fluorescein under otherwise identical conditions, all of the carbon nanodots show weaker photostability (i.e. intensity vs. time, Figure S1). Figure S1b shows the respective integrated areas under the photostability curves. Given that photon flux is proportional to free space quantum yield, then these trends roughly reflect the quantum yields of the respective samples.
Although both water and brominated dots were colorless under room light, each sample emitted a distinct luminescence spectrum when excited at 302 nm. As shown in Figure 1, the brominated dots display strong steady-state luminescence spanning into red wavelengths.
Figure 1.
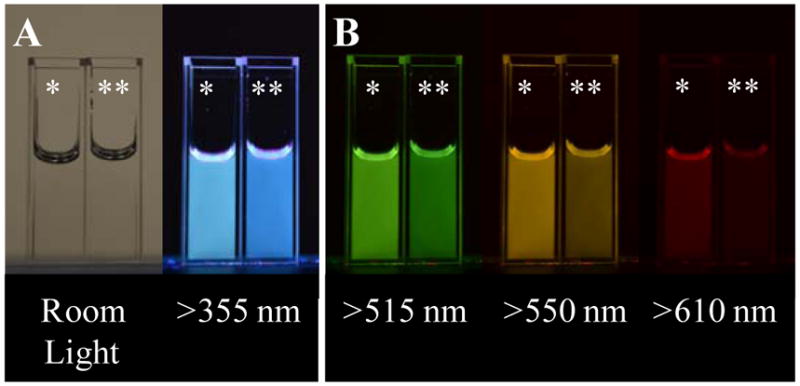
Photographs depicting spectral differences between heavy carbon nanodots (*) and carbon nanodots (**) collected over 4 hours into 5M HBr and water respectively. Samples were adjusted to acidic pH, taken into glycerol and analyzed. A – Left: Samples under room light. Right: Samples under 302 nm excitation photographed through a 355 nm longpass filter. B – Samples excited at 302 nm and photographed through various longpass filters.
This is clearly discernable by the cyan hue of brominated dots as compared to water dots (Fig. 1a). Additionally, the brominated dots continually exhibit visible intensities at longer wavelengths when the emission is filtered through increasingly longer wavelength longpass filters (Fig. 1b). Typically, a triplet excited state will be lower in energy than the corresponding singlet excited state36; therefore, it is reasonable to predict a predominantly red-shifted phosphorescent emission (T1 → S0) of the carbon nanodots. This effect is in fact observed in the reported trends, providing reasonable evidence to the presence of phosphorescence in the brominated dots. From figure 2, we see a shift of approximately 181 nm between the S1 and T1 emissions.
Figure 2.
2D emission of carbon nanodots collected in water versus heavy carbon nanodots excited at 300 nm. Samples were collected, subsequently mixed in glycerol then analyzed. A – Fluorescence emission spectra. B – Off-gated emission displaying phosphorescent signal.
Continuous and off-gated luminescence measurements were subsequently collected for both samples at 300 nm excitation, as shown in Figure 2. The bromine dots typically exhibit lower fluorescence emission (S1 → S0) intensities as compared to the water dots (Fig. 2a). To confirm this trend can be attributed to phosphorescence rather than dynamic diffusional quenching by bromide ions, the emission collection was off-gated by 50 μsec following pulsed excitation at 300 nm (Fig. 2b). This allows for exclusive collection of long-lived luminescence, permitting the phosphorescence to be selectively detected. When analyzed in glycerol, the water dots exhibit no emission at longer wavelengths while brominated dots display notable emission from 500 to 650 nm. This lower energy, long-lived emission is characteristic of a phosphorescence decay and can also be visually observed by suspending each nanodot sample in glycerol versus water (Fig. 3).
Figure 3.
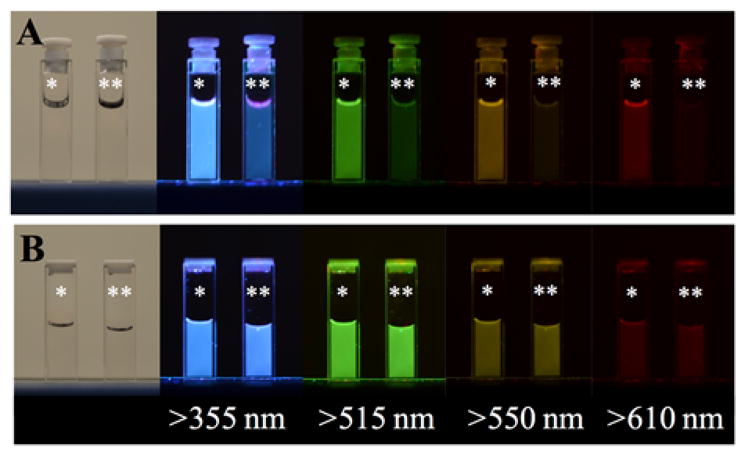
Photographs depicting the solvent effects of glycerol (*) versus water (**) on the emission of carbon nanodots at highly acidic pH. Samples were photographed both under room light and 302 nm excitation with various longpass filters. It is important to note that brightness should not be directly compared between A and B, as photographs were taken using automatic settings and exposure time was not held constant. A – Heavy carbon nanodots collected into 5M HBr. B – Water dots collected into DI water then pH adjusted using 5M HCl.
When brominated nanodots are suspended in glycerol the phosphorescence emission is clearly visible; however, when analyzed in water, dissolved oxygen readily quenches the intensity (Fig. 3a). This is a potential indicator of long-lived emission signals, as molecular oxygen is known to quench these prolonged excited states. In fact, phosphorescence is frequently difficult to detect in fluid solutions at room temperature due to diffusional quenchers like oxygen.37 By using a viscous solvent such as glycerol, the rate of quencher diffusion slows and these signals become detectable for strongly phosphorescent species. While this alone does not confirm that the emission is phosphorescence, that the emission of these particles is red-shifted (Figures 1 and 2) supports that the long-lived signal quenched in water is likely of triplet origin. Conversely, water dots suspended in either water or glycerol do not exhibit any notable differences in emission between solvents, likely indicating the absence of long-lived emission (Fig. 3b).
Subsequently, fluorescence lifetime analysis was conducted to observe the impact of bromination on carbon nanodots. The increased incidence of intersystem crossing between the singlet and triplet excited states readily results in decreased fluorescence lifetime decays (S1 → S0) for phosphorescent compounds, which is actually observed for the brominated dots (Fig. S4).42 Similarly, as shown in Table 1, brominated dots display a decrease in both amplitude weighted and mean lifetime as compared to water dots. This corresponds to a new phosphorescence T1 lifetime of the brominated nanodots (T1 → S0), shown in Figure S2. At approximately 92 μsec, this reported lifetime is over 1000x longer than the corresponding fluorescence S1 → S0 emission, which occurs on a much shorter, nanosecond timescale.
Table 1.
Luminescence Properties of Carbon Nanodots Collected in Water Versus Heavy Carbon Nanodots at Acidic pH.
| Sample | ΦF | 〈τ〉F (ns) | τ̄F (ns) | τP (μs) |
|---|---|---|---|---|
| Water Nanodot | 10.2% | 7.42 ± 0.05 | 8.39 ± 0.09 | - |
| Brominated Nanodot | 4.85% | 4.5 ± 0.2 | 6.2 ± 0.4 | 92 ± 7 |
| NaBr Nanodot | 8.8% | 6.6 ± 0.1 | 8.7 ± 0.2 | - |
Φ — quantum yield
〈τ〉 — amplitude weighted lifetime
τ̄ — average lifetime
F – fluorescence
P – phosphorescence
Similarly, the fluorescence quantum yield shows a marked decrease for brominated dots as compared to that of water dots. While it is possible that this could be explained to some degree by quenching from free bromine ions, it is interesting to note that the fluorescence lifetime values for carbon dots in 5M sodium bromide are comparable to those of water dots alone. In a similar vein, the quantum yield of the NaBr dots is only slightly reduced relative to the water dots, which could demonstrate quenching effects of the free bromide ions. This observation supports that the absorbed energy sees less incidence of relaxation via fluorescence not only due to quenching, but also as a result of higher incidence of intersystem crossing for the phosphorescent brominated dots. These observations implicate phosphorescence as a key radiative pathway in the new, heavy carbon nanodots. Using the same off-gated detection method, it was found that at room temperature brominated dots exhibited detectable phosphorescence signals for excitation wavelengths between 250 and 400nm (Fig. S5). Interestingly, the phosphorescent emission displays a red shift with increasing excitation wavelength. For a single emission particle type, one would expect the emission spectrum to be invariant relative to excitation wavelength. The progressively shifted phosphorescent spectra suggests multiple emitting particles. This is not entirely unexpected; as previously mentioned, studies have shown the fluorescent carbon nanodots to have similar characteristics. In essence, via this collection strategy the fluorescent particles themselves are brominated. Water dots, even when suspended in glycerol, exhibit no phosphorescence over the same wavelength range (Fig. S5b).
Brominated dots were also collected over variable time intervals to examine the effect of burn time on phosphorescence. Burns of 2, 4 and 6 hours were conducted (Fig. S6). While at 2 hours no discernable emission was observed, phosphorescence intensity became detectable and subsequently increased at longer burn times. This effect is attributed to increased dot concentrations over time. Interestingly, the fluorescence emission decreases as the phosphorescence of the brominated carbon nanodot increases. To establish the importance of direct collection of nanodots into a bromine solvent, water dots were subsequently collected over varying times, and then refluxed with hydrobromic acid as a secondary step (Fig. S6b). Following this procedure, no significant phosphorescence intensities are observed for the refluxed system at 2 and 4 hours; only the 6-hour burn generated a phosphorescence signal, which was nevertheless at a much lower intensity as compared to the direct collection method. Direct gaseous collection into 5M HBr is therefore proposed as a key step in generating a phosphorescent heavy carbon nanodot. These data additionally provide insight into the mode by which bromine induces intersystem crossing in the carbon nanodot system. If this phosphorescence was merely an external, solvent-based effect, it could be reasonably predicted that phosphorescence would be observed for both direct collection and post-collection reflux methods. This is not observed, however, which suggests that the underlying photophysical mechanism of phosphorescence is likely due to an internal heavy atom effect, where bromine is incorporated into the carbon nanodot structure.
3.2. Iodation versus bromination for phosphorescence character
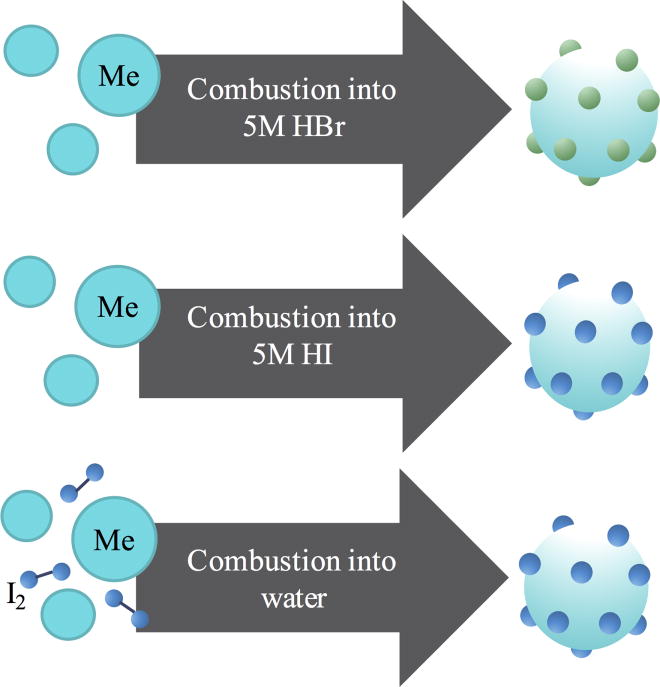
It is well known that iodine, in addition to bromine, can induce triplet character in organic fluorophores. We then questioned whether this approach would cause a similar effect in carbon nanodots. Our collective approaches for halogenating the carbon nanodots are shown in scheme 1.
Scheme 1.
Three synthetic routes explored to produce heavy carbon nanodots.
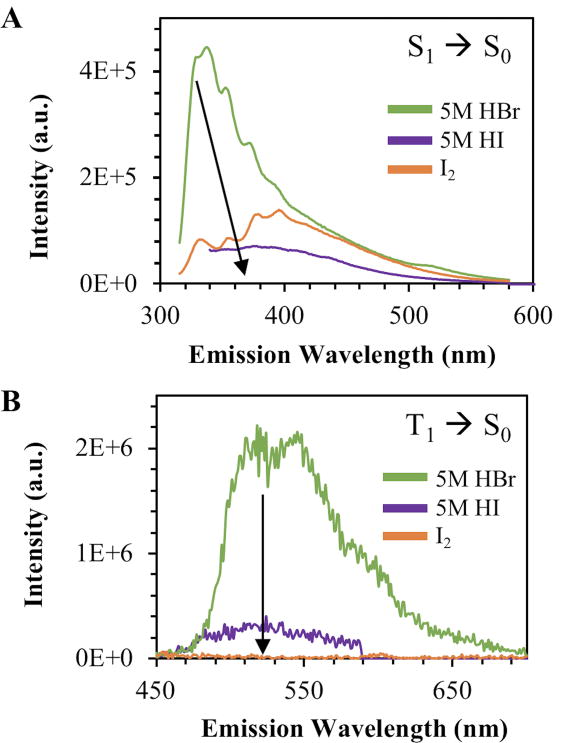
The nanodots produced by each of these methods were analyzed by both continuous and off-gated luminescence collection. As shown in Figure 4, bromine dots exhibited the highest intensity fluorescence signal as compared to either method of collecting iodated dots.
Figure 4.
2D luminescence signals for heavy carbon nanodots collected via the 3 main synthetic routes. Samples were taken into glycerol and then analyzed. A – Fluorescence emission spectra recorded at 300 nm excitation. B - Phosphorescence emission spectra recorded at 300 nm excitation wavelength.
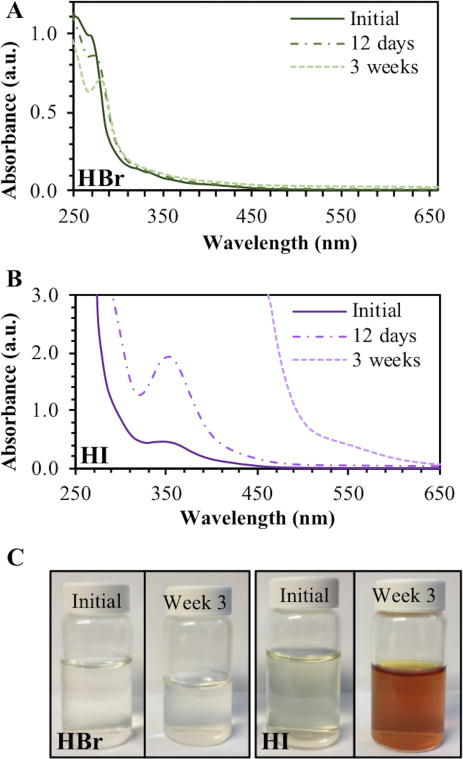
While this trend could indicate superior rates of intersystem crossing for iodated dots, this would lead to a significant phosphorescent peak upon off-gated collection. This would align with the prediction that iodine should generate a stronger spin orbit coupling effect, based on its increased nuclear charge as compared to bromine. This trend, however, is not observed (Fig. 4b). The lack of strong phosphorescence in iodated nanodots could indicate that covalent attachment of iodine to the nanostructure is not as efficient as bromination to produce a phosphorescence signal. Given the long bond length associated with carbon-iodine bonds, this attachment may be unstable, leading to increased concentrations of free iodide in solution and subsequently the observation of I3-, as shown in Figure 5.
Figure 5.
Demonstration of relative stability between two types of heavy carbon nanodots. A – Brominated heavy carbon nanodots by acid collection (HBr). B – Iodinated heavy carbon nanodots by acid collection (HI). C – Photographs of samples over 3 weeks of ambient light exposure at room temperature.
Conversely, iodide may be blocking luminescence through dynamic quenching, as both the fluorescence and phosphorescence signals emitted by the acid iodation strategy are approximately one order of magnitude lower than the spectra of brominated dots. Comparing the acid collection method against the combustion method of collecting iodated dots, it was noted that only the acid method generated detectable phosphorescence. This poses an interesting question of the role of pH in obtaining a phosphorescence signal, which will be discussed in a later section.
To further suggest acid bromination as the superior method for collecting heavy carbon nanodots, both acid collection methods were analyzed for long term dark stability. As shown in Figure 5, the absorbance spectra—particularly at 300 nm were excitation occurs—showed little change for brominated dots over the period of three weeks (Fig. 5a). The absorbance spectra for the iodated dots, however, increased drastically over the same time frame, with complete detector saturation in the range of 250 – 450 nm by three weeks (Fig. 5b). This can be attributed to the increased solution coloration of the iodated dot sample, which essentially behaves as a longpass filter (Fig. 5c). This coloration is likely due to the formation of triiodide ions (I3-), which are known to appear yellow to brown in water. This suggests that iodide dissociates from the nanostructure over time, further supporting the hypothesis that iodine is not able to functionalize carbon nanodots as efficiently as bromine. The spectra for brominated dots was further analyzed over a month-long period (Fig. S7). Although absorbance at 300 nm remained roughly constant as observed previously, there was a clear shift in the fluorescence spectrum. This could indicate a shift in electronic structure over time and will require further study to characterize the origin of this change. Phosphorescence, however, remained detectable throughout the duration of the experiment and in fact reached its maximum intensity at the conclusion of one month (Fig. S7c).
3.3. Effect of pH on phosphorescence signal
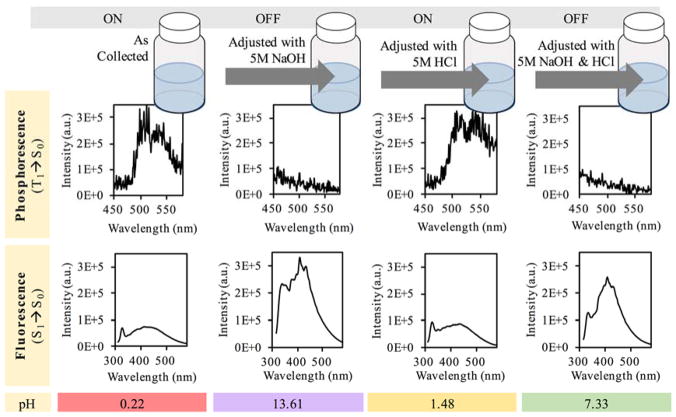
Provided that this halogenation strategy involves the use of either hydrobromic or hydroiodic acid, it was prudent to study the influence of pH on the photophysical properties of the heavy carbon nanodots. As shown in Figure 6, it is clear that under acidic conditions phosphorescence was favored over fluorescence, while the inverse was observed for both neutral and basic conditions. Phosphorescence signals with approximately equal intensity could be turned “on” or “off” within the same sample by simply adjusting the pH from acidic to basic and then back to an acidic environment. This suggests that protonation may play a key role in the mechanism of the observed phosphorescence, as protonation can be a reversible process.
Figure 6.
Schematic and luminescence spectra from pH adjusted brominated carbon nanodots collected into 5M HBr for a 4 hour burn time. Samples were diluted to equal concentrations, mixed with glycerol and then excited with a 300 nm wavelength.
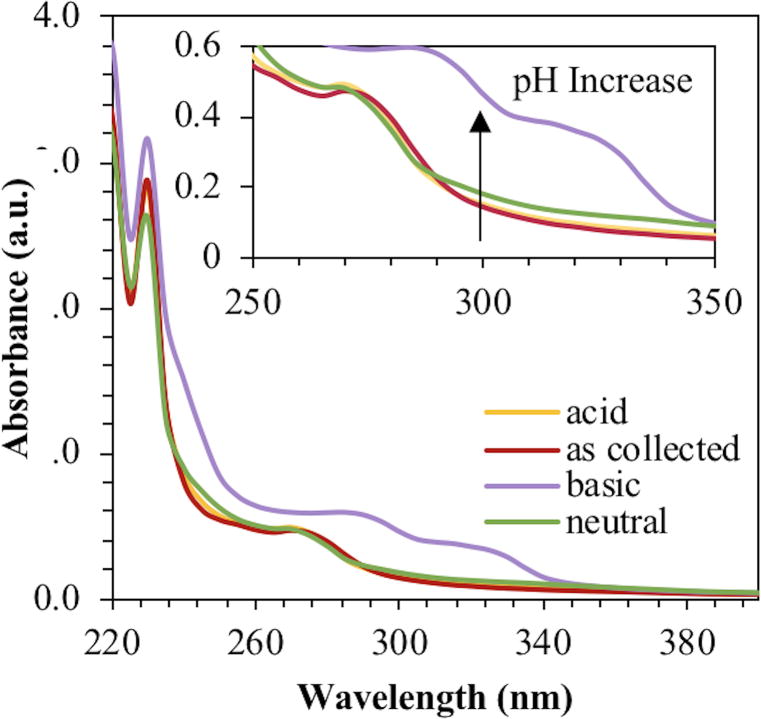
Fluorescence intensities were also comparable between either phosphorescence “on” or “off” aliquots. Interestingly, the absorbance at 300 nm increased with increasing pH, suggesting protonation and formation of a ground state complex (Fig. 7).
Figure 7.
Absorbance spectra for pH adjusted brominated carbon nanodots. Samples were analyzed in water.
A visual summary of these reported pH effects is displayed in Figure 8.
Figure 8.
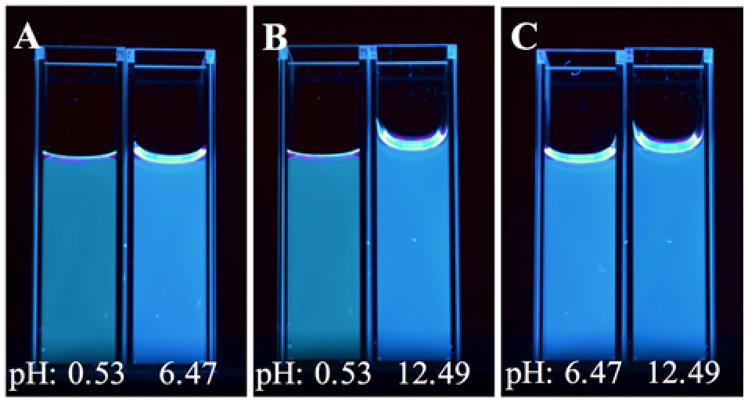
Photos depicting heavy carbon nanodots collected in 5M HBr for 4 hours following pH adjustment. Samples were taken into glycerol, mixed and photographed at 302 nm excitation through a 355 nm long pass filter. A – Comparison between acidic and neutral samples. B – Comparison between acidic and basic samples. C – Comparison between neutral and basic samples.
Samples at low pH display a distinctly greenish hue when compared against the neutral or basic samples (Fig. 8a,b). The neutral and basic samples, however, appear to emit the same color (Fig. 8c). This implies that the acidic samples emit higher intensities of longer wavelengths due to a significant luminescence contribution from phosphorescence in the 500 to 600 nm range. This effect is displayed in the off-gated collection from Figure 6. The neutral and basic samples, however, emit only between ~300 to 500 nm, and therefore are similar in their blue emission.
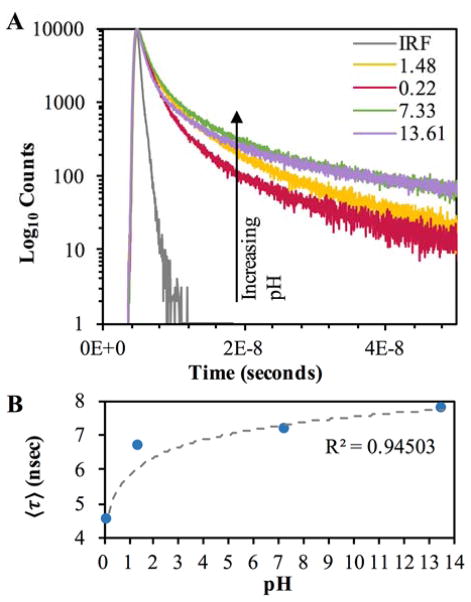
Fluorescence lifetimes of these samples were determined using the TCSPC technique and are summarized in Figure 9, with additional information provided in Figure S8.
Figure 9.
Fluorescence intensity decay of pH modified heavy carbon nanodots collected into 5M HBr using TCSPC techniques. Samples were analyzed in glycerol. (λex = 311 nm, λem > 350 nm) A – Fluorescence lifetime decays for each pH adjusted sample. B – Chart displaying the effect of pH on amplitude weighted lifetimes (〈τ〉).
Decay curves for each pH are plotted, revealing a clear increase in amplitude weighted lifetime corresponding to increasing pH (Fig. 9). This is anticipated, as the fluorescence quantum yield increases at higher pH and radiative lifetime is proportional to quantum yield.43 When lifetimes are calculated there is a clear increase in lifetime proportional to pH, as shown in Table 2.
Table 2.
Lifetime Decays for Water Dots Versus Brominated Dots.
| Sample | pH | τ1 (ns) / α1 (%) | τ2 (ns) / α2 (%) | 〈τ〉(ns) | τ̄ (ns) |
|---|---|---|---|---|---|
| Water Dot (4hr) | 0.96 | 2.48/22.8 | 8.88/77.2 | 7.42 ± 0.05 | 8.39 ± 0.09 |
| 1.02 | 2.62/26.3 | 8.69/74 | 7.09 ± 0.05 | 8.10 ± 0.09 | |
| 3.28* | 2.31/21.7 | 8.97/78.3 | 7.53 ± 0.04 | 8.53 ± 0.07 | |
| 7.86 | 2.39/29 | 8.41/71.1 | 6.67 ± 0.08 | 7.8 ± 0.1 | |
| 12.45 | 2.95/24.6 | 10.8/75.4 | 8.9 ± 0.1 | 10.1 ± 0.2 | |
| Bromine Dot (4hr) | 0.22* | 1.53/45 | 7.01/55 | 4.5 ± 0.2 | 6.2 ± 0.4 |
| 1.48 | 2.38/37 | 9.02/63 | 6.56 ± 0.07 | 8.1 ± 0.1 | |
| 7.33 | 2.00/32 | 9.42/68 | 7.1 ± 0.4 | 8.8 ± 0.6 | |
| 13.61 | 1.95/29 | 10.0/71 | 7.7 ± 0.3 | 9.4 ± 0.6 |
τn — lifetime of component n
α1 — amplitude of τn
〈τ〉— amplitude weighted lifetime
τ̄ — average lifetime
sample pH as collected
There is no trend in pH dependence observed in the fluorescence lifetime decays for the water dots, and no detectable phosphorescence is evident (Fig. S9). Over the entire pH range of water dots, the averaged values for amplitude weighted and mean lifetimes are 7.5 and 8.6 nsec respectively, with a ±10% relative standard deviation in both cases. This stands in contrast to the averaged lifetimes for brominated dots, which are 6.5 ±22% (amplitude weighted) and 8.1 ±17% (mean) nsec. This further reinforces the notion that without a phosphorescence pathway, pH has little effect on the nanodot emission. In brominated dots, where phosphorescence occurs, this is not the case. The results reported here clearly demonstrate how at lower pH values, intersystem crossing and subsequent phosphorescence emission provides a competitive pathway for fluorescence emission in brominated carbon nanodots.
4.0. CONCLUSIONS
We have developed a successful strategy for the development of phosphorescent heavy carbon nanodots. In initial experiments, it was confirmed that brominated dots gathered by an acid collection strategy could produce unique long-lived signals at longer emission wavelengths as compared to those observed for water dots. Phosphorescence was not observed when previously collected water dots were reacted with hydrobromic acid, establishing direct collection into acid as a vital aspect in forming phosphorescent carbon nanodots. This observation additionally supports the assertion that phosphorescence is achieved via the internal heavy atom effect, as suspension in a heavy atom solvent is not adequate to generate the desired signal. Addition of iodine to the carbon nanodot structure was also explored by two methods. It was determined that of these methods, acid collection provided the most reliable system for generating phosphorescence signals. Long-lived luminescence signals were detected for both iodated and brominated dots via this method. Despite this observation, subsequent experiments confirmed the brominated dots to be superior phosphors to iodated dots; the former achieved both higher phosphorescence signal intensity and improved dark stability as compared to the latter. Studies were also conducted using brominated dots to determine the importance of sample pH in the generation of phosphorescence. It was discovered that fluorescence or phosphorescence could be selected for by altering the sample to higher or lower pH values, respectively. This trend lends evidence to the possible role of protonation in promoting intersystem crossing from the singlet to triplet state in brominated dots. Overall, this study serves to introduce a facile, novel method for achieving phosphorescence from a carbon nanodot luminescent agent.
Supplementary Material
Scheme S1. Experimental production of carbon nanodots. A – Standard collection method. B – Altered production method for collection of iodated nanodots.
Figure S1. Photostability of carbon nanodot structures relative to 32.3 μM Fluorescein. Absorption values were matched for each sample at the excitation wavelength (λex = 405 nm, 5 mW) with <1% deviation from average absorption. A – Normalized emission intensity decay over time, integrated from 450 – 600 nm per each time point. B – Normalized integration values of A, demonstrating cumulative emission intensity during 5 minutes of irradiation. Fluorescein was used as the normalization standard.
Figure S2. Phosphorescence intensity decay of brominated carbon nanodots (4hr) with single exponential fit. Inset represents the fit residuals. Collection parameters: λex = 300nm, λem = 550 nm, Gate time = 0.05 msec, Delay time = 0.07 msec.
Figure S3. Diameter of carbon nanodot structures as analyzed by dynamic light scattering techniques. A – Size distribution by number of carbon nanodots collected into water. The inset is distribution by intensity. B – Size distribution by number of brominated carbon nanodots. The inset is distribution by intensity.
Figure S4. Fluorescence intensity decays (λ(ex,em) = 311/350 nm) of carbon nanodots collected into water versus heavy carbon nanodots collected into 5M HBr over a 4 hour burn time. Samples were taken into glycerol and then analyzed at an equivalent pH. A – Intensity decays anayzed by TCSPC method. B – Plot of reported lifetime versus exponential component of decay model. (PDF)
Figure S5. Phosphorescence emission spectra for heavy carbon nanodots collected into 5M HBr versus that of carbon nanodots collected into water. Both samples were taken into glycerol and analyzed at at equivalent pH values for excitation wavelengths including 250, 300, 350, and 400 nm. A – Emission spectra versus wavelength for heavy carbon nanodots. B – Phosphorescence emission spectra for carbon nanodots collected into water over the same excitation range. (PDF)
Figure S6. Effect of burn or reaction time on the generation of a phosphorescent signal from heavy carbon nanodots collected into 5M HBr, excited at 300 nm. A – Luminescence emission spectra for samples of 2, 4, and 6 hour burn times, collected directly into 5M HBr. B – Phosphorescence emission spectra for samples collected over a 2, 4, and 6 hour burn time collected first into water, then refluxed with 5M HBr for 2, 4, and 6 hour time increments. It should be noted that the scale between A and B differ by an order of magnitude. (PDF)
Figure S7. Luminescence stability of heavy carbon nanodots collected into 5M HBr for 4 hours. The sample was prepared as a glycerol mixture and kept stirring just above room temperature for the period of 1 month. The sample was periodically removed, analyzed, and returned to the mixing conditions. A – Sample absorbance. B – Sample fluorescence, excited at 300 nm. C – Sample phosphorescence, excited at 300 nm. (PDF)
Figure S8. Analysis of fluorescence intensity decays of brominated carbon nanodots collected into 5M HBr over 4 hours. Samples were pH adjusted, diluted to equal concentrations, then analyzed in glycerol. Insets indicate residual values for each model fit. (λex = 311 nm, λem > 350 nm) A – Sample as collected, pH = 0.22. B – Basic sample, pH = 13.61. C – Acidic sample, pH = 1.28. D – Neutral sample, pH = 7.33.
Figure S9. Spectral data for carbon nanodots collected into water for 4 hours and then pH adjusted. A – Fluorescence spectra for samples of varying pH. Samples were analyzed in water at 300 nm excitation. B – Phosphorescence spectra for samples of varying pH. Samples were analyzed in glycerol at 300 nm excitation. C – Fluorescence lifetime decays for samples in glycerol (λ_ex=311 nm, λ_em=350 nm). D – Chart summarizing the change in amplitude weighted lifetimes (〈τ〉) as a function sample pH. (PDF)
Acknowledgments
Funding Sources.
National Institutes of Health (NIH) Chemistry Biology Interface (CBI) Program at University of Maryland Baltimore County – 5T32GM066706-14.
Institute of Fluorescence at the University of Maryland Baltimore County Internal Funding.
The authors acknowledge the Institute of Fluorescence (IoF) as well as the Department of Chemistry and Biochemistry at the University of Maryland Baltimore County (UMBC) for financial support. We also acknowledge the support for Dr. Marie-Christine Daniel at UMBC for help and guidance with DLS measurements.
ABBREIVATIONS
- TCSPC
Time correlated single photon counting
Footnotes
Author Contributions.
All information reported was written by Rachael Knoblauch and edited by Dr. Chris D. Geddes. All experiments were designed by and executed under the supervision of Dr. Chris D. Geddes and Rachael Knoblauch. Undergraduate researchers Brian Bui and Ammar Raza aided in the implementation of experiments and collection of data.
Conflicts of Interest.
There are no conflicts of interest to declare.
References
- 1.Namdari P, Negahdari B, Eatemadi A. Biomedicine & Pharmacotherapy. 2017;87:209–222. doi: 10.1016/j.biopha.2016.12.108. [DOI] [PubMed] [Google Scholar]
- 2.Kai J, Yuhui W, Congzhong C, Hengwei L. Chemistry of Materials. 2017;29:4866–4873. [Google Scholar]
- 3.Liu J, Wang N, Yu Y, Yan Y, Zhang H, Li J, Yu J. Science Advances. 2017;3:e1603171–e1603171. doi: 10.1126/sciadv.1603171. [DOI] [PMC free article] [PubMed] [Google Scholar]
- 4.Tao S, Lu S, Geng Y, Zhu S, Redfern SAT, Song Y, Feng T, Xu W, Yang B. Angewandte Chemie. 2018;130:2417–2422. doi: 10.1002/anie.201712662. [DOI] [PubMed] [Google Scholar]
- 5.Li Q, Zhou M, Yang M, Yang Q, Zhang Z, Shi J. Nature Communications. 2018;9:734–734. doi: 10.1038/s41467-018-03144-9. [DOI] [PMC free article] [PubMed] [Google Scholar]
- 6.Goryacheva IY, Sapelkin AV, Sukhorukov GB. TrAC Trends in Analytical Chemistry. 2017;90:27–37. [Google Scholar]
- 7.Hong GS, Diao SO, Antaris AL, Dai HJ. CHEMICAL REVIEWS. 2015;115:10816–10906. doi: 10.1021/acs.chemrev.5b00008. [DOI] [PubMed] [Google Scholar]
- 8.Shamsipur M, Barati A, Karami S. Carbon. 2017;124:429–472. [Google Scholar]
- 9.Jiang JH, Li Q, Liu L, Liu JW, Yu RQ, Chu X. TRAC-TRENDS IN ANALYTICAL CHEMISTRY. 2014;58:130–144. [Google Scholar]
- 10.Zheng Q, Jockusch S, Rodríguez-Calero GG, Zhou Z, Zhao H, Altman RB, Abruña HD, Blanchard SC. Photochemical & Photobiological Sciences: Official Journal Of The European Photochemistry Association And The European Society For Photobiology. 2016;15:196–203. doi: 10.1039/c5pp00400d. [DOI] [PMC free article] [PubMed] [Google Scholar]
- 11.Resch-Genger U, Grabolle M, Cavaliere-Jaricot S, Nitschke R, Nann T. Nature Methods. 2008;5:763–775. doi: 10.1038/nmeth.1248. [DOI] [PubMed] [Google Scholar]
- 12.Derfus AM, Chan WCW, Bhatia SN. Nano Letters. 2004;4:11–18. doi: 10.1021/nl0347334. [DOI] [PMC free article] [PubMed] [Google Scholar]
- 13.Ron Hardman a. Environmental Health Perspectives. 2006:165. doi: 10.1289/ehp.8284. [DOI] [PMC free article] [PubMed] [Google Scholar]
- 14.Haitao L, Zhenhui K, Yang L, Shuit-Tong L. Journal of Materials Chemistry. 2012;22:24230–24253. [Google Scholar]
- 15.Deng Y, Zhao D, Chen X, Wang F, Song H, Shen D. CHEMICAL COMMUNICATIONS. 2013;49:5751–5753. doi: 10.1039/c3cc42600a. [DOI] [PubMed] [Google Scholar]
- 16.Roy P, Chen PC, Periasamy AP, Chen YN, Chang HT. Materials Today. 2015;18:447–458. [Google Scholar]
- 17.Yuan F, Li S, Fan Z, Meng X, Fan L, Yang S. Nano Today. 2016;11:565–586. [Google Scholar]
- 18.Chong Y, Ma Y, Shen H, Tu X, Zhou X, Xu J, Dai J, Fan S, Zhang Z. Biomaterials. 2014;35:5041–5048. doi: 10.1016/j.biomaterials.2014.03.021. [DOI] [PubMed] [Google Scholar]
- 19.Li H, Ming H, Liu Y, Yu H, He X, Huang H, Pan K, Kang Z. NEW JOURNAL OF CHEMISTRY. 2011;35:2666–2670. [Google Scholar]
- 20.Wang J, Su S, Wei J, Bahgi R, Hope-Weeks L, Qiu J, Wang S. Physica E: Low-dimensional Systems and Nanostructures. 2015;72:17–24. [Google Scholar]
- 21.Li X, Wang H, Shimizu Y, Pyatenko A, Kawaguchi K, Koshizaki N. Chemical Communications (Cambridge, England) 2011;47:932–934. doi: 10.1039/c0cc03552a. [DOI] [PubMed] [Google Scholar]
- 22.Xu ZQ, Lan JY, Jin JC, Gao T, Pan LL, Jiang FL, Liu Y. Colloids and Surfaces B: Biointerfaces. 2015;130:207–214. doi: 10.1016/j.colsurfb.2015.04.012. [DOI] [PubMed] [Google Scholar]
- 23.Nguyen V, Yan L, Xu H, Yue M. Applied Surface Science. 2018;427:1118–1123. [Google Scholar]
- 24.Zhang MM, Ju HX, Zhang L, Sun MZ, Zhou ZW, Dai ZY, Zhang LR, Gong AH, Wu CY, Du FY. INTERNATIONAL JOURNAL OF NANOMEDICINE. 2015:10. doi: 10.2147/IJN.S82778. [DOI] [PMC free article] [PubMed] [Google Scholar]
- 25.Kumar R, Mpip AKB, Koynov K, Ohulchanskyy T, Li Q, Ohulchanskyy TY, Bonoiu A, Prasad PN, Liu R, Wu D, Best A. JOURNAL OF PHYSICAL CHEMISTRY C. 2010;114:12062–12068. [Google Scholar]
- 26.Wang J, Qiu J. Journal of Materials Science. 2016;51:4728–4738. [Google Scholar]
- 27.Koshel EI, Chelushkin PS, Melnikov AS, Serdobintsev PY, Stolbovaia AY, Saifitdinova AF, Shcheslavskiy VI, Chernyavskiy O, Gaginskaya ER, Koshevoy IO, Tunik SP. Journal of Photochemistry & Photobiology A: Chemistry. 2017;332:122–130. [Google Scholar]
- 28.Xiangmei L, Na X, Shujuan L, Yun M, Huiran Y, Haoran L, Junhui H, Qiang Z, Fuyou L, Wei H. Journal of Materials Chemistry. 2012;22:7894–7901. [Google Scholar]
- 29.Neaime C, Amela-Cortes M, Grasset F, Molard Y, Cordier S, Dierre B, Mortier M, Takei T, Takahashi K, Haneda H, Verelst M, Lechevallier S. Physical Chemistry Chemical Physics. 2016;18:30166–30173. doi: 10.1039/c6cp05290h. [DOI] [PubMed] [Google Scholar]
- 30.Lu KL, Thanasekaran P, Veerasamy S, Sathish V, Ramdass A, Rajagopal S. JOURNAL OF PHOTOCHEMISTRY AND PHOTOBIOLOGY C-PHOTOCHEMISTRY REVIEWS. 2015;23:25–44. [Google Scholar]
- 31.He T, Hu W, Shi H, Pan Q, Ma G, Huang W, Fan Q, Lin X. Dyes and Pigments. 2015;123:218–221. [Google Scholar]
- 32.Becker RS. Theory and interpretation of fluorescence and phosphorescence. Vol. 1969 New York: Wiley Interscience; 1969. [Google Scholar]
- 33.Chen Y, Guan R, Zhang C, Huang J, Ji L, Chao H. Coordination Chemistry Reviews. 2016;310:16–40. [Google Scholar]
- 34.Bergamini G, Silvi S. Applied photochemistry : when light meets molecules. Vol. 2016 Switzerland: Springer; 2016. [Google Scholar]
- 35.Papkovsky DB. Phosphorescent oxygen-sensitive probes. [electronic resource] Vol. 2012 Basel ; New York: Springer; c2012. [Google Scholar]
- 36.Turro NJ. Modern molecular photochemistry. Vol. 1991 Mill Valley, Calif: University Science Books; c1991. [Google Scholar]
- 37.Hercules DM. Fluorescence and phosphorescence analysis: principles and applications. Vol. 1966 New York: Interscience Publishers; 1966. [Google Scholar]
- 38.Omary MA, Elbjeirami O, Rawashdeh-Omary MA. RESEARCH ON CHEMICAL INTERMEDIATES. 2011;37:691–703. [Google Scholar]
- 39.Qian Z, Zhou J, Lin P, Ma J, Shan X, Feng H, Chen C, Chen J. RSC ADVANCES. 2013;3:9625–9628. [Google Scholar]
- 40.Zhang Y, Aslan K, Previte MJR, Geddes CD. Chemical Physics Letters. 2008;458:147–151. doi: 10.1016/j.cplett.2008.04.083. [DOI] [PMC free article] [PubMed] [Google Scholar]
- 41.Eaton DF. Pure & Appl Chem. 1988;60:8. [Google Scholar]
- 42.Lakowicz JR. Principles of fluorescence spectroscopy. 3. Vol. 2006 New York: Springer; c2006. [Google Scholar]
- 43.Geddes CD, Lakowicz JR. Journal of Fluorescence. 2002;12:121–129. doi: 10.1023/A:1021341305229. [DOI] [PMC free article] [PubMed] [Google Scholar]
Associated Data
This section collects any data citations, data availability statements, or supplementary materials included in this article.
Supplementary Materials
Scheme S1. Experimental production of carbon nanodots. A – Standard collection method. B – Altered production method for collection of iodated nanodots.
Figure S1. Photostability of carbon nanodot structures relative to 32.3 μM Fluorescein. Absorption values were matched for each sample at the excitation wavelength (λex = 405 nm, 5 mW) with <1% deviation from average absorption. A – Normalized emission intensity decay over time, integrated from 450 – 600 nm per each time point. B – Normalized integration values of A, demonstrating cumulative emission intensity during 5 minutes of irradiation. Fluorescein was used as the normalization standard.
Figure S2. Phosphorescence intensity decay of brominated carbon nanodots (4hr) with single exponential fit. Inset represents the fit residuals. Collection parameters: λex = 300nm, λem = 550 nm, Gate time = 0.05 msec, Delay time = 0.07 msec.
Figure S3. Diameter of carbon nanodot structures as analyzed by dynamic light scattering techniques. A – Size distribution by number of carbon nanodots collected into water. The inset is distribution by intensity. B – Size distribution by number of brominated carbon nanodots. The inset is distribution by intensity.
Figure S4. Fluorescence intensity decays (λ(ex,em) = 311/350 nm) of carbon nanodots collected into water versus heavy carbon nanodots collected into 5M HBr over a 4 hour burn time. Samples were taken into glycerol and then analyzed at an equivalent pH. A – Intensity decays anayzed by TCSPC method. B – Plot of reported lifetime versus exponential component of decay model. (PDF)
Figure S5. Phosphorescence emission spectra for heavy carbon nanodots collected into 5M HBr versus that of carbon nanodots collected into water. Both samples were taken into glycerol and analyzed at at equivalent pH values for excitation wavelengths including 250, 300, 350, and 400 nm. A – Emission spectra versus wavelength for heavy carbon nanodots. B – Phosphorescence emission spectra for carbon nanodots collected into water over the same excitation range. (PDF)
Figure S6. Effect of burn or reaction time on the generation of a phosphorescent signal from heavy carbon nanodots collected into 5M HBr, excited at 300 nm. A – Luminescence emission spectra for samples of 2, 4, and 6 hour burn times, collected directly into 5M HBr. B – Phosphorescence emission spectra for samples collected over a 2, 4, and 6 hour burn time collected first into water, then refluxed with 5M HBr for 2, 4, and 6 hour time increments. It should be noted that the scale between A and B differ by an order of magnitude. (PDF)
Figure S7. Luminescence stability of heavy carbon nanodots collected into 5M HBr for 4 hours. The sample was prepared as a glycerol mixture and kept stirring just above room temperature for the period of 1 month. The sample was periodically removed, analyzed, and returned to the mixing conditions. A – Sample absorbance. B – Sample fluorescence, excited at 300 nm. C – Sample phosphorescence, excited at 300 nm. (PDF)
Figure S8. Analysis of fluorescence intensity decays of brominated carbon nanodots collected into 5M HBr over 4 hours. Samples were pH adjusted, diluted to equal concentrations, then analyzed in glycerol. Insets indicate residual values for each model fit. (λex = 311 nm, λem > 350 nm) A – Sample as collected, pH = 0.22. B – Basic sample, pH = 13.61. C – Acidic sample, pH = 1.28. D – Neutral sample, pH = 7.33.
Figure S9. Spectral data for carbon nanodots collected into water for 4 hours and then pH adjusted. A – Fluorescence spectra for samples of varying pH. Samples were analyzed in water at 300 nm excitation. B – Phosphorescence spectra for samples of varying pH. Samples were analyzed in glycerol at 300 nm excitation. C – Fluorescence lifetime decays for samples in glycerol (λ_ex=311 nm, λ_em=350 nm). D – Chart summarizing the change in amplitude weighted lifetimes (〈τ〉) as a function sample pH. (PDF)


