Abstract
The vertebrate unfolded protein response (UPR) is characterized by multiple interacting nodes among its three pathways, yet the logic underlying this regulatory complexity is unclear. To begin to address this issue, we created a computational model of the vertebrate UPR that was entrained upon and then validated against experimental data. As part of this validation, the model successfully predicted the phenotypes of cells with lesions in UPR signaling, including a surprising and previously unreported differential role for the eIF2α phosphatase GADD34 in exacerbating severe stress but ameliorating mild stress. We then used the model to test the functional importance of a feedforward circuit within the PERK/CHOP axis and of cross-regulatory control of BiP and CHOP expression. We found that the wiring structure of the UPR appears to balance the ability of the response to remain sensitive to endoplasmic reticulum stress and to be deactivated rapidly by improved protein-folding conditions. This model should serve as a valuable resource for further exploring the regulatory logic of the UPR.
INTRODUCTION
The vertebrate unfolded protein response (UPR) is a complex signal-transduction pathway with multiple points of overlap and feedback (both positive and negative) and feedforward loops. At least three pathways constitute the UPR, initiated by IRE1 (the ubiquitous α and tissue-specific β paralogues), PERK, and the partially redundant ATF6 α and β pathways (Parmar and Schröder, 2012). Although IRE1 mediates degradation of endoplasmic reticulum (ER)-associated mRNAs (known as regulated IRE1-dependent decay, or RIDD) (Hollien and Weissman, 2006; Hollien et al., 2009) and PERK effects translational arrest (Harding et al., 1999), each UPR pathway also culminates in transcriptional control. IRE1 does so through splicing of Xbp1 mRNA, PERK through eIF2α-dependent translation of the transcription factor ATF4, and ATF6 through S1P/S2P-dependent cleavage, which liberates an active transcription factor (Walter and Ron, 2011). The genes up-regulated by the UPR include most notably the gene encoding BiP (heavy-chain binding protein), which is one of the most abundant ER proteins and plays a central role in ER protein translocation and folding and ER-associated degradation (Gething, 1999; Nishikawa et al., 2005). While in principle each pathway might regulate a distinct set of downstream genes, in reality there is considerable overlap among the targets regulated by each; the PERK pathway, in particular, appears to regulate a broad swath of target genes, including those also regulated by ATF6 and IRE1 (Harding et al., 2003; Teske et al., 2011).
One essential function of the vertebrate UPR is the need to balance the ability of cells to adapt to ER stress with the imperative to commit to apoptosis if the stress is too severe (Tabas and Ron, 2011; Hetz, 2012). Adaptive and apoptotic signaling could in principle be under the control of different pathways. Yet none of the vertebrate UPR pathways is intrinsically apoptotic: each initiates both survival and cell death programs, and selective activation of only a subset of UPR pathways is not strictly required for cells to escape death and adapt to persistent stress (Rutkowski et al., 2006). One example of this paradox is expression of the transcription factor C/EBP homologous protein (CHOP). CHOP is strongly associated with ER stress–induced cell death. Several mechanisms have been proposed to account for CHOP-induced cell death (Marciniak et al., 2004; Puthalakath et al., 2007; Li et al., 2009), and so its exact role in the process is still uncertain. However, CHOP is of clear functional importance in that cells or animals lacking CHOP are protected from a wide variety of genetic, pharmacological, or biological insults that elicit ER stress (Zinszner et al., 1998; Oyadomari et al., 2002; Pennuto et al., 2008; Song et al., 2008; Namba et al., 2009; Thorp et al., 2009; Gao et al., 2011). Yet CHOP expression alone is insufficient to commit cells to death, as even stresses that cells can survive without appreciable cell death elicit transient up-regulation of CHOP (Rutkowski et al., 2006). In fact, one indicator that cells will not survive ER stress is persistent, rather than transient, expression of CHOP (Rutkowski et al., 2006). Thus, a key requirement for understanding how cells live or die during ER stress is to determine how their expression of death-promoting factors such as CHOP is controlled directly by transcriptional regulation, and also indirectly by the expression of proteins such as BiP that alleviate ER stress and deactivate the UPR.
While important in adaptation and apoptosis, respectively, BiP and CHOP are also exemplars of the regulatory complexity of the vertebrate UPR. BiP mRNA expression is directly regulated by ATF6 (Yoshida et al., 2000; Wu et al., 2007; Yamamoto et al., 2007), and yet its induction during stress depends partly on PERK activity as well (Luo et al., 2003; Wu et al., 2007; Teske et al., 2011; Han et al., 2013). Conversely, CHOP transcription is strongly regulated by PERK activation (Harding et al., 2000a, 2003), but ATF6 also directly contributes to its expression (Ma et al., 2002; Wu et al., 2007). The purpose of this overlap is unclear, as are its consequences for cell survival versus cell death. However, this and many other related questions about why the UPR is structured the way it is are challenging to test experimentally.
We reasoned that a computational model that allowed disruptive alterations to be tested in silico could overcome this problem and illuminate the regulatory logic of the vertebrate UPR. The key elements in the UPR survival-versus-death axes appear to strongly depend on timing—it is persistent stress that sustains expression of CHOP and that elicits cell death. For this purpose, then, an ordinary differential equation (ODE) model holds the most promise, as it is appropriate when the components of a pathway are known but the temporal relationships among them must be investigated (Kim et al., 2009). There have been several attempts to build ODE models of the UPR either in part or in full, each with its own strengths and limitations. The first rudimentary attempt modeled production and degradation of BiP and CHOP in order to test whether the discrepant degradation kinetics of these two components was sufficient to account for the phenotype seen in stress-adapted cells, where only stable BiP expression is observed (Rutkowski et al., 2006). This approach left entirely open the question of how the upstream stress-sensing molecules (IRE1, PERK, and ATF6) influence response output. Later, a model examining the interplay between chaperone synthesis and translational attenuation in alleviating stress illustrated how translational attenuation protects better against distinct types of stresses (Trusina et al., 2008; Trusina and Tang, 2010). We then described a more complete ODE model of the UPR, accounting for both its activation and output (Curtu and Diedrichs, 2010). This model provided a framework of the UPR signaling network but was not parameterized. A more recent fully parameterized complete ODE model of the UPR described cell death versus adaptation as an emergent property of the response, but this model was not entrained on experimental data and was sparingly validated (Erguler et al., 2013).
Our ultimate goal is to develop a computational model of the UPR that is biologically trustworthy, predicative, and explanatory. Toward that end, and starting from our existing framework (Curtu and Diedrichs, 2010), we strove to parameterize a UPR model that not only was entrained on experimental data, but also could be validated against genetically modified mouse embryonic fibroblasts (MEFs)—and that could then be used to query the regulatory logic of the response.
RESULTS
Describing the contributions of each UPR pathway to its output
To entrain, parameterize, and refine our initial ODE model of the UPR, we examined the behavior of MEFs treated with the ER calcium-depleting agent thapsigargin (TG). TG was chosen because it is robust, activates all three UPR pathways even at low doses (Rutkowski et al., 2006), and does not depend on protein synthesis to elicit ER stress as does the other oft-used ER stressor tunicamycin. MEFs are a useful model cell type because they can be isolated even from knockouts that lead to prenatal lethality.
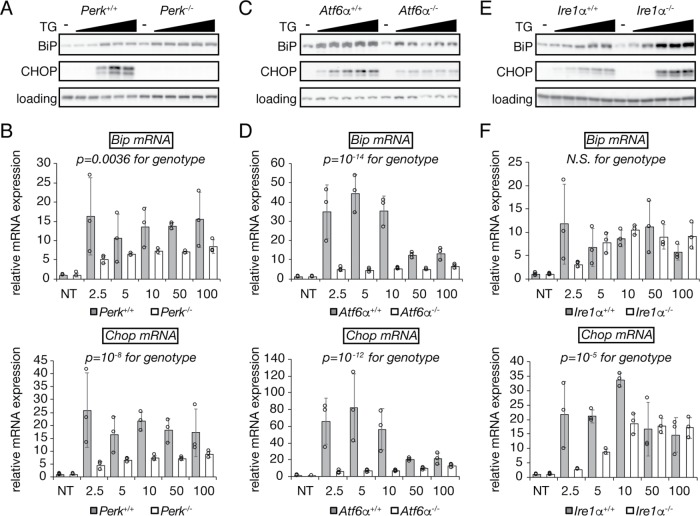
We first examined the response of MEFs lacking each of the three UPR stress sensors—PERK (Harding et al., 2000b), ATF6α (Wu et al., 2007), and IRE1α (Zhang et al., 2011)—to varying doses of TG from 2.5 to 100 nM for 8 h in order to confirm the regulatory interactions among these sensors and the UPR targets BiP and CHOP. In this cell type, 2.5 nM TG is the lowest dose still capable of eliciting ER stress but allowing cells to adapt, 10 nM is the lowest dose that precludes net cell survival, and doses over 10 nM are superphysiological (Rutkowski et al., 2006). As expected, CHOP protein up-regulation was essentially completely lost in Perk–/– MEFs, due to the effects of both ATF4 on Chop transcription and eIF2α phosphorylation on CHOP translation (Palam et al., 2011; Figure 1, A and B). In addition, while there appeared to be little effect of Perk deletion on up-regulation of BiP protein, at least at this time point (Figure 1A), it had a modest but significant effect on up-regulation of Bip mRNA, as shown previously (Wu et al., 2007; Figure 1B). Also consistent with previous findings (Wu et al., 2007; Yamamoto et al., 2007), deletion of Atf6α diminished (but did not eliminate) up-regulation of both BiP and CHOP (Figure 1, C and D). In contrast, the response of cells lacking IRE1α was more complex. BiP up-regulation at the protein level was, if anything, enhanced in Ire1α–/– cells, and Bip mRNA expression was not significantly different (Figure 1, E and F). CHOP up-regulation was compromised at low doses of stress but not at high doses (Figure 1, E and F). These results are consistent with the idea that IRE1 signaling contributes only indirectly to the up-regulation of either of these genes (Lee et al., 2003) and with the absence of XBP1 binding sites (unfolded protein response elements, or UPREs) in both gene promoters.
FIGURE 1:
Contributions of PERK, ATF6α, and IRE1α to UPR output in MEFs. MEFs of the indicated genotype were treated with increasing concentrations of TG ranging from 2.5 to 100 nM, or with vehicle as a control. Cells were harvested for analysis by either immunoblot (A, C, E) or qRT-PCR (B, D, F). Statistical significance was calculated by two-way analysis of variance (ANOVA) for concentration and genotype; the p-value for genotype is shown (ANOVA for concentration was highly significant in all cases). Individual data points (three biological replicates) for qRT-PCR are shown as open circles, along with means ± SDM from those replicates. The loading control for immunoblots was calnexin, the expression of which is not regulated by ER stress in MEFs. Note that the apparent enhanced up-regulation of Bip and Chop mRNA at low TG concentrations in Atf6a+/+ cells is a somewhat atypical result relative to other wild-type MEF lines.
Modification of the UPR wiring diagram
One feature of the experimental system used here that is apparent from these results is that UPR signaling can vary somewhat in magnitude and duration from experiment to experiment, even under carefully standardized conditions. This is apparent even from the data in Figure 1, where different wild-type cells from highly backcrossed (>10 generations) animals—effectively isogenic cell lines—up-regulate Bip and Chop mRNA to different extents. The intensity of the response is subject to a number of influences, including cell passage number, degree of confluence, nutrient level, batch of stressor, cellular epigenetic status, and the individual conditions under which each line was isolated from its corresponding embryo, which are controllable to greater or lesser degrees. Thus, a useful computational model must be entrained on experimental data yet not overfit; rather than recapitulating the precise magnitude of any event, it must capture the trends that are consistent from one experiment to another.
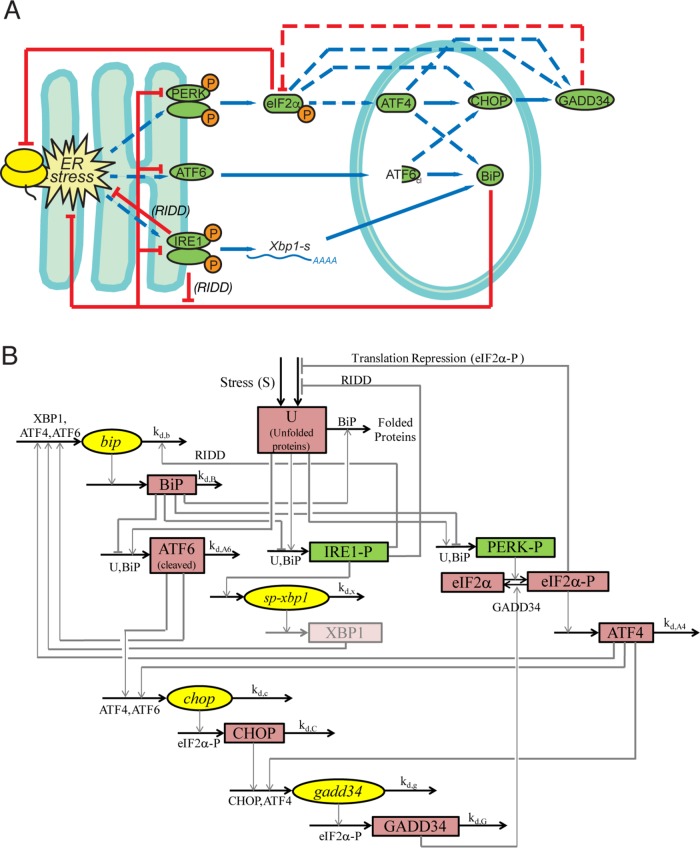
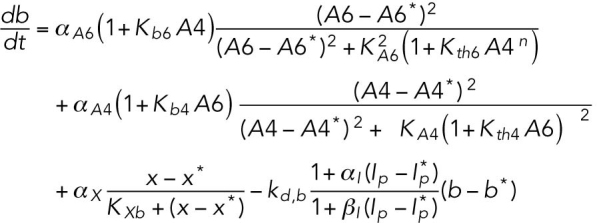
We set about building an ODE model of the UPR based on the framework of our existing base model, which incorporated all three limbs of the UPR (Curtu and Diedrichs, 2010). A schematic diagram showing the components of this model and their interactions with each other is shown in Figure 2A, with the corresponding wiring diagram in Figure 2B. To avoid overspecification, we chose to model only relationships within the core framework of UPR signaling. These are as follows:
Unfolded proteins are generated by an input stress, which causes those proteins to associate with BiP.
Unfolded protein accumulation leads to activation of PERK and IRE1 by phosphorylation and activation of ATF6 by cleavage (Harding et al., 1999; Haze et al., 1999).
Activated IRE1 induces production of XBP1, the product of the spliced form of Xbp1 mRNA (Xbp1s) (Shen et al., 2001; Yoshida et al., 2001; Calfon et al., 2002; Lee et al., 2002). Even though XBP1 does not directly up-regulate Bip mRNA, we modeled that relationship as a proxy for its general effect in improving protein folding through its action on other UPR target genes that are not part of the model. Activated IRE1 also activates a RIDD function (Hollien and Weissman, 2006; Hollien et al., 2009). We modeled this effect as a diminution in the rate constants for unfolded proteins being synthesized and associating with BiP. We also modeled activated IRE1 as contributing to degradation of Bip mRNA via its RIDD function, as has been suggested by us (Gomez and Rutkowski, 2016) and others (Han et al., 2009). Notably, because IRE1 has only modest effects in this system (Figure 1), the contribution of each of these pathways to overall model output is small.
Activated PERK phosphorylates eIF2α (Harding et al., 1999), which inhibits global protein synthesis (Wong et al., 1993) to alleviate ER stress (Harding et al., 2000b) and stimulates translation of Atf4 mRNA (Harding et al., 2000a).
ATF4 transcriptionally regulates CHOP (Harding et al., 2000a), which, along with ATF4, transcriptionally regulates GADD34 (Novoa et al., 2001; Ma and Hendershot, 2003).
Phosphorylated eIF2α also translationally regulates both CHOP and GADD34 (Lee et al., 2009; Palam et al., 2011).
Cleaved ATF6 transcriptionally regulates both Bip and Chop (Haze et al., 1999; Ma et al., 2002).
ATF4 transcriptionally regulates BiP (Luo et al., 2003; Han et al., 2013).
BiP alleviates ER stress (by improving protein folding; Kassenbrock et al., 1988; Morris et al., 1997) and also directly suppresses activation of PERK and ATF6 (Bertolotti et al., 2000; Shen et al., 2002).
FIGURE 2:
Modeled relationships among UPR components. (A) Schematic showing the relationships among UPR components accounted for by the model, with blue lines indicating stimulatory interactions and red lines inhibitory ones. Dashed lines denote relationships examined by in silico manipulation. (B) Wiring diagram depicting the same relationships shown in A, along with the relevant rate constants. The model simulates the concentration level for four specific mRNA (ellipse; yellow) and seven specific protein (rectangle; red) species (see Table 1, Eqs. 4–14). It also shows unfolded proteins. It defines PERK and IRE1 phosphorylation (rectangle; green) and free BiP (not shown in the wiring diagram) as functions of the unfolded proteins and total BiP (Table 1, Eqs. 1–3). For simplification purposes, Bip mRNA is here responsive to Xbp1 mRNA, used as a proxy for XBP1 protein, which is not explicitly modeled.
The list of equations is given in Table 1, and the definitions of each component and interaction are in Table 2. The model as constructed rests on the following simplifying assumptions:
Separate differential equations are provided for both mRNA and protein species of BiP, CHOP, and GADD34. As the regulation of ATF4 is predominantly (though not exclusively) translational (Scheuner et al., 2001; Lu et al., 2004; Dey et al., 2010), its transcription is not considered. UPR activation alters mRNA expression of several species in this model (Atf4, Atf6, and Perk) on the order of twofold (unpublished data), and these effects were not considered here because of their relatively small magnitude, although further model refinement should include them.
The total amounts of PERK (phosphorylated and unphosphorylated), IRE1 (phosphorylated and unphosphorylated), eIF2α (phosphorylated and unphosphorylated), and ATF6 (cleaved and uncleaved) are held constant.
XBP1 protein is presumed to be directly proportional to its spliced mRNA (Xbp1s), and thus the protein is not explicitly modeled. There is evidence that XBP1 protein produced from unspliced Xbp1 mRNA can interfere with XBP1 protein produced from spliced Xbp1 mRNA (Yoshida et al., 2006), but given the relatively minor contribution of the entire IRE1/XBP1 pathway to this particular system, this species is not included.
BiP is known to bind to PERK, IRE1, and ATF6, but BiP is much more abundant than these sensors (Ron and Walter, 2007); thus the total BiP concentration is approximated as the sum of free BiP and BiP in complex with unfolded proteins ([BiPtot] ≅ [BiP] + [BU]).
BiP is taken as a proxy for transcriptionally up-regulated proteins that augment the ER protein folding capacity. In reality, there are dozens of such proteins, many of which, like BiP, are transcriptionally regulated by both the ATF6 and PERK axes (Wu et al., 2007; Teske et al., 2011), but there is little doubt that, as the most abundant chaperone in the ER lumen and the one with the widest substrate binding specificity, up-regulation of BiP is central to adaptation to stress.
-
The folding process can be modeled by the following reactions: BiP + U → BU → BiP + F.
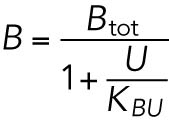
A free chaperone BiP associates with an unfolded protein U, converting it to a folded protein F, which releases the chaperone. Because these two reactions happen fast (within a few minutes) compared with the time scale of the other reactions of interest in the UPR (several hours), we made a quasi-steady-state assumption for BU. Using a mass-action law to model the kinetics of these reactions and setting
we determined that
where KBU is a positive constant. Equation 1 of the model (Table 1) is then obtained by incorporating this result into the equation for total BiP (see above).
- Under unstressed conditions, PERK exists in a complex with BiP (here called “BP”). An increase in unfolded proteins (induced by stress) causes the BiP–PERK complexes to dissociate. PERK is then free to come into contact with the unfolded proteins and multimerize (Gardner et al., 2013), promoting its autophosphorylation and activating its downstream signaling function. Therefore, we assume that PERK is phosphorylated when it is associated with lumenal unfolded proteins ([PERK–P] ≅ [UP], where “UP” represents these PERK-unfolded protein complexes). The dissociation of PERK from BiP and its subsequent association with unfolded proteins are fast reactions (a few minutes) compared with the time scales of interest in the UPR (several hours). Therefore, we made a quasi-steady-state assumption for the following reactions:

TABLE 1:
Model equations.
 (1) (1) |
 (2) (2) |
 (3) (3) |
 (4) (4) |
 (5) (5) |
 (6) (6) |
 (7) (7) |
 (8) (8) |
 (9) (9) |
 (10) (10) |
 (11) (11) |
 (12) (12) |
 (13) (13) |
 (14) (14) |
TABLE 2:
Definitions of variables and parameter values.
| Appears in equation for variable | Parameter | Value | Units |
|---|---|---|---|
| B, free BiP protein | KBU | 0.8 | — |
| Pp, Phosphorylated PERK | 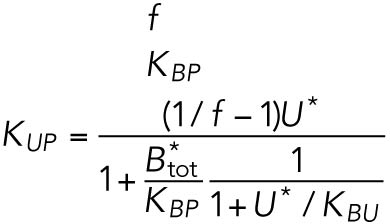 |
|
— |
| Ip, Phosphorylated IRE1α | 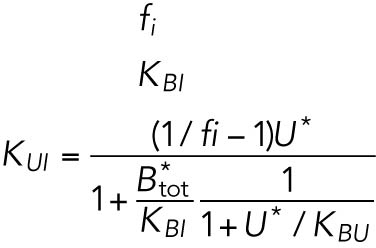 |
|
— |
| U, Unfolded proteins |  |
|
|
| Ep, Phosphorylated eIF2α |  |
|
|
| x, Spliced Xbp1 mRNA |  |
|
|
| A6, Cleaved ATF6α |  |
|
|
| A4, ATF4 protein |  |
|
|
| b, Bip mRNA |  |
|
|
| Btot, total BiP protein | 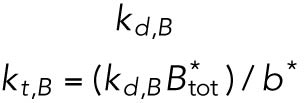 |
|
|
| c, Chop mRNA |  |
|
|
| C, CHOP protein | 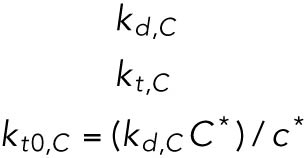 |
|
|
| g, Gadd34 mRNA |  |
|
|
| G, GADD34 protein | 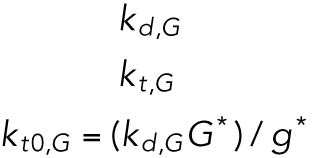 |
|
|
All steady state values are normalized under unstressed conditions:  .
.
We modeled these reactions using a mass-action law in their steady state, setting the reaction speed in their differential equations to zero
 and solving the equations for [BP] and [UP], respectively, effectively converting these variables to dependent variables:
 |
where KBP and KUP are positive constants.
Because the total quantity of PERK is constant, we then obtained the amount of phosphorylated PERK from
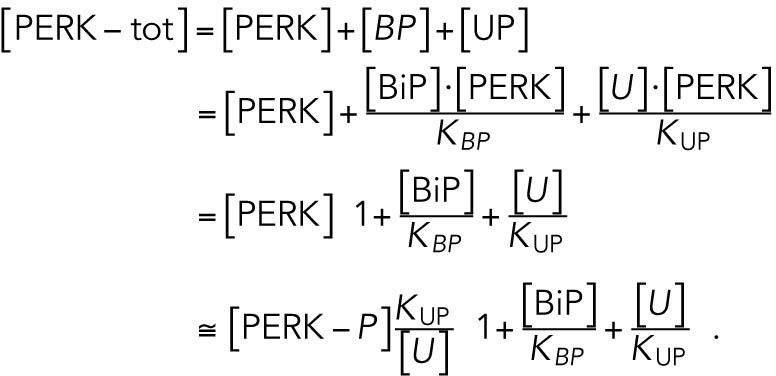 |
With a notation for the percentage of total PERK that is phosphorylated under unstressed conditions
 , this becomes
 |
which gives rise to Eq. 2 in the model. The same assumptions were made in modeling IRE1 (Eq. 3).
Model specification and fit
The model was entrained upon a representative data set quantifying mRNA expression of Bip, Chop, and Gadd34 taken from wild-type MEFs. We chose RNA concentrations as the basis for entrainment because RNA species can be more easily and precisely quantified than can protein species by virtue of quantitative reverse transcription PCR (qRT-PCR). In addition, the use of only these three measures should in principle guide the model toward biological relevance without unnecessarily constraining it. A sense of the intrinsic biological variability of the response can be gained from Supplemental Figure S1, which compares the entrainment data set with an independent data set collected from a separate line of wild-type cells.
Of the 61 parameters (Table 2), nine degradation rates were previously experimentally determined: those of BiP mRNA and protein, CHOP mRNA and protein, GADD34 mRNA and protein, Xbp1 mRNA, ATF4 protein, and cleaved ATF6 protein (Rutkowski et al., 2006). In addition, we set kt,B = kdB, kt0,C = kd,C, and kt0,G= kd,G to ensure that the variables Btot, C, and G (quantities of BiP, CHOP, and GADD34 proteins) remain at steady state levels under unstressed conditions. We also constrained the parameters KUP and KUI to ensure that Pp and Ip (phosphorylated PERK and IRE1, respectively) have their steady states normalized to 1. The remaining 47 parameters were unknown and had to be determined by fitting the solutions of the model to the experimental data using COPASI software.
There are, in principle, an infinite number of possible wiring diagrams and structures that could have been used to specify the model. Therefore, qualitative judgments about the likely relationships among components and how best to represent them mathematically drove the model creation. Furthermore, determining the numerical value of the parameters was an underdetermined problem, as the model had a large number of degrees of freedom, given by the number of unknown parameters, and a relatively sparse data set to constrain its solution.
The system was solved hundreds of times, each with a different set of parameters θ, and COPASI’s numerical optimization algorithms guided the parameter search toward a set that best replicated the experimental data by finding a local minimum for the weighted residual sum of squares (RSS(θ)) between experimental data and simulation for all variables at all time points:
 |
where xij is the experimental measurement of variable j at time step i and yij (θ) is the corresponding value given by the model using parameter set θ. COPASI’s default method multiplies each squared residual by a weight factor  , where
  is the mean value of the points
  in the trajectory for variable j. The purpose of this weight factor is to give the trajectories of each variable similar importance in the fit, regardless of their magnitude in relation to the other variables. The weight factors were scaled so that the maximal occurring weight for each stress level was 1, and all other weights scaled accordingly. Thus, the RSS tests the goodness of fit of a parameter set against all other parameter sets, given the input equations. To further constrain the parameter search, we constrained each parameter to vary by a mean of no more than two orders of magnitude.
Our parameter search methodology combined this quantitative approach to the fit of the model to the variables for which we had experimental data with qualitative judgements as to reasonable simulation results in the other variables, in order to define an optimum parameter set θ* with a low RSS and qualitatively correct solutions for all variables. Thus, although the optimal parameter set is not the one with the absolute lowest local minimum RSS determined by the search algorithm, it is not far from it. A random sampling of 200 parameter sets in our parameter space generated RSS values ranging from 43 to 4996. Only 3% of these parameter sets give RSS values below the RSS for our optimum parameter set (224). Supplemental Figure S2 shows a bee-swarm representation of the distribution of RSS values obtained from this simulation, which was repeated multiple times with similar results. This figure also shows an example of unsatisfactory model output arising from a lower-RSS parameter set, illustrating that the optimum model is one that combines a low RSS value with qualitatively faithful outputs.
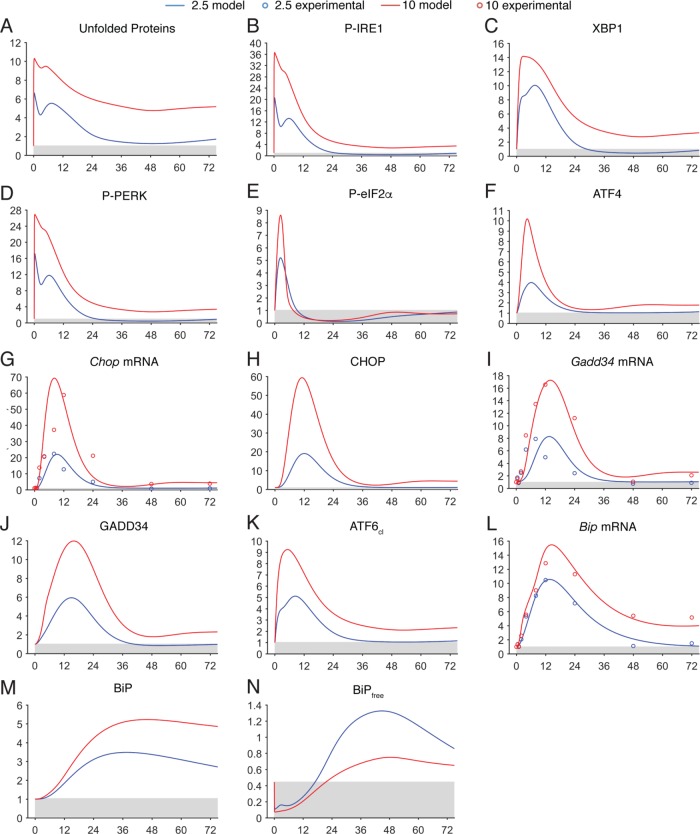
The solutions to the ODE system with these parameters, modeled at stress levels of 2.5 or 10 nM TG based solely on varying the stress input function S(t), are shown in Figure 3, compared with the entrainment data set for the mRNA expression of Bip, Chop, and Gadd34 (also Supplemental Figure S1). The simulation shows both activation and deactivation/recovery phases of the UPR. The most important feature that we strove to recapitulate in parameter selection was the relative kinetics of both phases of the response. As is evident in Supplemental Figure S1, the model solution was faithful to real UPR kinetics within the context of inter- and intraexperiment variability. It is important to note that model fitting inevitably entails compromises; for example, attempts to make the resolution of Gadd34 expression under the 2.5 nM condition more closely match the experimental data (by, for instance, peaking at 8 h rather than 12 h; Supplemental Figure S1C) resulted in a poorer fit under the 10 nM condition. The model represented the best-fit solution given these constraints.
FIGURE 3:
Comparison of model prediction against experimental data. The various outputs of the model under simulations of 2.5- or 10-nM TG treatment are shown (solid lines), with fold induction as the y-axis value. Superimposed (open circles) are experimental data for the same conditions, with only mean values shown for simplicity; means were collected from experiments conducted in biological triplicate. In this and subsequent figures, the gray shaded areas define the basal value for each component, and the x-axis denotes time in hours. See also Supplemental Figure S1.
The other qualitative feature that we wished the model to reproduce was the complete loss of CHOP and GADD34 up-regulation under conditions where cells can survive (i.e., 2.5 nM TG) but their persistence under conditions where cells cannot survive (i.e., 10 nM; Rutkowski et al., 2006). The presented solution was able to successfully recreate this response (Figure 3, H and J), and was accompanied by a nearly complete resolution of unfolded proteins—i.e., a return to basal levels—under the 2.5 nM condition but not the 10 nM condition (Figure 3A). Finally, up-regulation of BiP protein had to persist long past the resolution phase of the response under both conditions (Rutkowski et al., 2006); this behavior is seen in Figure 3M.
Validation of the model against knockouts
To test the biological trustworthiness of the model, we next tested the effects of in silico deletion of integral UPR components against the phenotypes of cells lacking those same components, both as reported in the literature and in our own experimental testing. The first of these deletions was PERK (Supplemental Figure S3); the most salient features that we expected the model to reproduce were nearly complete dependence of the downstream proteins ATF4, CHOP and GADD34 on PERK, and also a partial dependence of BiP up-regulation (Harding et al., 2000a). Indeed, we observed these relationships (Supplemental Figure S3, F, H, J, and M), which followed naturally from ablation of eIF2α phosphorylation (Supplemental Figure S3E). The attenuation of Bip up-regulation was seen despite elevated ATF6 cleavage (Supplemental Figure S3K), which followed presumably from an increased burden of unfolded proteins (Supplemental Figure S3A). We also modeled in silico deletion of IRE1; these results are shown in Supplemental Figure S4. As described above, the parameter set was chosen so that the contribution of the IRE1/XBP1 pathway would be modest, although its inclusion in the model means that its contribution can be more heavily weighted when other systems are being considered.
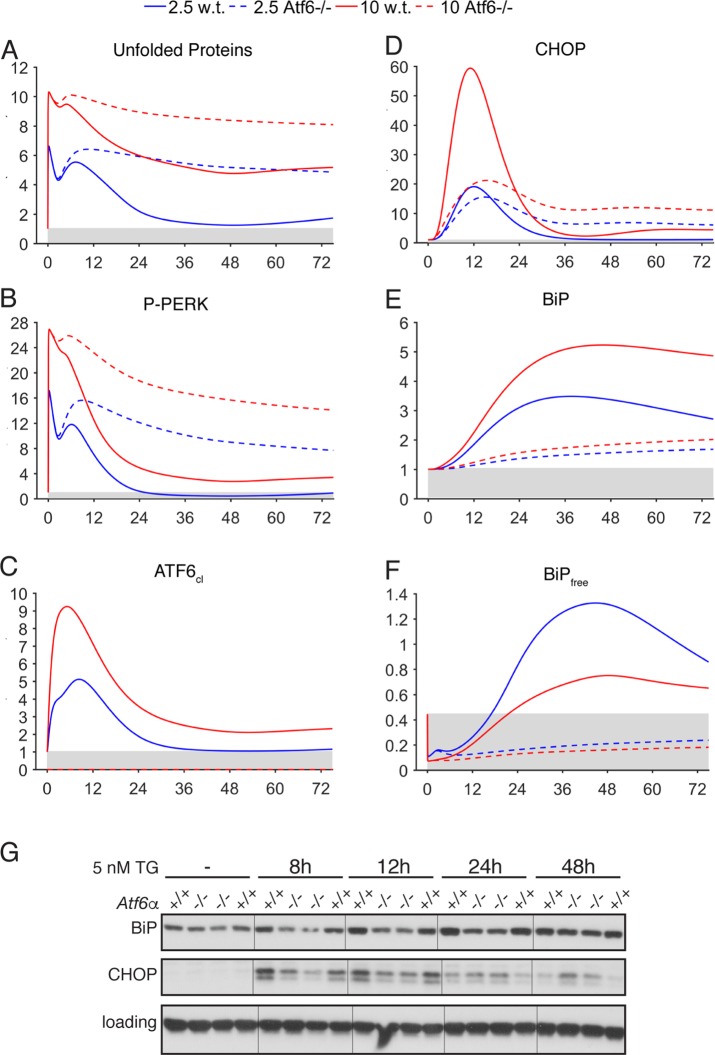
More stringent tests of the model would include ablation of components whose contribution to downstream targets was partial rather than complete, as these are likely to affect UPR output in more complex ways. Thus, we compared the result of in silico ATF6 deletion against cells lacking ATF6 (Figure 4; Supplemental Figure S5), since ATF6 contributes to but is not absolutely essential for the regulation of both BiP and CHOP (Wu et al., 2007). Under both 2.5- and 10-nM stress conditions, in silico loss of ATF6 perpetuated ER stress (Figure 4A) and consequently, PERK activation (Figure 4B). Up-regulation of CHOP was blunted in the early phase of the response, but persisted long after being resolved or attenuated in the wild-type simulations (Figure 4D). BiP up-regulation was also compromised throughout the time course of the simulation (Figure 4E). The likely consequence of this attenuated BiP up-regulation was failure to restore levels of free (i.e., not bound by unfolded proteins) BiP (Figure 4F). While the true concentrations of unfolded proteins or free BiP are not readily measurable and are thus inferred, the expression of BiP and CHOP in cells was similar to the model’s predictions. In response to 5 nM TG (i.e., between 2.5 and 10 nM), CHOP up-regulation was reduced at early times but augmented at later times in Atf6α–/– cells, as predicted by the model (Supplemental Figure S5O), while BiP up-regulation lagged throughout (Figure 4G).
FIGURE 4:
Comparison of model and experimental outputs for deletion of ATF6α. (A–F) Selected model outputs are shown after ATF6α was deleted in silico (dashed lines), compared against outputs in wild-type simulations (solid lines). (G) Wild-type or Atf6–/– MEFs (two independent lines of each; genotype indicated above each panel) were treated with 5 nM TG for the indicated times, and expression of BiP and CHOP was assessed by immunoblot. See also Supplemental Figure S5. Loading control was a-actin. Hairlines are for visual clarity only.
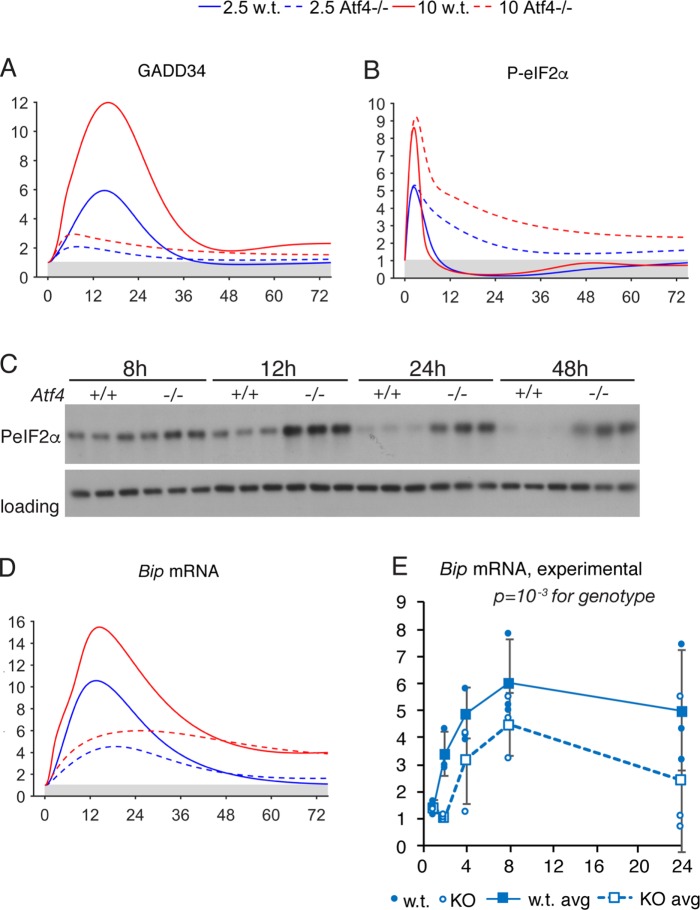
We next conducted similar experiments comparing in silico deletion of ATF4 to Atf4–/– cells (Figure 5; Supplemental Figure S6). Beyond dramatically compromising up-regulation of CHOP, as expected (Supplemental Figure S6, G and H), the model also predicted persistent phosphorylation of eIF2α, likely due to failure to up-regulate the eIF2α phosphatase GADD34 (Figure 5A). In fact, eIF2α phosphorylation asymptotically approached an elevated steady-state level (Figure 5B) that persisted even when the simulation was continued for 250 h (unpublished data). Mirroring this prediction, eIF2α phosphorylation diminished markedly from its initial 8-h peak in wild-type cells but not in Atf4–/– cells (Figure 5C). ATF4 also directly binds to the Bip promoter (Luo et al., 2003; Han et al., 2013), and so the model predicted suppressed Bip up-regulation in the early phase of the response (Figure 5D). A suppression of Bip mRNA in Atf4–/– MEFs was also seen experimentally (Figure 5E).
FIGURE 5:
Comparison of model and experimental outputs for deletion of ATF4. (A, B, D) Selected model outputs are shown after ATF4 was deleted in silico (dashed lines), compared against outputs in wild-type simulations (solid lines). (C) Immunoblot showing the phosphorylated form of eIF2α upon treatment of wild-type or Atf4–/– MEFs with 2.5 nM TG for the indicated times. Loading control was calnexin. (E) qRT-PCR quantifying Bip mRNA expression in wild-type or Atf4–/– MEFs upon treatment with 2.5 nM TG for the indicated times. Data were normalized against expression in cells of the same genotype treated with vehicle. Significance was calculated by two-way ANOVA for time and genotype.
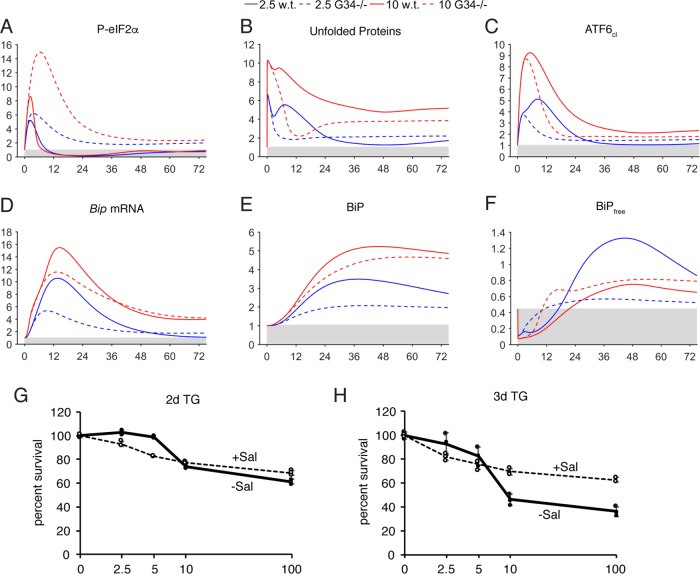
Our final validation test of the model was to delete GADD34 (Figure 6; Supplemental Figure S7), which modulates the regulatory step of eIF2α dephosphorylation rather than an initiating step as with PERK, IRE1, ATF6, and ATF4. One of the most surprising previously unaccounted-for features of Gadd34 deletion reported in cells is the failure of those cells to fully transcriptionally up-regulate BiP (Novoa et al., 2003). When we deleted GADD34 in silico, we found a dramatic diminution of unfolded proteins at intermediate times (4–24 h), consistent with the idea that GADD34 exacerbates ER stress by promoting ongoing protein synthesis in the stressed ER (Figure 6B; Marciniak et al., 2004). This diminished unfolded protein accumulation was also presumably responsible for blunted activation of ATF6 (Figure 6C), which in turn compromised up-regulation of Bip mRNA (Figure 6D) and protein (Figure 6E). Thus, our model to some extent mirrors and accounts for the phenotype of Gadd34–/– cells.
FIGURE 6:
Model-predicted output for deletion of GADD34. (A–F) GADD34 was deleted in silico and various model outputs are shown. (G, H) Wild-type MEFs were treated for 2 or 3 d with the indicated concentration of TG in the presence or absence of 50 μM salubrinal (Sal). An MTT assay was used to assess cell number relative to cells without TG. Error bars represent means ± SDM. Individual data points from three samples of each condition are shown as open (+Sal) or filled (-Sal) circles.
Our model also makes a surprising prediction about the phenotype of Gadd34–/– cells: at long time points under the 2.5-nM condition, Gadd34–/– cells should have a greater unfolded protein burden (Figure 6B) than wild-type cells, while, paradoxically, the situation is reversed under the 10-nM condition. In other words, loss of GADD34 should sensitize cells to low concentrations of TG, but should protect cells from higher concentrations. Based on the model, the highest sensitivity to stress should be seen in wild-type cells treated with 10 nM TG, followed by Gadd34–/– cells treated with 10 nM TG, then Gadd34–/– cells treated with 2.5 nM TG, and last wild-type cells treated with 2.5 nM TG as the most resistant (from Figure 6B). To test this prediction, we treated cells with the GADD34 inhibitor salubrinal (Boyce et al., 2005) and found that, indeed, inhibition of GADD34 activity paradoxically sensitizes cells to 2.5 nM TG but protects them from 10 nM (and 100 nM) TG (Figure 6, G and H).
Like any drug, salubrinal is an imperfect vehicle for probing GADD34 ablation; the more recently discovered GADD34 inhibitor Sephin1 was, in our hands, extremely toxic to MEFs on its own (unpublished data). In addition, here we are taking viability as an indicator of sensitivity to stress. The true unfolded protein burden is difficult to quantify, and linking the unfolded protein burden to viability rests on the assumption that cell death follows from the ER stress level. Despite these caveats, the computational and experimental data are consistent at least to the extent that GADD34 has opposing effects on the cellular response to 2.5 versus 10 nM TG. These data also suggest that GADD34 seems not so much to accelerate cell dysfunction and death as to potentiate a steep threshold between adaptation and death.
Using the model to explore the regulatory logic of the UPR
Taken together, the above data show that the model makes predictions about UPR output that can be successfully tested experimentally. The validation experiments above lend confidence to the idea that the model captures the important temporal trends of the response and the relationships among its constituents. We thus used the model as a tool to explore the functional consequences of the regulatory pathways embedded within the UPR in in silico experiments that would be cumbersome to carry out in living cells. While many different questions might be asked with this model, we were particularly interested in examining how the output of a UPR stripped of its various feedbacks, feedforwards, and overlaps would differ from its actual output, and what implications these differences might have for UPR responsiveness and cell fate. We chose two such manipulations for these purposes.
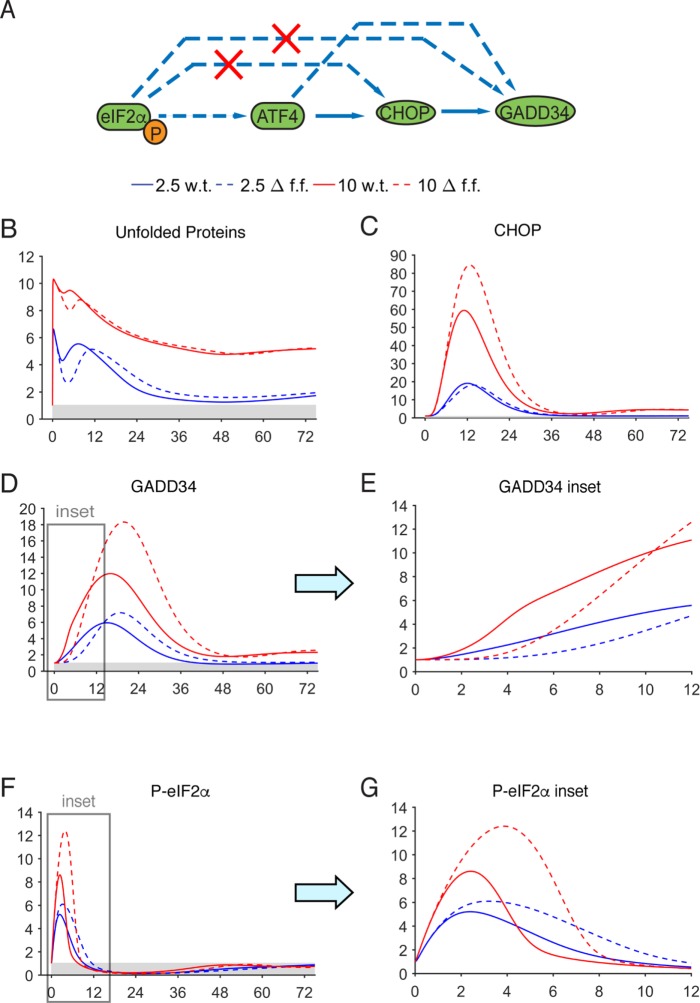
We first tested the significance of translational stimulation of CHOP and GADD34 by eIF2α phosphorylation (Figure 7; Supplemental Figure S8; Lee et al., 2009; Palam et al., 2011), which is consistent with the presence of short open reading frames in the 5′ untranslated region of each mRNA akin to those found in Atf4 mRNA. A priori, one might assume that the role of such a feedforward circuit would be to enhance the expression of both components. However, we found that this was not the case; instead, ablation of the contribution of eIF2α to CHOP and GADD34 enhanced maximal up-regulation of both proteins (Figure 7, C and D). Rather, we observed that deletion of this feedforward loop changed the temporal sensitivity of the response: in wild-type cells, GADD34 was significantly up-regulated at earlier times than in feedforward-ablated cells and was likewise down-regulated more rapidly in the recovery phase (Figure 7, D and E; note that the dashed lines designating Gadd34–/– cells begin their ascent later than the solid lines denoting wild-type cells). Thus, despite ultimately yielding a greater peak of GADD34 expression, feedforward-ablated cells showed elevated and more persistent phosphorylation of eIF2α (Figure 7, F and G).
FIGURE 7:
In silico deletion of feedforward control of CHOP and GADD34. (A) Schematic showing the steps targeted by in silico deletion (red “X”). (B–G) Model simulations were run after translational control of CHOP and GADD34 was removed by eIF2α (Δf.f.; dashed lines), compared against wild-type output (solid lines). Panels E and G are insets representing times 0–12 h for GADD34 and P-eIF2α, respectively.
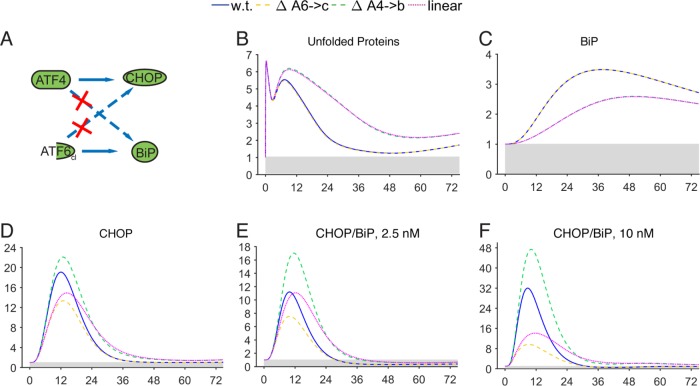
Next, we used the model to explore the regulatory logic underlying crosstalk between the PERK and ATF6 pathways. Namely, why does ATF6 contribute to CHOP expression when ATF6 largely regulates ER chaperones and other adaptive factors (Wu et al., 2007; Adachi et al., 2008)? Likewise, why does the PERK pathway (presumably through ATF4) regulate BiP expression when activation of the ATF6 pathway would seem adequate for that purpose? Thus, we either deleted the contribution of ATF6 to Chop, the contribution of ATF4 to Bip, or both (termed “linear,” since the crosstalk between pathways is removed; Figure 8; Supplemental Figures S9 and S10). As expected, deleting the ATF4 contribution to Bip caused unfolded proteins to persist (Figure 8B), presumably due to attenuated BiP up-regulation (Figure 8C). In contrast, deleting the ATF6 contribution to Chop had no effect on unfolded proteins; even though this deletion had a small effect on GADD34 production, this effect was not sufficient to alter eIF2α dephosphorylation (Supplemental Figures S9 and S10). However, both deletions affected CHOP expression, but in distinct ways (Figure 8D). Deletion of the ATF6 contribution to CHOP caused CHOP expression to reach a lower peak, but to return to basal levels in the same time as in the wild type. Deletion of the ATF4 contribution to BiP caused CHOP to reach a greater peak. Its clearance occurred with similar kinetics as in the wild type, but because of its greater maximum, its expression persisted longer. The linear simulation (i.e., the combination of both deletions) combined the features of both single deletions, so that CHOP expression was blunted, yet slower to resolve. This result was evident for both the 2.5- and 10-nM conditions (Supplemental Figures S9 and S10).
FIGURE 8:
In silico removal of direct crosstalk between ATF6 and PERK pathways. (A) Schematic showing the steps targeted by in silico deletion (red “X”). (B–F) Model simulations were run after removal of the contribution of ATF6 to transcription of Chop (ΔA6→c; yellow dashed line), the contribution of ATF4 to Bip transcription (ΔA4→b; green dashed line), or both (linear; magenta dotted line). Selected model outputs for the 2.5-nM condition are shown (B–D). Panels E and F graph the ratio of CHOP to BiP during the simulation for 2.5- and 10-nM conditions, respectively.
We reasoned that the tendency of BiP and CHOP to act at cross purposes in promoting adaptation or death, respectively, might make comparing the relative amounts of these two proteins an enlightening metric. From this ratio, it can be seen that crosstalk between the two pathways creates a condition under which the anti-adaptive pathway is relatively favored at earlier time points (notably, those that occur prior to the commitment to cell death, which occurs in the range of 12–16 h; Harding et al., 2003), but then is rapidly disfavored at later time points (Figure 8, E and F). Absent the contribution of ATF4 to BiP, CHOP was both more favored and more persistent, while absent the contribution of ATF6 to CHOP, initial CHOP induction was blunted.
DISCUSSION
This paper establishes the first mathematical model for the dynamics of vertebrate UPR signaling entrained on experimental data. We constructed a wiring diagram based on qualitative knowledge about previously studied core UPR components and their hypothetical interactions, including the ATF6 and PERK signaling pathways and crosstalk leading to the expression of BiP, CHOP, and GADD34. Then we devised a framework to approach the construction of the ODEs associated with this wiring diagram, based on assumed biochemical reactions involving each node in the UPR’s network. Unknown kinetic parameters were determined by fitting the model’s solutions to experimental time-course data for relative increases of Bip, Chop, and Gadd34 mRNA collected from wild-type MEFs under stress induced by thapsigargin in two different doses: low (2.5 nM TG) and high (10 nM TG). The model was validated by both its fit to experimental data in wild-type cells and its ability to successfully predict the phenotypes of genetically or pharmacologically manipulated cells.
While the bulk of this manuscript is devoted to the building and validation of our model, the model’s ultimate intent was to understand why the UPR is structured the way it is. Toward that end, we conducted two in silico experiments testing manipulations that were not easily tested experimentally: eliminating eIF2α-mediated translational stimulation of CHOP and GADD34 and ablating direct crosstalk between the PERK and ATF6 pathways. Both manipulations provided insight into the ways in which the structure of the UPR governs its responsiveness. The first suggested that the effect of feedforward translational stimulation of CHOP and GADD34 is not to augment their up-regulation, but rather to ultimately potentiate more rapid eIF2α dephosphorylation—i.e., that eIF2α initiates an autoregulatory negative feedback loop. The second manipulation suggested that a functional consequence of pathway crosstalk might be to make the CHOP-dependent apoptotic limb of the UPR maximally responsive to stress—allowing robust induction of CHOP while simultaneously permitting rapid CHOP loss when stress is alleviated. Experimentally testing these sorts of model predictions would require homologous-directed genome editing to make precise changes in the Bip or Chop promoters, or the Chop and Gadd34 5′ untranslated regions, plus identifying, selecting, and propagating targeted clones (or generating mutations in stem cells and then differentiating them into fibroblasts). Thus, experimental validation would be laborious, which highlights one of the major utilities of a computational model: by providing testable predictions, it can help identify experiments that are likely to be worth their time, effort, and cost.
How trustworthy are the predictions made by our model? The fact that the model recapitulates essential features of the response—and, more importantly, captures at least in general terms the behavior of the response when individual components are ablated—suggests that its predictions are likely to be relevant. Of course, there are ways in which the model as currently configured can be refined. One of these is expansion of IRE1/XBP1 signaling. There is little doubt that IRE1 mediates essential UPR responses, particularly in professional secretory cells such as plasma lymphocytes, hepatocytes, and pancreatic acinar cells (van Anken and Braakman, 2005). The apparent lack of a direct contribution of IRE1 signaling to BiP and CHOP expression in MEFs (Figure 1, E and F) led us to minimize its contribution here, but its contribution to response output can be differently weighted when the model is applied to other systems. A more complete IRE1/XBP1 module would explicitly include synthesis of active XBP1 protein from Xbp1s mRNA, as well as inhibition of that protein by XBP1 translated from unspliced Xbp1 mRNA (Yoshida et al., 2006).
The model’s consideration of unfolded proteins will also ultimately need to account for different types of stimuli. The model is currently entrained upon only TG stress and could thus be expected to model other stresses that activate all three limbs of the UPR and that do not require protein synthesis to exert their effects, simply by changing the strength and dynamics of the input stress S(t). Different stressors, such as inhibition of N-linked glycosylation, ER protein overload, or loading with saturated fatty acids, are likely to result in distinctly different activation profiles of the UPR. In fact, there is increasing evidence that the cell senses pharmacological ER stress differently from overexpression of a misfolded protein (Bakunts et al., 2017; Bergmann et al., 2018). Protein synthesis is not explicitly modeled in our system; including it would allow greater flexibility in modeling different stresses. Related to this point, the activity of the RIDD pathway in degrading ER-associated RNAs (and thereby reducing ER protein import) could then be modeled directly, rather than indirectly, as in our system.
Finally, there are many modulatory components that act upon UPR signaling pathways and that are themselves targets of UPR activation; certainly the response biologically cannot be distilled to just BiP, CHOP, and GADD34. Some of them, such as the putative negative regulator of ATF6 signaling WFS1 (Fonseca et al., 2010), have already been included in attempts to model the UPR (Erguler et al., 2013). While we have excluded such components in the interest of avoiding overspecification, a complete model must ultimately include them. It will be interesting to see where the predictions made by our model, as it is expanded by us or others, agree or diverge with those of Erguler et al. (2013). Although the inclusion of new components would necessitate reparameterization, our existing model provides a jumping-off point for such attempts.
This model opens many directions of future investigation for the vertebrate UPR research community. The model can be used to run a large variety of simulations to study the UPR under various types of external and internal conditions. The stress function S(t) can be customized to model a variety of different external stress stimuli, including stresses that gradually build in intensity, periodic stress corresponding to repeated drug treatments, cyclical stress of varying intensity following the cell’s reproductive cycle or the circadian rhythm, a short spike of ER stress lasting a few minutes to model a sudden insult, or a low-intensity stress of long duration to model a chronic disease. The stress function may also include more complex forms of stress that would be challenging to replicate in vitro.
In addition, the model can be used to predict how different cell types, which differ in their basal expression of UPR components, might respond to a given type of stress. For example, while the expression of the ER-resident stress sensors IRE1, PERK, and ATF6 is low in MEFs, these components are abundantly expressed in highly secretory cell types such as pancreas and liver. Does this elevated expression make the system more or less readily activated? And what would be the consequence of having one or two sensors highly expressed but not all three? A related question is which of the parameters modeled here are critical determinants of response output and which are minor modulators—a question that can be addressed by sensitivity analysis, which systematically varies parameters to identify those with the greatest contribution to response output (Turányi, 1990; Helton et al., 2006).
Other areas for exploration can include adding stochasticity, defining parameters to be random variables (i.e., to test which might be subject to biological regulation), and performing a dynamic Monte Carlo simulation. Identifying potential alternative steady states for certain variables through bifurcation analysis is another direction, in particular to test whether UPR signaling migrates toward competing bistable states that reflect adaptive versus apoptotic programs. Our hope is that this model might be used by the field as a starting point for refinement.
MATERIALS AND METHODS
Cell culture experiments
MEFs were harvested, cultured, and treated as described (Wu et al., 2007) from wild-type animals or from Perk–/– (Harding et al., 2000b), Atf6α–/– (Wu et al., 2007), or Atf4–/– (Hettmann et al., 2000) animals or littermate controls. Ire1–/– MEFs were prepared by in vitro deletion of immortalized MEFs isolated from Ire1fl/fl animals (Zhang et al., 2011) and were a gift from R. J. Kaufman (Sanford Burnham Institute). All animals were highly backcrossed (>10 generations) into the C57BL/6J line; thus wild-type MEFs isolated from any of these strains, or from pure C57BL/6J embryos, are considered effectively isogenic, and any differences in response are most likely due to nongenetic variables. Entrainment data displayed in Supplemental Figure S1 were taken from two independent experiments using two separate wild-type lines. Cells were always used prior to passage number five. Twenty-four hours prior to treatment, cells were plated at 2 × 10⁵ cells per well in six-well dishes. TG and salubrinal were purchased from EMD Millipore (Darmstadt, Germany), dissolved in dimethylsulfoxide (DMSO), and aliquoted and stored at –20°C. TG treatments were carried out by preparing 1000× dilutions from stock in DMSO, adding to media in a tube, and then replacing existing media on cells with stressor-containing media. Quantitative RT-PCR and immunoblot experiments were carried out as described (Rutkowski et al., 2006). Statistical analyses were performed as described in the figure legends. Antibodies were from BD (BiP; cat 610978), Santa Cruz (CHOP; sc-793), or Invitrogen (PeIF2α; 44728G). For MTT assays, cells were plated on 96-well dishes using a multichannel pipette. After resting overnight, media were replaced with fresh media containing stressor. After the desired time in culture with media refreshed daily, MTT reduction was measured using the CellTiter 96 Aqueous One kit (Promega) according to the manufacturer’s instructions.
Model construction and validation
Degradation rate constants were taken from Rutkowski et al. (2006), which in turn were generated from experimental measurements (RNA degradation rate constants from experiments in the presence of the transcription inhibitor actinomycin D, and protein degradation rate constants from experiments in the presence of the translation inhibitor cycloheximide). In addition, we set the protein synthesis rate constants at time t = 0 equal to the degradation rate constants for BiP, CHOP, and GADD34 to ensure that the amounts of BiP, CHOP, and GADD34 remained at a steady state value of “1″ under unstressed conditions. We also constrained the value of parameters KUP, KUI in Eqs. 2–3 to ensure that in the absence of stress, phosphorylated PERK and IRE1 were also at steady state “1.” The remaining parameters were derived by fitting the model solutions to experimental data.
All variables in the ODE system (Tables 1 and 2) were unitless and normalized to their steady state values under unstressed conditions. Table 3 shows the definition of each variable as well as baseline values for these quantities under unstressed conditions in terms of actual protein and mRNA quantities. The latter were chosen to capture the appropriate relative proportions of each species (Ron and Walter, 2007).
TABLE 3:
Model variables in terms of actual protein and mRNA steady state quantifications under unstressed conditions.
| Normalized variable | Quantification |
 |
— |
 |
 |
 |
 |
 |
 |
 |
 |
 |
 |
 |
 |
 |
 |
 |
 |
 |
 |
 |
 |
 |
 |
 |
 |
 |
 |
 |
|
 |
|
 |
|
 |
|
 |
We used COPASI (Hoops et al., 2006) to solve the model numerically using its ODE solver LSODAR (Petzold, 1983) and normalized the initial condition of all variables to 1 to reflect in silico the fact that up-regulatory and down-regulatory events are expressed in experimental data as fold changes. The units of the simulated time were minutes. The input stress was described as a rate function S(t) measured in [min-1] and assumed here to be constant, with the difference between the unstressed condition and the 2.5 and 10 nM TG conditions being S(t) = 0,S(t) = 2, and S(t) = 8 [min-1], respectively. We then used S(t) = 4 [min-1] to simulate stress at 5 nM TG (Supplemental Figure S5O).
In silico deletions were created as follows: for PERK deletion, variable Pp was set to Pp = 0; for IRE1 deletion, Ip = Ip* = 0; for ATF6 deletion, A6tot = 0 and A6* = 0; for ATF4 deletion, A4* = 0 and γ = 0. For GADD34 deletion, g* = G* = 0 and dg/dt = 0, dG/dt = 0 in Eqs. 13 and 14; for deletion of the feedforward loop connecting eIF2α phosphorylation to CHOP and GADD34 translation, kt,C and kt,G = 0; for ΔA6→c simulations, Kc4 and Kth4c = 0; for ΔA4→b, αA4, Kth6, and Kb6 = 0. The linear model incorporated both sets of changes. The COPASI file, allowing the model to be run and manipulated by others, is included in the Supplemental Materials and is also deposited in the BioModels Database under model ID# MODEL1803300000 (www.ebi.ac.uk/biomodels/).
Supplementary Material
Acknowledgments
We thank R. J. Kaufman (Sanford Burnham Research Institute) for providing mice from which Atf6–/– and Atf4–/– MEFs were derived and for Ire1–/– and control MEFs. We thank D. Ron (University of Cambridge) for Perk–/– mice. We also thank A. H. Elcock, A. J. Dupuy, W. S. Moye-Rowley, and C. D. Sigmund for stimulating discussions. Funding sources included National Institutes of Health R01 GM115424 (D.T.R.) and T32 GM067795 (J.A.G.) and National Science Foundation 1029082 (R.C.).
Abbreviations used:
- ATF
activating transcription factor
- CHOP
C/EBP homologous protein
- eIF
eukaryotic initiation factor
- ER
endoplasmic reticulum
- GADD
growth arrest and DNA damage inducible
- IRE
inositol-requiring enzyme
- MEF
mouse embryonic fibroblast
- ODE
ordinary differential equation
- qRT-PCR
quantitative reverse transcription PCR
- RIDD
regulated IRE1-dependent decay
- S1/2P
site 1/2 protease
- TG
thapsigargin
- UPR
unfolded protein response
- XBP
X-box binding protein
Footnotes
This article was published online ahead of print in MBoC in Press (http://www.molbiolcell.org/cgi/doi/10.1091/mbc.E17-09-0565) on April 18, 2018.
REFERENCES
- Adachi Y, Yamamoto K, Okada T, Yoshida H, Harada A, Mori K. (2008). ATF6 Is a transcription factor specializing in the regulation of quality control proteins in the endoplasmic reticulum. Cell Struct Funct , 75–89. [DOI] [PubMed] [Google Scholar]
- Bakunts A, Orsi A, Vitale M, Cattaneo A, Lari F, Tade L, Sitia R, Raimondi A, Bachi A, van Anken E. (2017). Ratiometric sensing of BiP-client versus BiP levels by the unfolded protein response determines its signaling amplitude. Elife , e27518. [DOI] [PMC free article] [PubMed] [Google Scholar]
- Bergmann TJ, Fregno I, Fumagalli F, Rinaldi A, Bertoni F, Boersema PJ, Picotti P, Molinari M. (2018). Chemical stresses fail to mimic the unfolded protein response resulting from luminal load with unfolded polypeptides. J Biol Chem, 10.1074/jbc.RA117.001484. [DOI] [PMC free article] [PubMed] [Google Scholar]
- Bertolotti A, Zhang Y, Hendershot LM, Harding HP, Ron D. (2000). Dynamic interaction of BiP and ER stress transducers in the unfolded-protein response. Nat Cell Biol , 326–332. [DOI] [PubMed] [Google Scholar]
- Boyce M, Bryant KF, Jousse C, Long K, Harding HP, Scheuner D, Kaufman RJ, Ma D, Coen DM, Ron D, et al. (2005). A selective inhibitor of eIF2alpha dephosphorylation protects cells from ER stress. Science , 935–939. [DOI] [PubMed] [Google Scholar]
- Calfon M, Zeng H, Urano F, Till JH, Hubbard SR, Harding HP, Clark SG, Ron D. (2002). IRE1 couples endoplasmic reticulum load to secretory capacity by processing the XBP-1 mRNA. Nature , 92–96. [DOI] [PubMed] [Google Scholar]
- Curtu R, Diedrichs D. (2010). Small-scale modeling approach and circuit wiring of the unfolded protein response in mammalian cells. Adv Exp Med Biol , 261–274. [DOI] [PubMed] [Google Scholar]
- Dey S, Baird TD, Zhou D, Palam LR, Spandau DF, Wek RC. (2010). Both transcriptional regulation and translational control of ATF4 are central to the integrated stress response. J Biol Chem , 33165–33174. [DOI] [PMC free article] [PubMed] [Google Scholar]
- Erguler K, Pieri M, Deltas C. (2013). A mathematical model of the unfolded protein stress response reveals the decision mechanism for recovery, adaptation and apoptosis. BMC Syst Biol , 16. [DOI] [PMC free article] [PubMed] [Google Scholar]
- Fonseca SG, Ishigaki S, Oslowski CM, Lu S, Lipson KL, Ghosh R, Hayashi E, Ishihara H, Oka Y, Permutt MA, et al. (2010). Wolfram syndrome 1 gene negatively regulates ER stress signaling in rodent and human cells. J Clin Invest , 744–755. [DOI] [PMC free article] [PubMed] [Google Scholar]
- Gao J, Ishigaki Y, Yamada T, Kondo K, Yamaguchi S, Imai J, Uno K, Hasegawa Y, Sawada S, Ishihara H, et al. (2011). Involvement of endoplasmic stress protein C/EBP homologous protein in arteriosclerosis acceleration with augmented biological stress responses. Circulation , 830–839. [DOI] [PubMed] [Google Scholar]
- Gardner BM, Pincus D, Gotthardt K, Gallagher CM, Walter P. (2013). Endoplasmic reticulum stress sensing in the unfolded protein response. Cold Spring Harb Perspect Biol , a013169. [DOI] [PMC free article] [PubMed] [Google Scholar]
- Gething MJ. (1999). Role and regulation of the ER chaperone BiP. Semin Cell Dev Biol , 465–472. [DOI] [PubMed] [Google Scholar]
- Gomez JA, Rutkowski DT. (2016). Experimental reconstitution of chronic ER stress in the liver reveals feedback suppression of BiP mRNA expression. Elife , e20390. [DOI] [PMC free article] [PubMed] [Google Scholar]
- Han D, Lerner AG, Vande Walle L, Upton JP, Xu W, Hagen A, Backes BJ, Oakes SA, Papa FR. (2009). IRE1alpha kinase activation modes control alternate endoribonuclease outputs to determine divergent cell fates. Cell , 562–575. [DOI] [PMC free article] [PubMed] [Google Scholar]
- Han J, Back SH, Hur J, Lin YH, Gildersleeve R, Shan J, Yuan CL, Krokowski D, Wang S, Hatzoglou M, et al. (2013). ER-stress-induced transcriptional regulation increases protein synthesis leading to cell death. Nat Cell Biol , 481–490. [DOI] [PMC free article] [PubMed] [Google Scholar]
- Harding HP, Novoa I, Zhang Y, Zeng H, Wek R, Schapira M, Ron D. (2000a). Regulated translation initiation controls stress-induced gene expression in mammalian cells. Mol Cell , 1099–1108. [DOI] [PubMed] [Google Scholar]
- Harding HP, Zhang Y, Bertolotti A, Zeng H, Ron D. (2000b). Perk is essential for translational regulation and cell survival during the unfolded protein response. Mol Cell , 897–904. [DOI] [PubMed] [Google Scholar]
- Harding HP, Zhang Y, Ron D. (1999). Protein translation and folding are coupled by an endoplasmic-reticulum-resident kinase. Nature , 271–274. [DOI] [PubMed] [Google Scholar]
- Harding HP, Zhang Y, Zeng H, Novoa I, Lu PD, Calfon M, Sadri N, Yun C, Popko B, Paules R, et al. (2003). An integrated stress response regulates amino acid metabolism and resistance to oxidative stress. Mol Cell , 619–633. [DOI] [PubMed] [Google Scholar]
- Haze K, Yoshida H, Yanagi H, Yura T, Mori K. (1999). Mammalian transcription factor ATF6 is synthesized as a transmembrane protein and activated by proteolysis in response to endoplasmic reticulum stress. Mol Biol Cell , 3787–3799. [DOI] [PMC free article] [PubMed] [Google Scholar]
- Helton JC, Johnson JD, Sallaberry CJ, Storlie CB. (2006). Survey of sampling-based methods for uncertainty and sensitivity analysis. Reliab Eng Sys Safety , 1175–1209. [Google Scholar]
- Hettmann T, Barton K, Leiden JM. (2000). Microphthalmia due to p53-mediated apoptosis of anterior lens epithelial cells in mice lacking the CREB-2 transcription factor. Dev Biol , 110–123. [DOI] [PubMed] [Google Scholar]
- Hetz C. (2012). The unfolded protein response: controlling cell fate decisions under ER stress and beyond. Nat Rev Mol Cell Biol , 89–102. [DOI] [PubMed] [Google Scholar]
- Hollien J, Lin JH, Li H, Stevens N, Walter P, Weissman JS. (2009). Regulated Ire1-dependent decay of messenger RNAs in mammalian cells. J Cell Biol , 323–331. [DOI] [PMC free article] [PubMed] [Google Scholar]
- Hollien J, Weissman JS. (2006). Decay of endoplasmic reticulum-localized mRNAs during the unfolded protein response. Science , 104–107. [DOI] [PubMed] [Google Scholar]
- Hoops S, Sahle S, Gauges R, Lee C, Pahle J, Simus N, Singhal M, Xu L, Mendes P, Kummer U. (2006). COPASI—a COmplex PAthway SImulator. Bioinformatics , 3067–3074. [DOI] [PubMed] [Google Scholar]
- Kassenbrock CK, Garcia PD, Walter P, Kelly RB. (1988). Heavy-chain binding protein recognizes aberrant polypeptides translocated in vitro. Nature , 90–93. [DOI] [PubMed] [Google Scholar]
- Kim HD, Shay T, O’Shea EK, Regev A. (2009). Transcriptional regulatory circuits: predicting numbers from alphabets. Science , 429–432. [DOI] [PMC free article] [PubMed] [Google Scholar]
- Lee AH, Iwakoshi NN, Glimcher LH. (2003). XBP-1 regulates a subset of endoplasmic reticulum resident chaperone genes in the unfolded protein response. Mol Cell Biol , 7448–7459. [DOI] [PMC free article] [PubMed] [Google Scholar]
- Lee K, Tirasophon W, Shen X, Michalak M, Prywes R, Okada T, Yoshida H, Mori K, Kaufman RJ. (2002). IRE1-mediated unconventional mRNA splicing and S2P-mediated ATF6 cleavage merge to regulate XBP1 in signaling the unfolded protein response. Genes Dev , 452–466. [DOI] [PMC free article] [PubMed] [Google Scholar]
- Lee YY, Cevallos RC, Jan E. (2009). An upstream open reading frame regulates translation of GADD34 during cellular stresses that induce eIF2alpha phosphorylation. J Biol Chem , 6661–6673. [DOI] [PMC free article] [PubMed] [Google Scholar]
- Li G, Mongillo M, Chin KT, Harding H, Ron D, Marks AR, Tabas I. (2009). Role of ERO1-alpha-mediated stimulation of inositol 1,4,5-triphosphate receptor activity in endoplasmic reticulum stress-induced apoptosis. J Cell Biol , 783–792. [DOI] [PMC free article] [PubMed] [Google Scholar]
- Lu PD, Jousse C, Marciniak SJ, Zhang Y, Novoa I, Scheuner D, Kaufman RJ, Ron D, Harding HP. (2004). Cytoprotection by pre-emptive conditional phosphorylation of translation initiation factor 2. EMBO J , 169–179. [DOI] [PMC free article] [PubMed] [Google Scholar]
- Luo S, Baumeister P, Yang S, Abcouwer SF, Lee AS. (2003). Induction of Grp78/BiP by translational block: activation of the Grp78 promoter by ATF4 through an upstream ATF/CRE site independent of the endoplasmic reticulum stress elements. J Biol Chem , 37375–37385. [DOI] [PubMed] [Google Scholar]
- Ma Y, Brewer JW, Diehl JA, Hendershot LM. (2002). Two distinct stress signaling pathways converge upon the CHOP promoter during the mammalian unfolded protein response. J Mol Biol , 1351–1365. [DOI] [PubMed] [Google Scholar]
- Ma Y, Hendershot LM. (2003). Delineation of a negative feedback regulatory loop that controls protein translation during endoplasmic reticulum stress. J Biol Chem , 34864–34873. [DOI] [PubMed] [Google Scholar]
- Marciniak SJ, Yun CY, Oyadomari S, Novoa I, Zhang Y, Jungreis R, Nagata K, Harding HP, Ron D. (2004). CHOP induces death by promoting protein synthesis and oxidation in the stressed endoplasmic reticulum. Genes Dev , 3066–3077. [DOI] [PMC free article] [PubMed] [Google Scholar]
- Morris JA, Dorner AJ, Edwards CA, Hendershot L, Kaufman RJ. (1997). Immunoglobulin binding protein (BiP) function is required to protect cells from endoplasmic reticulum stress but is not required for the secretion of selective proteins. J Biol Chem , 4327–4334. [DOI] [PubMed] [Google Scholar]
- Namba T, Tanaka K, Ito Y, Ishihara T, Hoshino T, Gotoh T, Endo M, Sato K, Mizushima T. (2009). Positive role of CCAAT/enhancer-binding protein homologous protein, a transcription factor involved in the endoplasmic reticulum stress response in the development of colitis. Am J Pathol , 1786–1798. [DOI] [PMC free article] [PubMed] [Google Scholar]
- Nishikawa S, Brodsky JL, Nakatsukasa K. (2005). Roles of molecular chaperones in endoplasmic reticulum (ER) quality control and ER-associated degradation (ERAD). J Biochem , 551–555. [DOI] [PubMed] [Google Scholar]
- Novoa I, Zeng H, Harding HP, Ron D. (2001). Feedback inhibition of the unfolded protein response by GADD34-mediated dephosphorylation of eIF2alpha. J Cell Biol , 1011–1022. [DOI] [PMC free article] [PubMed] [Google Scholar]
- Novoa I, Zhang Y, Zeng H, Jungreis R, Harding HP, Ron D. (2003). Stress-induced gene expression requires programmed recovery from translational repression. EMBO J , 1180–1187. [DOI] [PMC free article] [PubMed] [Google Scholar]
- Oyadomari S, Koizumi A, Takeda K, Gotoh T, Akira S, Araki E, Mori M. (2002). Targeted disruption of the Chop gene delays endoplasmic reticulum stress-mediated diabetes. J Clin Invest , 525–532. [DOI] [PMC free article] [PubMed] [Google Scholar]
- Palam LR, Baird TD, Wek RC. (2011). Phosphorylation of eIF2 facilitates ribosomal bypass of an inhibitory upstream ORF to enhance CHOP translation. J Biol Chem , 10939–10949. [DOI] [PMC free article] [PubMed] [Google Scholar]
- Parmar VM, Schröder M. (2012). Sensing endoplasmic reticulum stress. Adv Exp Med Biol , 153–168. [DOI] [PubMed] [Google Scholar]
- Pennuto M, Tinelli E, Malaguti M, Del Carro U, D’Antonio M, Ron D, Quattrini A, Feltri ML, Wrabetz L. (2008). Ablation of the UPR-mediator CHOP restores motor function and reduces demyelination in Charcot–Marie–Tooth 1B mice. Neuron , 393–405. [DOI] [PMC free article] [PubMed] [Google Scholar]
- Petzold L. (1983). Automatic selection of methods for solving stiff and nonstiff systems of ordinary differential equations. SIAM J Sci Comput , 136–148. [Google Scholar]
- Puthalakath H, O’Reilly LA, Gunn P, Lee L, Kelly PN, Huntington ND, Hughes PD, Michalak EM, McKimm-Breschkin J, Motoyama N, et al. (2007). ER stress triggers apoptosis by activating BH3-only protein Bim. Cell , 1337–1349. [DOI] [PubMed] [Google Scholar]
- Ron D, Walter P. (2007). Signal integration in the endoplasmic reticulum unfolded protein response. Nat Rev Mol Cell Biol , 519–529. [DOI] [PubMed] [Google Scholar]
- Rutkowski DT, Arnold SM, Miller CN, Wu J, Li J, Gunnison KM, Mori K, Sadighi Akha AA, Raden D, Kaufman RJ. (2006). Adaptation to ER stress is mediated by differential stabilities of pro-survival and pro-apoptotic mRNAs and proteins. PLoS Biol , e374. [DOI] [PMC free article] [PubMed] [Google Scholar]
- Scheuner D, Song B, McEwen E, Liu C, Laybutt R, Gillespie P, Saunders T, Bonner-Weir S, Kaufman RJ. (2001). Translational control is required for the unfolded protein response and in vivo glucose homeostasis. Mol Cell , 1165–1176. [DOI] [PubMed] [Google Scholar]
- Shen J, Chen X, Hendershot L, Prywes R. (2002). ER stress regulation of ATF6 localization by dissociation of BiP/GRP78 binding and unmasking of Golgi localization signals. Dev Cell , 99–111. [DOI] [PubMed] [Google Scholar]
- Shen X, Ellis RE, Lee K, Liu CY, Yang K, Solomon A, Yoshida H, Morimoto R, Kurnit DM, Mori K, et al. (2001). Complementary signaling pathways regulate the unfolded protein response and are required for C. elegans development. Cell , 893–903. [DOI] [PubMed] [Google Scholar]
- Song B, Scheuner D, Ron D, Pennathur S, Kaufman RJ. (2008). Chop deletion reduces oxidative stress, improves beta cell function, and promotes cell survival in multiple mouse models of diabetes. J Clin Invest , 3378–3389. [DOI] [PMC free article] [PubMed] [Google Scholar]
- Tabas I, Ron D. (2011). Integrating the mechanisms of apoptosis induced by endoplasmic reticulum stress. Nat Cell Biol , 184–190. [DOI] [PMC free article] [PubMed] [Google Scholar]
- Teske BF, Wek SA, Bunpo P, Cundiff JK, McClintick JN, Anthony TG, Wek RC. (2011). The eIF2 kinase PERK and the integrated stress response facilitate activation of ATF6 during endoplasmic reticulum stress. Mol Biol Cell , 4390–4405. [DOI] [PMC free article] [PubMed] [Google Scholar]
- Thorp E, Li G, Seimon TA, Kuriakose G, Ron D, Tabas I. (2009). Reduced apoptosis and plaque necrosis in advanced atherosclerotic lesions of Apoe–/– and Ldlr–/– mice lacking CHOP. Cell Metab , 474–481. [DOI] [PMC free article] [PubMed] [Google Scholar]
- Trusina A, Papa FR, Tang C. (2008). Rationalizing translation attenuation in the network architecture of the unfolded protein response. Proc Natl Acad Sci USA , 20280–20285. [DOI] [PMC free article] [PubMed] [Google Scholar]
- Trusina A, Tang C. (2010). The unfolded protein response and translation attenuation: a modelling approach. Diabetes Obes Metab (Suppl 2), 27–31. [DOI] [PubMed] [Google Scholar]
- Turányi T. (1990). Sensitivity analysis of complex kinetic systems. Tools and applications. J Math Chem , 203–248. [Google Scholar]
- van Anken E, Braakman I. (2005). Endoplasmic reticulum stress and the making of a professional secretory cell. Crit Rev Biochem Mol Biol , 269–283. [DOI] [PubMed] [Google Scholar]
- Walter P, Ron D. (2011). The unfolded protein response: from stress pathway to homeostatic regulation. Science , 1081–1086. [DOI] [PubMed] [Google Scholar]
- Wong WL, Brostrom MA, Kuznetsov G, Gmitter-Yellen D, Brostrom CO. (1993). Inhibition of protein synthesis and early protein processing by thapsigargin in cultured cells. Biochem J (Pt 1), 71–79. [DOI] [PMC free article] [PubMed] [Google Scholar]
- Wu J, Rutkowski DT, Dubois M, Swathirajan J, Saunders T, Wang J, Song B, Yau GD, Kaufman RJ. (2007). ATF6alpha optimizes long-term endoplasmic reticulum function to protect cells from chronic stress. Dev Cell , 351–364. [DOI] [PubMed] [Google Scholar]
- Yamamoto K, Sato T, Matsui T, Sato M, Okada T, Yoshida H, Harada A, Mori K. (2007). Transcriptional induction of mammalian ER quality control proteins is mediated by single or combined action of ATF6alpha and XBP1. Dev Cell , 365–376. [DOI] [PubMed] [Google Scholar]
- Yoshida H, Matsui T, Yamamoto A, Okada T, Mori K. (2001). XBP1 mRNA is induced by ATF6 and spliced by IRE1 in response to ER stress to produce a highly active transcription factor. Cell , 881–891. [DOI] [PubMed] [Google Scholar]
- Yoshida H, Okada T, Haze K, Yanagi H, Yura T, Negishi M, Mori K. (2000). ATF6 activated by proteolysis binds in the presence of NF-Y (CBF) directly to the cis-acting element responsible for the mammalian unfolded protein response. Mol Cell Biol , 6755–6767. [DOI] [PMC free article] [PubMed] [Google Scholar]
- Yoshida H, Oku M, Suzuki M, Mori K. (2006). pXBP1(U) encoded in XBP1 pre-mRNA negatively regulates unfolded protein response activator pXBP1(S) in mammalian ER stress response. J Cell Biol , 565–575. [DOI] [PMC free article] [PubMed] [Google Scholar]
- Zhang K, Wang S, Malhotra J, Hassler JR, Back SH, Wang G, Chang L, Xu W, Miao H, Leonardi R, et al. (2011). The unfolded protein response transducer IRE1alpha prevents ER stress-induced hepatic steatosis. EMBO J , 1357–1375. [DOI] [PMC free article] [PubMed] [Google Scholar]
- Zinszner H, Kuroda M, Wang X, Batchvarova N, Lightfoot RT, Remotti H, Stevens JL, Ron D. (1998). CHOP is implicated in programmed cell death in response to impaired function of the endoplasmic reticulum. Genes Dev , 982–995. [DOI] [PMC free article] [PubMed] [Google Scholar]
Associated Data
This section collects any data citations, data availability statements, or supplementary materials included in this article.


