

An intact actomyosin network is essential for asymmetric cell division; however, the precise mechanisms remain unclear. We find that the actin-binding protein Moesin is required for neuroblast proliferation and mitotic progression. In addition, the asymmetric and dynamic distribution of Moesin drives the cortical remodeling of dividing neuroblasts, contributing to polarity maintenance and cell size asymmetry.
Abstract
An intact actomyosin network is essential for anchoring polarity proteins to the cell cortex and maintaining cell size asymmetry during asymmetric cell division of Drosophila neuroblasts (NBs). However, the mechanisms that control changes in actomyosin dynamics during asymmetric cell division remain unclear. We find that the actin-binding protein, Moesin, is essential for NB proliferation and mitotic progression in the developing brain. During metaphase, phosphorylated Moesin (p-Moesin) is enriched at the apical cortex, and loss of Moesin leads to defects in apical polarity maintenance and cortical stability. This asymmetric distribution of p-Moesin is determined by components of the apical polarity complex and Slik kinase. During later stages of mitosis, p-Moesin localization shifts more basally, contributing to asymmetric cortical extension and myosin basal furrow positioning. Our findings reveal Moesin as a novel apical polarity protein that drives cortical remodeling of dividing NBs, which is essential for polarity maintenance and initial establishment of cell size asymmetry.
INTRODUCTION
Coordinated self-renewal and differentiation via asymmetric cell division (ACD) is essential for generating cellular diversity during development. Drosophila neuroblasts (NBs) are an effective model for studying mechanisms involved in progenitor cell self-renewal and differentiation during cell division (Jiang and Reichert, 2014; Li et al., 2014). During Drosophila neurogenesis, NBs undergo asymmetric division, renewing the NB and producing a ganglion mother cell (GMC), which differentiates into adult neurons and glia. Neuroblast ACD requires segregation of basal cell fate determinants, such as Prospero (Pros) and Numb, through adaptor proteins Miranda and Partner of Numb (Pon), respectively, into the GMC (Doe et al., 1991; Ikeshima-Kataoka et al., 1997; Li et al., 1997; Shen et al., 1997; Lu et al., 1998). Segregation of basal determinants depend on the localization of two apical protein complexes linked by the adaptor protein Inscuteable (Insc) (Kraut and Campos-Ortega, 1996; Schober et al., 1999; Tio et al., 1999; Parmentier et al., 2000; Schaefer et al., 2000; Yu et al., 2000). The Par polarity complex, consisting of Bazooka (Baz), Par-6, and atypical PKC (aPKC), is the first to localize to the NB cortex. It is primarily involved in excluding basally localized proteins from the apical cortex (Wodarz et al., 1999; Petronczki and Knoblich, 2001; Betschinger et al., 2003). The second apical complex, consisting of Partner of Inscuteable (Pins), the heterotrimeric G protein subunit Gαi, and Mushroom body defect (Mud), is involved in regulating mitotic spindle formation and alignment relative to the polarity axis (Schaefer et al., 2000; Yu et al., 2000; Schaefer et al., 2001; Yu et al., 2003; Izumi et al., 2004; Bowman et al., 2006; Nipper et al., 2007). Basal protein targeting during ACD is also dependent on the cortical tumor suppressor proteins Discs large (Dlg), Lethal [2] giant larvae (Lgl), and Scribble (Ohshiro et al., 2000; Peng et al., 2000; Albertson and Doe, 2003; Betschinger et al., 2003). Thus, proper localization of apical polarity proteins, orientation of the mitotic spindle, and segregation of cell fate determinants all ensure the appropriate balance between NB self-renewal and differentiation.
An intact actin cytoskeleton has also been shown to be essential for cortical anchoring of apical/basal proteins to their respective NB poles (Kraut et al., 1996; Broadus and Doe, 1997; Knoblich et al., 1997; Shen et al., 1998; Lu et al., 1999). Furthermore, Drosophila nonmuscle Myosins function downstream of the apical complex during basal targeting of cell fate determinants and are involved in maintaining cell size asymmetry (Ohshiro et al., 2000; Peng et al., 2000; Barros et al., 2003; Petritsch et al., 2003; Cabernard et al., 2010; Connell et al., 2011). During early anaphase, nonmuscle myosin has been shown to localize asymmetrically to the basal cortex, contributing to asymmetric cortical extension of the apical cortex and the formation of a basally displaced furrow, independent of microtubules (Cabernard et al., 2010; Connell et al., 2011). However, the precise mechanisms underlying actomyosin regulation and dynamics during Drosophila ACD have not been studied extensively.
Ezrin, radixin, and moesin (ERM) proteins are essential organizers of the cell cortex through the ability to bind directly to filamentous actin and link membrane-associated proteins to the underlying actin cytoskeleton (Algrain et al., 1993; Turunen et al., 1994; Hirao et al., 1996). ERM proteins are regulated by an intramolecular interaction between the N-terminal Four-point-one ERM domain and the C-terminal tail (Gary and Bretscher, 1993; Nguyen et al., 2001). Phosphorylation of a conserved threonine residue in the actin-binding region of the ERM proteins relieves this intramolecular interaction and is essential for protein activation (Nakamura et al., 1995; Matsui et al., 1998; Oshiro et al., 1998; Hayashi et al., 1999; Tran Quang et al., 2000). In the closed inactive form, the proteins are unable to interact with transmembrane proteins or filamentous actin (Matsui et al., 1998; Nakamura et al., 1999). As functional redundancy among the ERM proteins has been proposed (Doi et al., 1999), studies investigating the single Drosophila ERM orthologue Moesin can provide relatively unambiguous insight into ERM function (McCartney and Fehon, 1996). Drosophila Moesin has been implicated in regulating epithelial tissue integrity (Speck et al., 2003; Hipfner et al., 2004; Karagiosis and Ready, 2004; Molnar and de Celis, 2006), and numerous studies in Drosophila cell culture have shown that phosphorylated Moesin (p-Moesin) is involved in cortical remodeling in symmetrically dividing cells (Carreno et al., 2008; Kunda et al., 2008, 2012; Roubinet et al., 2011). In mitotic Schneider 2 (S2) cells, p-Moesin is distributed uniformly at the metaphase cortex, and the loss of Moesin leads to the formation of cytoplasmic bulges and an irregular distribution of actomyosin regulators during metaphase (Carreno et al., 2008; Kunda et al., 2008). Thus, the uniform distribution of Moesin is essential for maintaining a round and stable cell cortex. However, the significance of an asymmetric Moesin distribution in cortical remodeling during mitosis has not been investigated in vivo.
Here we show that Moesin is essential for proliferation and stable cortical remodeling in asymmetrically dividing NBs of the Drosophila brain. We identify Moesin as a novel apical polarity protein involved in polarity maintenance and cortical integrity in NBs undergoing metaphase. We further show that Slik kinase, a known regulator of Moesin phosphorylation (Hipfner et al., 2004), is essential for Moesin phosphorylation in mitotic NBs and thus NB proliferation and polarity maintenance. Finally, we find that known components of the apical polarity complex are important for the polar distribution of p-Moesin in metaphase NBs. During early anaphase, p-Moesin contributes to myosin basal furrow positioning and the initial establishment of cell size asymmetry. Thus, the dynamic and asymmetric distribution of p-Moesin during mitosis is important for cortical remodeling during ACD.
RESULTS
Phosphorylated Moesin is asymmetrically localized in mitotic NBs
Using an antibody specific to the conserved phosphorylated residue of mammalian ezrin/radixin/moesin (Hayashi et al., 1999), we found that phosphorylated Moesin (p-Moesin) localized to the cell cortex of both larval central brain and optic lobe NBs (Figure 1A). P-Moesin appeared asymmetrically enriched at the cell cortex of central brain NBs (Figure 1A; yellow arrows) and was largely reduced in the surrounding differentiated cells, indicated by the GMC-specific marker Prospero (Figure 1A) (Matsuzaki et al., 1992). As NB polarity is established at the onset of mitosis (Spana and Doe, 1995), the localization of p-Moesin was examined throughout NB ACD. We found that p-Moesin had a dynamic asymmetric distribution pattern as NBs progressed through mitosis (Figure 1, B–H). When the relative mean fluorescence intensity (FI) of p-Moesin was measured along the NB cortex, from the apical to basal pole (schematic in Figure 1C), we found that p-Moesin was enriched at the apical cortex during metaphase (Figure 1, B and C; compartment I). During anaphase, the relative mean FI of p-Moesin was reduced at the apical cortex (Figure 1, D and E) and p-Moesin was enriched at the basal NB cortex during telophase (Figure 1, F–H; compartment IV). The polar enrichment of p-Moesin was most likely established during the prophase-to-metaphase transition, as p-Moesin was cortical but discontinuous in 75% of NBs and 25% of NBs showed a polar distribution of p-Moesin during prophase (n = 20; Supplemental Figure 1, A and B); whereas 100% of metaphase NBs displayed an apical enrichment of p-Moesin (n = 27; Figure 1B). Previously, p-Moesin was shown to increasingly localize to the cell cortex on mitotic entry and remained uniformly distributed from prophase to metaphase in Drosophila S2 cells (Carreno et al., 2008). In contrast, we found a polar distribution of p-Moesin was established by metaphase in NBs, leading us to hypothesize that Moesin is essential for asymmetric NB divisions.
FIGURE 1:

Phosphorylated Moesin localizes asymmetrically in mitotic NBs. (A) w1118 third instar larval central brain (CB) and optic lobe (OL) was fluorescently labeled with anti–p-Moesin (green) and anti-Prospero (Pros; magenta). P-Moesin localizes to the cortex of NBs with an asymmetric p-Moesin enrichment indicated by yellow arrows. (B, C) P-Moesin and the basal polarity protein (Numb) are enriched at opposite cortical poles during metaphase. (C) The relative mean FI of p-Moesin along the lateral cortex (indicated by the blue line in the schematic diagram) shows that p-Moesin is enriched at the apical cortex (compartment I) during metaphase (n = 5). (D, E) P-Moesin is reduced at the apical cortex during anaphase, with the relative mean FI of p-Moesin along the lateral cortex shown (n = 5). (F–H) P-Moesin is enriched at the basal cortex of the dividing NB and accumulates at the cleavage furrow site during telophase. (H) The relative mean FI of p-Moesin along the lateral cortex shows that p-Moesin is enriched at the basal NB cortex where the cleavage furrow forms (compartment IV; n = 5). (B, D, F, G) Merged panels are single focal plane images and show DAPI (blue), p-Moesin (green), Numb (red), and β-tubulin (cyan). Grayscale images are maximum intensity projections. Error bars represent SD. Scale bars represent (A) 50 μm and (B, D, F, G) 5 μm.
Moesin is essential for NB proliferation and mitotic progression
To investigate the functional significance of Moesin in the larval NBs, we analyzed the effect of double-stranded RNA (dsRNA)-mediated knockdown of Moesin (MoedsRNA) in the NBs, using Insc-GAL4 (Brand and Perrimon, 1993). We expressed Dicer as well, to enhance Moesin knockdown levels. The Moesin immunofluorescence (IF) signal was reduced in the MoedsRNA larval CNS, confirming reduction of Moesin expression (Supplemental Figure 2, A and B). At 96 h after larval hatching (ALH), the overall size of the CNS was reduced in the MoedsRNA larvae compared with controls (Figure 2, A–C, and Supplemental Figure 2, A and B). In control larval brains, the mitotic NBs were marked using the NB-specific marker Deadpan (Dpn) and phospho-histone H3 (PH3) to mark mitotic cells (Figure 2, A and B) (Bier et al., 1992). When Moesin was knocked down, the CNS was reduced in size and fewer mitotic NBs were observed (Figure 2C). Previous studies have shown that all NBs, except the mushroom body NBs, exit the cell cycle and either undergo apoptosis or become quiescent by late embryogenesis (Green et al., 1993; White et al., 1994; Younossi-Hartenstein et al., 1996; Prokop et al., 1998; Peterson et al., 2002). During early larval stages, NBs enlarge, reenter the cell cycle and continue dividing throughout larval development, giving rise to the majority of adult neurons and glia (Truman and Bate, 1988; Prokop and Technau, 1991; Ito and Hotta, 1992; Britton and Edgar, 1998). Thus, the observed reduced larval CNS size may be due to a failure of NBs to reenter the cell cycle, decreased NB divisions, or increased cell death.
FIGURE 2:

Moesin is essential for NB proliferation and mitotic progression. UAS-Dicer;;UAS-MoedsRNA was crossed to w1118 (Ctrl) and Insc-GAL4 (MoedsRNA). UAS-Dicer alone was crossed to Insc-GAL4 (Dicer). (A–C) The larval CNS of Control, Dicer, and MoedsRNA labeled with anti-Deadpan (Dpn; green) and anti–phospho-histone H3 (PH3; magenta) at 96 h after larval hatching (ALH) are shown. (D) The mean number of Dpn-positive cells and (E) mean proportion of PH3-positive, Dpn-positive cells per central brain lobes of Control, Dicer, and MoedsRNA at ∼24, 48, 72, and 96 h ALH (n = minimum of 28 brain lobes; see Materials and Methods for exact sample sizes). (F) The diameter of Control and MoedsRNA metaphase NBs at 48 h (n = 35 and 44 NBs, respectively) and 96 h (n = 23 NBs each) ALH. The red line marks the mean diameter. (G) The area of Control and MoedsRNA interphase NBs at 48 h ALH (n = 30 and 39 NBs, respectively). The red line marks the mean area. (H) The mean proportion of PH3-positive, Dpn-positive cells undergoing the specific stages of mitosis per central brain lobe of Control (n = 28) and MoedsRNA (n = 55) at 96 h ALH. In control brain lobes, the mean proportions (± SE) of mitotic NBs in the specific stages are 29.6 ± 2.0% (prophase), 43.4 ± 2.0% (metaphase), 7.2 ± 1.6% (anaphase), and 19.7 ± 1.6% (telophase). In MoedsRNA brain lobes, the mean proportions (± SE) of mitotic NBs are 60 ± 4.6% (mitotic defective), 13.9 ± 2.8% (prophase), 16.7 ± 2.6% (metaphase), 0.7 ± 0.3% (anaphase), and 4.6 ± 2.1% (telophase). Scale bars represent (A–C) 100 μm. Error bars represent SE. *p < 0.05, **p < 0.001, ***p < 0.0001, and ns = not significant using an unpaired t test.
To examine whether NB divisions were affected in the Moesin knockdown during larval development, the number and the proportion of mitotic NBs per brain lobe was quantified at 24, 48, 72, and 96 h ALH (Figure 2, D and E). The number of NBs were reduced significantly in MoedsRNA brain lobes from 24 to 96 h ALH compared with control animals (Figure 2D). In brain lobes isolated from control animals, the proportion of mitotic NBs increased from 24 to 48 h ALH (Figure 2E), the time at which NBs exit quiescence (Truman and Bate, 1988; Ito and Hotta, 1992). However, in MoedsRNA brain lobes, the proportion of mitotic NBs decreased from 24 to 48 h and remained largely the same from 48 to 96 h ALH (Figure 2E). Furthermore, the optic lobes were reduced in size, and no mitotic NBs were observed in the ventral nerve cord in 87% of MoedsRNA larvae at 96 h ALH (n = 30 larvae; Supplemental Figure 2C). The NBs within the MoedsRNA ventral nerve cord also appeared smaller, and the Dpn IF signal was weak and diffuse (Supplemental Figure 2C). Reduced NB size and a weaker Dpn signal were previously shown to be characteristic of quiescent NBs (Chell and Brand, 2010). We also found that the Moesin knockdown NBs undergoing metaphase in the brain lobes had a reduced cell diameter compared with controls (Figure 2F). At 48 h ALH, the MoedsRNA metaphase NBs had a mean diameter of 8.31 ± 0.17 μm (n = 44, p < 0.0001) compared with control NBs (11.74 ± 0.28 μm; n = 35) (Figure 2F). At 96 h ALH, the mean diameter of control NBs was 11.56 ± 0.27 μm (n = 23), while the mean diameter of MoedsRNA NBs was further reduced in size to 6.30 ± 0.34 μm (n = 23, p < 0.0001) (Figure 2F). To determine whether NB cell size was specifically affected during mitotic entry, the area of interphase NBs was measured at 48 h ALH (Figure 2G). At this time point, MoedsRNA interphase NBs had a reduced mean area of 62.15 ± 2.98 μm2 (n = 39, p < 0.0001) compared with control interphase NBs (122.30 ± 5.60 μm2; n = 30) (Figure 2G). Together, these findings suggest that NB divisions and overall size are impaired when Moesin levels are reduced.
To further examine the role of Moesin in mitotic NBs, the proportion of PH3-positive NBs in each mitotic stage was quantified in the MoedsRNA and control larval brain lobes. We found a reduced proportion of mitotic NBs in stages prophase to telophase per MoedsRNA brain lobe compared with controls at 96 h ALH (Figure 2H). We found that 60% of PH3-positive MoedsRNA NBs could not be classified to a particular stage of mitosis and thus were scored as “mitotic defective” (Figure 2H and Supplemental Figure 3A). In these mitotic-defective NBs, the spindle poles were not visible, and only cortical microtubules were observed using α-tubulin (Supplemental Figure 3A). However, the nuclear envelope appeared to be broken down as Miranda was diffuse throughout the cytoplasm. Furthermore, aPKC polarity was not established and only PH3-positive condensed chromosomes were observed in these NBs (Supplemental Figure 3A). To confirm specificity of MoedsRNA, we expressed a second independent Moesin dsRNA (MoeIR) (Karagiosis and Ready, 2004) using Insc-GAL4 and found mitotic defective NBs within MoeIR brain lobes as well (Supplemental Figure 3B). The presence of mitotic defective NBs suggests that Moesin is involved in mitotic progression during ACD. The proportion of mitotic NBs undergoing the specific stages was also measured at 48 h ALH to confirm that the defects observed at later stages do not arise as a result of abnormal larval development. At 48 h ALH, 64% of mitotic NBs were defective in mitosis, and there was a reduced proportion of NBs undergoing the specific stages of mitosis compared with controls (Supplemental Figure 3C). These proportions observed at 48 h ALH were comparable to the proportions observed at 96 h ALH (compare Supplemental Figure 3C and Figure 2H). Thus, mitotic progression was impaired in the Moesin knockdown during early and late stages of larval development. Furthermore, a significant amount of cell death was not observed in the MoedsRNA NBs (Supplemental Figure 3, D–G). When we measured the proportion of TUNEL-positive/Dpn-positive cells, we did not observe any apoptotic NBs in control brain lobes at 48 and 96 h ALH (n = 16 brain lobes each). In MoedsRNA larvae, only two brain lobes with one apoptotic NB at 48 and 96 h ALH (n = 16 brain lobes each) were detected. Thus, the reduced size of the MoedsRNA CNS was due to a lack of NB divisions and not an increase in cell death during larval development.
Slik regulates NB proliferation and Moesin phosphorylation
To confirm that the active, phosphorylated form of Moesin is essential for NB divisions, the role of the Sterile20-like kinase Slik was also examined. Previously, Slik was shown to regulate Moesin phosphorylation in Drosophila cell culture and epithelial tissues (Hipfner et al., 2004; Hughes and Fehon, 2006; Carreno et al., 2008). As the role for Slik in Drosophila NBs was unknown, Slik localization in the larval NBs was determined. We found that Slik localized to the cell cortex of NBs and Prospero-expressing GMCs (Figure 3A). As p-Moesin was shown to be enriched at the apical cortex of metaphase NBs (Figure 1, B and C), we also analyzed Slik distribution at the metaphase cortex. The mean FI of p-Moesin and Slik at the apical and basal poles was measured to determine the apical/basal FI ratio (see Materials and Methods). An apical/basal FI ratio greater than 1.10 was considered an apical enrichment, whereas an apical/basal FI ratio close to 1 (between 0.90 and 1.09) represented an absent polar crescent. Although p-Moesin was apically enriched during metaphase, with an apical/basal FI ratio of 1.99 ± 0.12 (mean ± SE; n = 23), Slik was not apically enriched and was uniformly distributed at the metaphase cortex (0.93 ± 0.04, n = 23, p < 0.0001; Figure 3, B and C). Thus, Slik localized to the NB cortex but did not display a polar distribution during metaphase.
FIGURE 3:

Slik is essential for NB proliferation and Moesin phosphorylation. (A) w1118 larval NBs labeled with DAPI (blue), anti-Moesin (green), anti-Slik (red), and anti-Prospero (cyan). Slik partially colocalizes with Moesin at the NB cortex and localizes to the GMC cortex. (B) w1118 larval NB undergoing metaphase labeled with DAPI (blue), anti–p-Moesin (cyan), anti-Slik (green), and anti–α-tubulin (red) as shown in merged panel. (C) The apical/basal FI ratios of p-Moesin and Slik in metaphase NBs (n = 23) show that p-Moesin is apically enriched (1.99 ± 0.12; mean ± SE) and Slik is uniformly distributed at the apical and basal cortices (0.93 ± 0.04, p < 0.0001). The red line marks the mean ratio. (D, E) w1118 and slik1 larval CNS labeled with anti-Deadpan (Dpn; green) and anti–phospho-histone H3 (PH3; magenta) at 96 h ALH. (F) The mean number of Dpn-positive cells and (G) the mean proportion of PH3-positive, Dpn-positive cells per central brain lobes of w1118 (n = 35) and slik1 (n = 26) at 96 h ALH. (H) The diameter of metaphase NBs in w1118 (n = 25) and slik1 (n = 29) ∼5–6 d AEL. The red line marks the mean diameter. (I, J) w1118 and slik1 larval metaphase NBs labeled with DAPI (blue), anti–p-Moesin (cyan), anti-Numb (green), and anti–β-tubulin (red) at ∼5–6 d AEL. (J) The p-Moesin signal is reduced in slik1 mutant NBs during metaphase, compared with w1118 controls. Scale bars represent (A) 10 μm, (B, I, J) 5 μm, and (D, E) 100 μm. Error bars represent SE. ***p < 0.0001 using an unpaired t test.
To determine whether Slik function is required in the larval CNS, we analyzed brains from slik1 homozygous null mutants (Hipfner and Cohen, 2003). The CNS from slik mutant larvae was reduced in size (Figure 3, D and E), with a decrease in the number of NBs at 96 h ALH (Figure 3F). Furthermore, there was a reduced proportion of mitotic NBs per brain lobe in the slik mutant (Figure 3G), suggesting that NB divisions were affected with the loss of Slik. The mean diameter of metaphase NBs was reduced in slik mutant larval brain lobes (7.12 ± 0.31, n = 29; p < 0.0001) compared with controls (12.48 ± 0.30, n = 25; Figure 3H). These phenotypes observed in the slik mutant brain were very similar to what was observed with the Moesin knockdown (Figure 2). Indeed, we found that the p-Moesin IF signal was reduced in slik mutant larval NBs compared with control NBs undergoing metaphase (Figure 3, I and J). Thus, Slik was important for Moesin phosphorylation in NBs and required for NB proliferation.
Moesin is important for apical polarity maintenance in mitotic NBs
As p-Moesin was apically enriched in metaphase NBs, we asked if Moesin was required for apical polarity maintenance during NB ACD. Consistent with previous studies, we found that Bazooka and aPKC polarity was established during prophase in control NBs (Figure 4, A and C, and Table 1) (Schober et al., 1999; Wodarz et al., 1999; Siegrist and Doe, 2006). However, in MoedsRNA NBs, Bazooka and aPKC crescents were not observed in a proportion of NBs undergoing prophase (Figure 4, B and D, and Table 1). An absent polar crescent was defined as an apical/basal FI ratio between 0.90 and 1.09. In 58% of MoedsRNA prophase NBs, the apical/basal FI ratio for Bazooka was 1.05 ± 0.06 (mean ± SD; n = 33) and in 48% of NBs, the mean apical/basal FI ratio for aPKC was 1.04 ± 0.06 (n = 46), whereas 0% of control NBs had an apical/basal FI ratio less than 1.10 (Table 1). The overall apical/basal FI ratio for Bazooka was 1.23 ± 0.05 (mean ± SE; n = 33, p < 0.0001) in MoedsRNA prophase NBs, which was significantly less than controls (1.72 ± 0.07, n = 29). Furthermore, the overall apical/basal FI ratio for aPKC was also significantly less in MoedsRNA prophase NBs when compared with controls (Table 1). Thus, it appeared that aPKC and Bazooka polarity maintenance was affected in MoedsRNA NBs during prophase. This defect in apical polarity maintenance coincided with a disorganized actin cytoskeleton in MoedsRNA NBs (Figure 4, C and D). In control NBs, cortical actin appeared well defined; whereas cortical actin appeared discontinuous in MoedsRNA prophase NBs (Figure 4, C and D; arrows).
FIGURE 4:

Moesin is involved in apical polarity maintenance in NBs undergoing prophase and metaphase. UAS-Dicer;;UAS-MoesindsRNA was crossed to w1118 (Ctrl) and Insc-GAL4 (MoedsRNA) and larval NBs undergoing (A–D) prophase and (E–J) metaphase were analyzed ∼96 h ALH. (A) Bazooka (Baz) and (C) aPKC crescents form in control NBs during prophase. (B) Baz and (D) aPKC crescents are not observed in a proportion of MoedsRNA NBs during prophase. (C, D) Filamentous actin (Phalloidin; red) appears discontinuous in Moesin knockdown NBs undergoing prophase (yellow arrows) compared with controls. (E) Par-6 crescents form in control NBs during metaphase. (F) A weak polar Par-6 signal (yellow asterisk) and (G) an absent polar Par-6 signal is observed in MoedsRNA NBs during metaphase. (H) aPKC crescents form in control NBs during metaphase. (I) A weak polar aPKC signal (yellow asterisk) and polar Miranda is observed in MoedsRNA NBs during metaphase. (J) An absent polar aPKC and polar Miranda is observed in MoedsRNA NBs. Refer to Table 1 for summary of phenotypic proportions observed. Merged panels are single focal plane images and show DAPI (blue), Miranda (cyan), α-tubulin or aPKC/PH3 (green), and specified apical polarity protein or Phalloidin (red). Grayscale images are maximum intensity projections, with the exception of Phalloidin panels, which are single focal plane images. Scale bars represent 5 μm.
TABLE 1:
Apical phenotypic proportions and FI ratios in Moesin knockdown and control NBs.
| Polar crescenta | Weak crescent | Absent crescent | Mean ratiob | ||||||
|---|---|---|---|---|---|---|---|---|---|
| Control | MoedsRNA | Control | MoedsRNA | Control | MoedsRNA | Control | MoedsRNA | ||
| 96 h ALH | |||||||||
| Prophase | Bazooka | 79% | 21% | 21% | 21% | – | 58% | 1.72 ± 0.07 | 1.23 ± 0.05 |
| 1.83 ± 0.30 | 1.73 ± 0.27 | 1.26 ± 0.06 | 1.21 ± 0.05 | 1.05 ± 0.06 | n = 29 | n = 33, p < 0.0001 | |||
| aPKC | 81% | 30% | 19% | 22% | – | 48% | 1.58 ± 0.05 | 1.28 ± 0.05 | |
| 1.67 ± 0.25 | 1.68 ± 0.25 | 1.23 ± 0.08 | 1.25 ± 0.08 | 1.04 ± 0.06 | n = 37 | n = 46, p < 0.0001 | |||
| Metaphase | Bazooka | 94% | 64% | 6% | 27% | – | 9% | 2.11 ± 0.08 | 1.61 ± 0.06 |
| 2.15 ± 0.56 | 1.84 ± 0.32 | 1.29 ± 0.07 | 1.25 ± 0.10 | 1.06 ± 0.04 | n = 54 | n = 55, p < 0.0001 | |||
| Pins | 100% | 65% | – | 23% | – | 12% | 2.00 ± 0.06 | 1.56 ± 0.10 | |
| 2.00 ± 0.34 | 1.80 ± 0.34 | 1.20 ± 0.03 | 0.99 ± 0.11 | n = 28 | n = 17, p = 0.0004 | ||||
| Par-6 | 81% | 8% | 19% | 54% | – | 38% | 1.53 ± 0.03 | 1.18 ± 0.04 | |
| 1.59 ± 0.14 | 1.60 ± 0.08 | 1.29 ± 0.09 | 1.22 ± 0.09 | 1.02 ± 0.05 | n = 27 | n = 24, p < 0.0001 | |||
| aPKC | 92% | 29% | 8% | 51% | – | 20% | 1.95 ± 0.06 | 1.34 ± 0.03 | |
| 2.00 ± 0.36 | 1.70 ± 0.19 | 1.24 ± 0.05 | 1.25 ± 0.08 | 1.04 ± 0.05 | n = 53 | n = 82, p < 0.0001 | |||
| 48 h ALH | |||||||||
| Prophase | aPKC | 83% | 18% | 17% | 32% | – | 50% | 1.73 ± 0.06 | 1.18 ± 0.04 |
| 1.81 ± 0.30 | 1.58 ± 0.12 | 1.30 ± 0.10 | 1.20 ± 0.09 | 1.02 ± 0.07 | n = 30 | n = 28, p < 0.0001 | |||
| Metaphase | aPKC | 91% | 40% | 9% | 44% | – | 16% | 2.10 ± 0.10 | 1.39 ± 0.05 |
| 2.17 ± 0.56 | 1.71 ± 0.24 | 1.27 ± 0.09 | 1.24 ± 0.09 | 1.02 ± 0.07 | n = 35 | n = 43, p < 0.0001 | |||
Refer to Figure 4 for examples of apical phenotypes observed.
aProportions (%) and mean apical/basal FI ratio ±SD are listed for specific phenotypes observed.
bMean apical/basal FI ratio ±SE of entire sample (n). MoedsRNA FI ratios were compared with controls.
During metaphase, an absence of a Bazooka crescent was found in only 9% of MoedsRNA NBs (1.06 ± 0.04, n = 55; Table 1). A polar crescent, which was defined as an apical/basal FI ratio greater than 1.40, was observed for Bazooka in 64% of MoedsRNA NBs (n = 55; Table 1). A weak polar Bazooka crescent was defined as an apical/basal FI ratio between 1.10 and 1.39, which was observed in 27% of MoedsRNA NBs (n = 55; Table 1). Although, the overall mean apical/basal FI ratio of Bazooka was less in MoedsRNA metaphase NBs (1.61 ± 0.06, n = 55; p < 0.0001), when compared with controls (2.11 ± 0.08, n = 54), the mean FI was greater than 1.40. The overall mean apical/basal FI ratio for Pins was also greater than 1.40 in MoedsRNA metaphase NBs (1.56 ± 0.10, n = 17; Table 1). Thus, although Bazooka polarity maintenance was initially affected in the prophase MoedsRNA NBs, defects in Bazooka and Pins polarity were less apparent during metaphase.
A more severe effect with aPKC and Par-6 polarity maintenance was observed in MoedsRNA metaphase NBs. The Par-6 IF signal was weak but polar in 54% of MoedsRNA NBs (n = 24; Figure 4F, asterisk, and Table 1). In 38% of MoedsRNA NBs, a polar Par-6 signal was absent during metaphase (n = 24; Figure 4G and Table 1). Similarly, a weak polar or an absent aPKC crescent was observed in the majority of MoedsRNA NBs during metaphase (n = 82; Figure 4J and Table 1). However, the basal polarity protein, Miranda, remained localized to a cortical pole in the majority of MoedsRNA NBs (Figure 4, I and J), even when an aPKC crescent was absent during metaphase (Figure 4J). Thus, polar Miranda can be established in an aPKC-independent manner when Moesin levels were reduced. We also found that aPKC polarity maintenance was impaired in MoedsRNA larval NBs at 48 h ALH (Table 1), confirming that polarity defects did not accumulate over time but occurred at earlier larval stages. Together, these findings showed that Moesin was involved in apical polarity maintenance during prophase. However, during metaphase, Par-6 and aPKC polarity maintenance was more sensitive to the loss of Moesin, whereas Bazooka and Pins localization at the apical cortex occurred in a largely Moesin-independent manner.
The effect of Slik on the regulation of polarity maintenance during ACD was also assessed. We found that in 87% of slik mutant NBs, an aPKC crescent did not form during prophase (n = 23; Figure 5, A–C). The mean apical/basal FI ratio for aPKC was 1.03 ± 0.02 (n = 23, p < 0.0001) in slik mutant NBs, whereas the ratio was 1.66 ± 0.07 in controls (Figure 5C). During metaphase, 65% of slik mutant NBs formed a weak polar aPKC signal (n = 26; Figure 5E, asterisk), and an aPKC crescent was not observed in 27% of NBs (n = 26; Figure 5F), although Miranda was still able to localize to a cortical pole in both cases. The overall mean apical/basal FI ratio for aPKC was significantly less in slik mutant NBs (1.12 ± 0.03, n = 26; p < 0.0001), when compared with controls during metaphase (1.94 ± 0.08, n = 26; Figure 5G). Together, these findings suggested that Slik was also involved in aPKC polarity maintenance during NB ACD, likely through regulating Moesin activity.
FIGURE 5:

Slik is important for aPKC polarity maintenance in NBs. w1118 and slik1 larval NBs labeled with DAPI (blue), anti–α-tubulin (green), anti-aPKC/anti–phospho-histone H3 (aPKC/PH3; red), and anti-Miranda (Mira; cyan), ∼5–6 d AEL. (A) An aPKC crescent forms in w1118 NBs undergoing prophase. (B) An aPKC crescent is not observed in 87% of slik1 mutant NBs undergoing prophase (n = 23). (C) The apical/basal FI ratios of aPKC in w1118 (n = 20) and slik1 (n = 23) prophase NBs are shown. The red line marks the mean ratio. (D) An aPKC crescent is observed in w1118 metaphase NBs. (E) A weak polar aPKC signal is observed in 65% of slik1 NBs, indicated by the yellow asterisk, and (F) a polar aPKC signal is absent in 27% slik1 NBs during metaphase (n = 26). (G) The apical/basal FI ratios of aPKC in w1118 (n = 26) and slik1 (n = 26) metaphase NBs are shown. The red line marks the mean ratio. Merged panels are single focal plane images, and grayscale images are maximum intensity projections. Scale bars represent 5 μm. ***p < 0.0001 using an unpaired t test.
The apical polarity complex is important for asymmetric Moesin localization during metaphase
To further investigate the proteins that affect the asymmetric distribution of Moesin, we examined whether loss of known apical polarity proteins altered the apical enrichment of p-Moesin during metaphase. The dsRNA-mediated knockdown of apical polarity proteins Cdc42, Par-6, aPKC, and Lgl in the NBs resulted in a uniform distribution of p-Moesin in a proportion of NBs during metaphase (Figure 6, A–E). The mean apical/basal FI ratio of p-Moesin was significantly less in the respective knockdowns compared with controls (Figure 6F). Thus, not only is Moesin involved in apical polarity maintenance, but also components of the apical Par complex in turn are important for the proper asymmetric distribution of p-Moesin in NBs.
FIGURE 6:

Apical polarity proteins are important for the asymmetric distribution of p-Moesin during metaphase. Third instar larval NBs of (A) w1118, (B) UAS-Cdc42dsRNA, (C) UAS-Par6dsRNA, (D) UAS-aPKCdsRNA, and (E) UAS-LgldsRNA crossed to Insc-GAL4. The p-Moesin immunofluorescence signal appears reduced at the apical cortex of metaphase NBs in the respective knockdowns, when compared with controls. (F) The apical/basal FI ratios of p-Moesin in metaphase NBs of controls (n = 20), Cdc42dsRNA (n = 10), Par-6dsRNA (n = 30), aPKCdsRNA (n = 33), and LgldsRNA (n = 13). The red line marks the mean ratio. (G–L) w1118 and pins193 larval NBs undergoing metaphase ∼5–6 AEL. (H–L) Multiple phenotypes are observed in pins193 mutant NBs during metaphase (n = 138), compared with (G) w1118 metaphase NBs, which display polar p-Moesin and polar Numb at opposite poles (100%, n = 57). Polar p-Moesin and Numb are enriched at (H) opposite poles (17%, n = 138) and (I) the same pole (19%, n = 138) in pins193 mutant NBs. (J) Polar p-Moesin and uniform Numb (17%, n = 138), (K) uniform/discontinuous p-Moesin and polar Numb (16%, n = 138), and (L) uniform/discontinuous p-Moesin and uniform Numb (20%, n = 138) distributions are observed in pins193 mutant NBs during metaphase. Polar enrichment is indicated by yellow asterisk. Merged panels are single focal plane images and show DAPI (blue), p-Moesin (cyan), Numb (red), and β-tubulin (green). Grayscale images in A–E are maximum intensity projections and in G–L are single focal plane images. Scale bars represent 5 μm. *p < 0.05 and ***p < 0.0001 using an unpaired t test.
How the loss of Pins affected p-Moesin distribution during metaphase was also examined. In pins193 hypomorphic mutant larval brains (Parmentier et al., 2000), a wide range of phenotypes were observed compared with controls (Figure 6, G–L). P-Moesin and Numb displayed both a polar and uniform or discontinuous distribution at the cortex of pins mutant NBs during metaphase (n = 138; Figure 6, H–L). In 17% of pins mutant NBs, p-Moesin and Numb were enriched at opposite poles, similarly to control NBs (n = 138; Figure 6, G and H, asterisks). However, in 19% of pins mutant NBs, polar p-Moesin and Numb crescents were found at the same cortical pole (n = 138; Figure 6I). Although p-Moesin displayed a polar enrichment, Numb appeared uniformly distributed at the cortex in a proportion of NBs (17%, n = 138; Figure 6J). A uniform or discontinuous distribution of p-Moesin was also observed in pins mutant NBs, with either a polar (16%, n = 138) or a uniform (20%, n = 138) distribution of Numb at the cortex (Figure 6, K and L, respectively). Furthermore, the mitotic spindle was misoriented in 40% of pins mutant NBs that formed either p-Moesin or Numb crescents (n = 109; Figure 6, H–K, merge panels). These findings suggested that Pins was important for proper asymmetric distribution of p-Moesin opposite of Numb and relative to the mitotic spindle during metaphase.
Moesin is essential for cortical stability and remodeling during asymmetric cell division
To further explore Moesin function in the larval NBs, we examined a Moesin hypomorphic mutant (MoeG0323) that survives further into third instar larval stages (Speck et al., 2003). The overall brain morphology of the MoeG0323 larvae appeared relatively unaffected and the number of NBs per brain lobe was not significantly different when compared with w1118 control brains (Supplemental Figure 4, A–C). Thus, the MoeG0323 brain phenotype was not as severe as that observed in the MoedsRNA larvae. Notably, the p-Moesin IF signal was reduced in MoeG0323 brains (Supplemental Figure 4, A and B). As the MoedsRNA NBs displayed defects in polarity maintenance, we analyzed aPKC polarity in MoeG0323 NBs. In contrast to the MoedsRNA metaphase NBs, the aPKC crescent was absent in 2% of MoeG0323 mutant NBs and 98% of mutant NBs displayed a polar aPKC signal (n = 116). A polar aPKC crescent similar to controls was observed in 65% of MoeG0323 mutant NBs (n = 116; Figure 7B). However, aPKC also localized to ectopic sites at the NB cortex in 35% of MoeG0323 NBs, when an aPKC crescent was also present (n = 75; Figure 7B arrow). In addition, cortical instability was observed in mitotic MoeG0323 mutant NBs as indicated by the presence of cortical blebs (Figure 7B, asterisk). In 21% of MoeG0323 mutant NBs, the integrity of the aPKC polar domain appeared disorganized and reduced in size compared with the polar aPKC crescents formed in controls (n = 116; Figure 7C). Miranda localized to the cortical pole opposite of aPKC in 74% of MoeG0323 mutant NBs, although polar Miranda appeared reduced or diffuse in some cases (Figure 7, B and C). Thus, Moesin was found to be important for maintaining polar domain integrity and organization, likely through regulating cortical stability during ACD.
FIGURE 7:
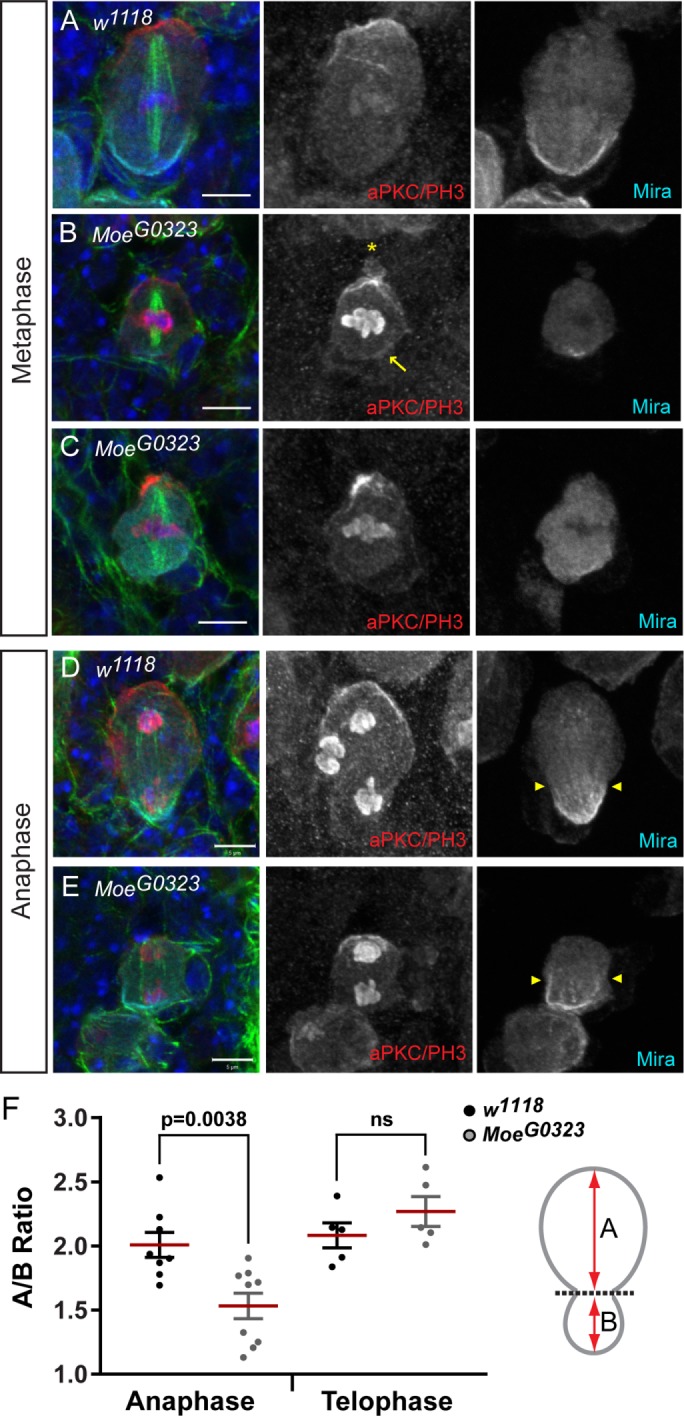
Moesin is important for apical integrity and cortical asymmetric divisions. NBs from w1118 and MoeG0323 third instar larvae were labeled with DAPI (blue), anti–α-tubulin (green), anti-aPKC/anti–phospho-histone H3 (aPKC/PH3; red) and anti-Miranda (Mira; cyan). (A) A polar aPKC crescent forms in w1118 metaphase NBs. (B) A polar aPKC crescent, similar to controls, forms in 65% of MoeG0323 metaphase NBs (n = 116); however, aPKC localizes to ectopic cortical sites in 35% of these MoeG0323 NBs (yellow arrow; n = 75). Cortical blebbing is present in MoeG0323 NBs (yellow asterisk). (C) The polar aPKC domain appears disorganized in 21% of MoeG0323 NBs during metaphase (n = 116). (B, C) Miranda localizes to the opposite cortical pole of aPKC in 74% of MoeG0323 NBs (n = 116), although polar Miranda crescents appear reduced in size or diffuse compared with control NBs. (D) An asymmetric basal furrow is observed in w1118 NBs undergoing anaphase (yellow arrowheads). (E) Initial constriction at the presumptive cleavage furrow site (yellow arrowheads) appears symmetric in MoeG0323 NBs undergoing anaphase. (F) The quantification of A/B ratios in w1118 and MoeG0323 NBs undergoing anaphase (n = 8 and 9, respectively) and telophase (n = 5). The red line marks the mean ratio. Merged panels are single focal plane images, and grayscale images are maximum intensity projections. Scale bars represent 5 μm. ns = not significant using an unpaired t test.
As MoeG0323 phenotypes were less severe than those induced by MoedsRNA, we were able to observe NBs undergoing anaphase and telophase, which were rarely observed in the MoedsRNA brains (Figure 2H). In control NBs, an asymmetric basal furrow was induced by late anaphase, as indicated by Miranda localization at the smaller basal cortex and the segregating chromosomes reaching their respective poles (Figure 7D, arrowheads). Although, aPKC and Miranda localized to opposite cortical poles in the majority of MoeG0323 NBs undergoing anaphase (Figure 7E), a misoriented polarity axis relative to the mitotic spindle was observed in 11% of MoeG0323 NBs undergoing anaphase and early telophase (n = 45). Furthermore, MoeG0323 NB divisions appeared symmetric during initial constriction at the presumptive cleavage furrow site in a proportion of NBs (Figure 7E; arrowheads). The extent of asymmetry was quantified by measuring the distance from the furrow to the apical (A) and basal (B) cortices and determining the A/B ratio during late anaphase and telophase (Figure 7F; schematic diagram). The A/B ratio of control NBs was 2.00 ± 0.10 (mean ± SE, n = 8) (Figure 7F). The mean A/B ratio was significantly reduced in MoeG0323 NBs during anaphase (1.53 ± 0.10, n = 9; p < 0.0001) (Figure 7F). In the MoeG0323 mutants, 44% of NBs had an A/B ratio less than 1.50 (n = 9), which was not observed in controls (n = 8). Thus, asymmetric basal furrow positioning appears to be impaired in the MoeG0323 hypomorphic mutant NBs undergoing anaphase. However, the A/B ratio of MoeG0323 NBs was not statistically different from controls during late cleavage furrow formation (Figure 7F), suggesting that cell size asymmetry was rescued by late telophase in the Moesin mutant NBs.
To further investigate cortical dynamics of control and Moesin hypomorphic mutant NBs undergoing ACD, we used live imaging to visualize filamentous actin and the mitotic spindle in NBs expressing LifeAct–green fluorescent protein (GFP) (Riedl et al., 2008) and chRFP-Tubulin (Rusan and Peifer, 2007). We found that ACD of control NBs lasted 12:21 ± 0:22 (mean ± SE in minutes:seconds; n = 24) measured from the point of nuclear envelope breakdown (NEB) to cytokinesis. In MoeG0323 mutant NBs, ACD lasted 16:13 ± 0:55 (mean ± SE in minutes:seconds; p = 0.0001 compared with controls, n = 20). The increased time for ACD to complete in the MoeG0323 mutant was due to a delay in anaphase onset, as the NBs remained in metaphase for an extended period of time (Figure 8, A and B, and Supplemental Videos 1 and 2). In control NBs, the cell cortex appeared round and stable during metaphase (Figure 8A and Supplemental Video 1). However, in MoeG0323 NBs, the metaphase cortex was unstable and irregular cortical actin dynamics were observed (Figure 8B, yellow arrows, and Supplemental Video 2). A nonuniform distribution of phosphorylated Myosin Light Chain II (p-Myosin) at the MoeG0323 metaphase cortex, along with Rho kinase (Rok), was also observed (Figure 8, C–F). In control NBs, Rok-GFP and p-Myosin appeared cortical with a slight apical enrichment in metaphase NBs (Figure 8, C and D). However, Rok-GFP and p-Myosin was enriched at the lateral cortex or discontinuous at the MoeG0323 metaphase cortex (Figure 8, E and F, yellow arrows). Thus, Moesin was essential for maintaining a round and stable actomyosin cortex in metaphase NBs.
FIGURE 8:

Moesin is essential for maintaining a stable actomyosin cortex during metaphase. (A, B) Live imaging of Insc-GAL4; UAS-ChRFP-Tub, UAS-Lifeact-GFP crossed to w1118 and MoeG0323 to visualize filamentous actin (green) and the mitotic spindle (magenta) in NBs. Single focal plane images were selected from Supplemental Videos 1 and 2 to further demonstrate cortical dynamics during metaphase. The time value in the top left corner of the merged panels is shown in minutes:seconds. NEB occurs at 0:00. (A) A round and stable metaphase cortex is observed in w1118 NBs. (B) The NB cortex appears unstable and nonuniform cortical actin dynamics (yellow arrows) are observed in MoeG0323 mutant NBs during metaphase. (C–F) Metaphase NBs observed in larval brains isolated from Ubi-Rok-GFP crossed to (C, D) w1118 and (E, F) MoeG0323. (C, D) Rok-GFP and p-Myosin appear cortical with a slight apical enrichment, as shown in D where the relative FI was measured around the entire metaphase cortex (white dashed line in merged panel). (E, F) Rok-GFP and p-Myosin displayed a nonuniform distribution at the MoeG0323 metaphase cortex and was enriched at the lateral cortex (yellow arrows), as shown in F, where the relative FI was measured around the entire cortex (white dashed line in merge). Merged panels show DAPI (blue), anti–p-Myosin (red), and anti-GFP (green). Scale bars represent 5 μm.
Video S1.
Live imaging of control neuroblast undergoing asymmetric cell division. Insc-GAL4; UAS-ChRFP-Tub, UAS-Lifeact-GFPwas crossed to w1118 to visualize filamentous actin (green) and the mitotic spindle (magenta) in the neuroblast. The time value indicated in the top right corner of the video is shown as hours:minutes:seconds. The neuroblast cortex appears round and stable during metaphase (from approximately 00:03:45 to 00:07:30). Maximum intensity projections are shown and scale bar represents 1.90 μm. Selected single focal plane images are shown in Figure 8 A.
Video S2.
Live imaging of Moesin hypomorphic mutant neuroblast undergoing asymmetric cell division.Insc-GAL4; UAS-ChRFP-Tub, UAS-Lifeact-GFPwas crossed to MoeG0323 to visualize filamentous actin (green) and the mitotic spindle (magenta) in the neuroblast. The time value indicated in the top right corner of the video is shown as hours:minutes:seconds. The neuroblast cortex appears unstable and irregular cortical actin dynamics are observed during metaphase (from approximately 00:06:45 to 00:20:48). Maximum intensity projections are shown and scale bar represents 1.90 μm. Selected single focal plane imagesare shown in Figure 8 B.
As the loss of Moesin led to defects in basal furrow positioning (Figure 7, E and F), actomyosin organization during early anaphase was further examined. Control NBs displayed restricted cortical actin at the site of furrow induction (Figure 9A, yellow arrowheads). In MoeG0323 NBs, although basal furrow formation was induced following a delay in anaphase onset, cortical actin did not appear to be as restricted to the presumptive cleavage furrow site compared with controls (Figure 9B, yellow arrowheads). Cortical instability was observed throughout ACD of MoeG0323 mutant NBs, indicated by the presence of cortical blebbing (Figure 9B, yellow arrows). Previously, Myosin was shown to localize asymmetrically to the basal cortex in NBs undergoing anaphase (Barros et al., 2003; Cabernard et al., 2010). The Myosin-induced basal furrow contributes to asymmetric cortical extension and formation of a basally displaced cleavage furrow, independent of the mitotic spindle (Cabernard et al., 2010; Connell et al., 2011). Consistent with previous studies, p-Myosin was found to be enriched at the basal furrow in control NBs undergoing early anaphase (80%, n = 5; Figure 9, C and D). However, in MoeG0323 NBs, p-Myosin was not enriched at the basal cortex during early anaphase (100%; n = 5). The nonuniform distribution of p-Myosin at the lateral cortex observed in metaphase MoeG0323 NBs (Figure 8, E and F) persisted into early anaphase, or p-Myosin localized to the equatorial region (Figure 9, E and F). Thus, the impaired basal furrow and the initial appearance of symmetric divisions observed in MoeG0323 NBs (Figure 7, E and F) was likely due to the absence of an induced p-Myosin basal furrow during early anaphase. These findings suggest that Moesin functions in the spindle-independent cleavage furrow positioning pathway. However, during late cleavage furrow formation, p-Myosin localization in MoeG0323 NBs was similar to controls and accumulated at the cleavage furrow site (unpublished data), supporting the observation that MoeG0323 NB divisions eventually appeared asymmetric (Figure 7F). Together, these findings show that Moesin regulates NB cortical stability and actomyosin dynamics essential for timely mitotic progression and the initial establishment of cell size asymmetry during ACD.
FIGURE 9:

Moesin regulates Myosin-induced furrow positioning during early anaphase. (A, B) Live imaging of Insc-GAL4; UAS-ChRFP-Tub, UAS-Lifeact-GFP crossed to w1118 and MoeG0323 to visualize filamentous actin (green) and the mitotic spindle (magenta) in the NBs. The time value in the top left corner of the merged panels is shown in minutes:seconds. NEB occurs at 0:00. (A) Furrow induction (yellow arrowheads) shows restricted cortical actin at this site in the w1118 control NB. (B) Cortical actin does not appear to be as restricted to the furrow site (yellow arrowheads) in the MoeG0323, as in the w1118 NB. Cortical blebbing (yellow arrows) is also observed throughout ACD of MoeG0323 NB. (C–F) w1118 and MoeG0323 larval NBs undergoing early anaphase were labeled with DAPI (blue), anti–α-tubulin (green), anti–p-Myosin (red), and anti-Miranda (Mira; cyan). (C, D) P-Myosin localizes to the basal furrow in 80% of w1118 NBs undergoing early anaphase (n = 5). The white dashed line from the apical to basal pole in the merged panel indicates the region of the cortex that was measured in D. (D) The relative p-Myosin FI along the w1118 lateral cortex from the apical to basal cortical pole shows that p-Myosin is enriched at the basal cortex. (E, F) P-Myosin localizes to the cell equator in the MoeG0323 NB shown and the p-Myosin basal furrow was not observed during early anaphase (100%; n = 5). The white dashed line from the apical to basal pole in the merge panel indicates the region of the cortex that was measured in F. (F) The relative p-Myosin FI along the MoeG0323 lateral cortex from the apical to basal cortical pole shows that p-Myosin peaks near the cell equator. All panels shown are a single focal plane images. Scale bars represent 5 μm.
DISCUSSION
Studies investigating ERM function have highlighted the importance of the ERM proteins in regulating the mechanical properties of the cell cortex. We provide new insight into the role of Moesin in organizing the cortex of cells that establish intrinsic polarity and undergo ACD in vivo. When Moesin was knocked down in Insc-expressing cells, the larval CNS was reduced in size due to a decrease in the proportion of dividing NBs throughout larval development. We found that expressing MoedsRNA using the Insc-GAL4 driver affected overall larval development and resulted in larval lethality. However, we were able to obtain viable progeny when Moesin levels were reduced using other NB-GAL4 drivers, asense-GAL4 (Zhu et al., 2006) and worniu-GAL4 (Albertson et al., 2004). When upstream activation sequence–GFP (UAS-GFP) was expressed using the different NB GAL4 drivers, GFP mRNA expression was ∼5 fold greater using Insc-GAL4 compared with asense- or worniu-GAL4 (unpublished data). Thus, the differences in viability are likely due to the increased strength of Insc-GAL4. Recent studies that identified the Hippo pathway as an essential regulator of NB quiescence also used Insc-GAL4 in their analyses (Ding et al., 2016; Poon et al., 2016). As we cannot exclude that the reduced proportion of mitotic NBs may partially be due to impaired cell cycle reentry or an overall delay in larval development, we focused our analysis on the mitotic NBs that had exited quiescence. We confirmed that defects in mitotic progression and polarity maintenance were observed at both early and late stages of the Moesin knockdown and in the late hypomorphic mutants, demonstrating a functional requirement of Moesin within the larval NBs.
Proper regulation and function of the ERM proteins are required during cell division in both flies (Carreno et al., 2008; Kunda et al., 2008; Cheng et al., 2011) and mammals (Luxenburg et al., 2011). In Drosophila S2 cells, the increased and uniform distribution of p-Moesin at the metaphase cortex enhanced cortical rigidity and cell rounding, proposed to be essential for stable spindle positioning (Carreno et al., 2008; Kunda et al., 2008). Drosophila Moesin was also shown to bind and stabilize microtubules at the cortex of cultured cells (Solinet et al., 2013). Thus, an asymmetric ERM distribution during metaphase would be predicted to influence spindle position and orientation accordingly. In human colorectal Caco2 cells, polarized ezrin locally stabilized actin, providing a physical platform for astral microtubule-mediated centrosome positioning during interphase (Hebert et al., 2012). HeLa cells cultured on L-shaped micropatterns also displayed restricted ERM activation at the cell cortex adjacent to the adhesive substrate, which was essential for LGN/NuMA polarization and guiding spindle orientation (Thery et al., 2005; Machicoane et al., 2014). In Drosophila wing imaginal epithelial cells, p-Moesin was enriched at the basal cortex of mitotic cells and the loss of Moesin led to defects in planar spindle orientation and recruitment of the pericentriolar material marker, Centrosomin (Nakajima et al., 2013; Sabino et al., 2015). Thus, a role for Moesin in guiding spindle orientation and centrosome behaviour has been well documented. In Drosophila NBs, we found that p-Moesin was apically enriched at the metaphase cortex, although the mitotic spindle has been reported to be symmetric and centrally located during metaphase (Kaltschmidt et al., 2000; Cai et al., 2003). Thus, apical p-Moesin is likely not involved in generating spindle asymmetry during metaphase. We cannot exclude the possibility of its involvement in preparing for the establishment of an asymmetric spindle during anaphase (Kaltschmidt et al., 2000; Cai et al., 2003; Yu et al., 2003). Furthermore, the loss of Moesin affected spindle orientation in only a small proportion of NBs (unpublished data), and the localization of the Drosophila LGN orthologue, Pins, was largely unaffected in Moesin knockdown NBs during metaphase. Thus, Moesin does not appear to play a prominent role in regulating spindle orientation in NBs. However, Moesin may affect the localization or activity of interacting partners downstream of Pins such as Mud or the heterotrimeric G protein subunit Gαi. Alternatively, the loss of both Moesin and Pins may cause more severe defects in spindle orientation and cell size asymmetry. Thus, future studies examining the loss of both Moesin and Pins may reveal a role for Moesin in maintaining centrosome positioning and spindle orientation in NBs.
We found that overall NB cell size was reduced in the Moesin knockdown. The reduced size of interphase NBs during early larval stages (48 h ALH) suggests that Moesin may be involved in NB enlargement prior to NB exit from quiescence (Truman and Bate, 1988; Ito and Hotta, 1992). NB reactivation also appeared impaired in the ventral nerve cords of Moesin knockdown larvae. Previous studies have implicated Insulin/PI3K signaling in NB growth and reactivation during early larval stages (Chell and Brand, 2010; Sousa-Nunes et al., 2011). Further examination of these signaling pathways in the Moesin knockdown NBs are required to determine the mechanisms underlying its potential role in NB enlargement and reactivation. Of the NBs that had exited quiescence, we observed a large proportion of mitotic defective NBs during early and late larval stages. These NBs were not round and may reflect the importance of Moesin in cell rounding during early mitosis, as previously shown in Drosophila cell culture (Carreno et al., 2008; Kunda et al., 2008). Alternatively, the mitotic defective NBs may represent a population of NBs that have failed to undergo cell division. As the loss of Moesin also resulted in a reduced proportion of mitotic NBs undergoing each stage of mitosis, we propose that Moesin is essential for cell shape changes and mitotic progression during ACD.
ERM proteins localize to the apical cortex of a wide variety of polarized cells and are essential for maintaining the apical identity and surface properties of epithelial tissues across multiple organisms (Berryman et al., 1993; Louvet et al., 1996; Speck et al., 2003; Gobel et al., 2004; Karagiosis and Ready, 2004; Saotome et al., 2004; Van Furden et al., 2004; Pilot et al., 2006). By binding directly to filamentous actin and linking membrane-associated proteins to the underlying actin cytoskeleton (Algrain et al., 1993; Turunen et al., 1994; Hirao et al., 1996), the ERM proteins localize to numerous actin-rich structures (Sato et al., 1991; Berryman et al., 1993; Franck et al., 1993). Thus, it is possible that the apical p-Moesin represents areas rich in actin filaments at the NB cortex. Although the actin cytoskeleton is important for cortical tethering of polarity complexes in NBs (Broadus and Doe, 1997; Knoblich et al., 1997; Shen et al., 1998; Lu et al., 1999), filamentous actin does not display an asymmetric distribution (Hirata et al., 1995; Knoblich et al., 1995; Spana and Doe, 1995; Broadus and Doe, 1997). Thus, apical p-Moesin may correlate with enhanced cortical stability at the apical cortex necessary for polarity maintenance and integrity.
Confirming a role for p-Moesin in stabilizing cortical actin, we found that Bazooka and aPKC crescents were not observed in a proportion of MoedsRNA NBs undergoing prophase and actin appeared discontinuous at the cell cortex. As Bazooka and aPKC polarity is established by prophase (Schober et al., 1999; Wodarz et al., 1999; Siegrist and Doe, 2005), prior to the polar enrichment of p-Moesin, we conclude that Moesin is involved in polarity maintenance rather than establishment. Similarly, in the Mus musculus and Caenorhabditis elegans intestinal epithelium, ERM proteins are involved in apical membrane assembly and integrity but do not appear to be required for polarity establishment (Saotome et al., 2004; Van Furden et al., 2004). During metaphase, we observed a proportion of MoedsRNA NBs lacking both Par-6 and aPKC polar crescents. However, the majority of MoedsRNA NBs displayed Bazooka and Pins polar crescents at the metaphase cortex. In the absence of Par-6 and aPKC, apical domains consisting of Bazooka, Inscuteable, Pins, and Discs large are still able to form (Rolls et al., 2003). Thus, Moesin may be specifically maintaining Par-6/aPKC polarity during metaphase but have little effect on other apical polarity proteins such as Bazooka and Pins. Furthermore, the aPKC polar domain was disorganized, and cortical blebbing was observed in the MoeG0323 mutant NBs. Thus, Moesin regulates the integrity and maintenance of the apical domain, likely through affecting cortical stability during ACD.
The complex spatiotemporal regulation of Moesin activity during mitosis has been demonstrated in symmetrically dividing S2 cells and requires the coordinated activities of PP1-87B phosphatase, Slik kinase, and regulators of phosphatidylinositol 4,5-bisphosphate (PI[4,5]P2) levels at the cell cortex (Carreno et al., 2008; Kunda et al., 2008, 2012; Roubinet et al., 2011). We showed that Slik was uniformly distributed at the NB cell cortex. As Slik is regulated by phosphorylation (Panneton et al., 2015), it is possible that the phosphorylated Slik is asymmetrically distributed in mitotic NBs. Furthermore, we found that Slik is essential for NB proliferation and polarity maintenance, likely through regulating Moesin phosphorylation at the NB cortex. The loss of Flapwing and PP1-87B phosphatases did not alter the apical enrichment of p-Moesin in metaphase NBs (unpublished data). Future studies examining other phosphatases and regulators of PI(4,5)P2 levels at the NB cortex are essential for further understanding Moesin regulation during ACD.
In addition to Slik kinase, we found that known apical polarity proteins (Cdc42, Par-6, aPKC, Lgl, and Pins) are important for the proper apical enrichment of p-Moesin during metaphase. As Moesin is also important for maintenance of the apical domain, these findings support a mutually dependent interaction among the apical polarity proteins that has been extensively reported in NBs (Schober et al., 1999; Wodarz et al., 1999; Parmentier et al., 2000; Schaefer et al., 2000; Wodarz et al., 2000; Yu et al., 2000; Rolls et al., 2003; Lee et al., 2006; Atwood et al., 2007). Components of the apical polarity complexes also mediate spindle asymmetry and asymmetric cortical extension during anaphase, leading to the generation of unequal-sized daughter cells (Chenn and McConnell, 1995; Cai et al., 2003; Fuse et al., 2003; Cabernard et al., 2010). Similarly, we found that Moesin was important for initial positioning of an asymmetric basal furrow during anaphase.
In Drosophila NBs, a cortical polarity-induced pathway, consisting of Pins and the heterotrimeric G-proteins, is essential for apical cortical extension and formation of a Myosin-induced basal furrow, independent of the mitotic spindle (Cabernard et al., 2010; Connell et al., 2011). We found that the relative FI of p-Moesin was reduced at the apical cortex during anaphase when compared with metaphase NBs. Furthermore, the loss of Moesin resulted in the absence of p-Myosin at the basal cortex, affecting basal furrow positioning during anaphase. In Drosophila S2 cells, reduced p-Moesin at the cell poles was shown to lead to cortical relaxation and membrane elongation (Kunda et al., 2012). Thus, we propose that p-Moesin regulation at the apical cortex is important for asymmetric cortical extension and furrow positioning during early anaphase, likely along with Pins and the heterotrimeric G-proteins. However, Moesin also appeared to influence Myosin-mediated cortical contractility during metaphase as well. We showed that with the loss of Moesin, p-Myosin and Rok-GFP displayed a nonuniform distribution at the metaphase cortex, revealing unstable actomyosin dynamics and a delay in anaphase onset. Although we did not find any observable differences in cortical Rho1 localization at the metaphase cortex (unpublished data), future studies using alternative biosensor approaches may allow for more precise visualization and analysis of Rho1 signaling (Verboon and Parkhurst, 2015). In addition, further investigation of the mechanical properties of cultured NBs will provide great insight into how Moesin function influences the mitotic cortex in the absence of physical constraint or external cues. While this work was under review, the Cabernard group showed that Rok and Protein Kinase N are involved in the precise spatiotemporal regulation of Myosin flow during the establishment of physical asymmetry (Roubinet et al., 2017; Tsankova et al., 2017). Given our findings, it will be interesting to further examine how Moesin precisely regulates Myosin dynamics, along with the other components of the polarity-induced cleavage furrow positioning pathway.
MATERIALS AND METHODS
Fly strains and genetics
The following lines were obtained from the Bloomington Drosophila Stock Centre: Insc-GAL4 (P. Kolodziej, Vanderbilt University; FBst0008751), Insc-GAL4;UAS-chRFP-Tubulin (M. Peifer, University of North Carolina, Chapel Hill; FBst0025773), UAS-Lifeact-GFP (D. Montell and D. Cai, University of California, Santa Barbara; FBst0057326), pins193 (M. Parmentier, CNRS; FBst0006491), UAS-Dicer (B. Dickson; FBst0024646), UAS-MoedsRNA (MoedsRNA) (Transgenic RNAi Project; FBst0031872), UAS-Moe.IR.327-775 (MoeIR) (D. Ready and S. Karagiosis, Purdue University; FBst0008629) UAS-Cdc42dsRNA (Transgenic RNAi Project; FBst0035756), UAS-Par6dsRNA (Transgenic RNAi Project; FBst0038361), UAS-aPKCdsRNA (Transgenic RNAi Project; FBst0034334), and UAS-LgldsRNA (Transgenic RNAi Project; FBst0035773). UAS-MoedsRNA (Transgenic RNAi Project) and UAS-Moe.IR.327-775 was combined with UAS-Dicer. MoeG0323 19A FRT/FM7, Krupple-GFP was obtained from R. Fehon (University of Chicago) (Speck et al., 2003). Slik1 42D FRT/CyO, actin-GFP was obtained from D. Hipfner (IRCM) (Hipfner and Cohen, 2003). Ubi-Rok-GFP was obtained from Y. Bellaïche (Institute Curie) (Bardet et al., 2013). When necessary, stocks were maintained over actin-GFP balancer chromosomes and larvae of interest were chosen by lack of GFP. w1118 flies were used as wild-type control. Flies were maintained on the following: 5 g/l agar, 75 g/l cornmeal, 32 g/l yeast, 90 g/l sucrose, and 2.5 g/l methyl 4-hydroxybenzoate (Schwarz et al., 2014).
Time-course experiments
Embryos were collected for 2 h (MoedsRNA and control experiments) and 4 h (slik1 mutant and control experiments) on apple juice plates. Embryos or nonGFP larvae were transferred to Petri dishes containing food (recipe mentioned above) and covered with a plastic cage (100-ml plastic beaker with a cut-out bottom and covered with mesh) that was parafilmed to the dish. Cages containing embryos/larvae were sprayed twice daily with water to maintain moisture, and larvae were dissected at indicated hours after larval hatching (∼22–24 h after egg laying [AEL]). The above setup was used for all Moe knockdown, slik1, pins193 experiments and respective controls, as these larvae are very weak.
Immunofluorescence
Larvae were dissected in 1× phosphate-buffered saline (PBS) and fixed in 4% paraformaldehyde for 20 min. Dissected larvae were rinsed at least 5 times in 1× PBS and blocked in 0.1% Triton X-100, and 1% normal donkey serum in 1× PBS (PTN) for at least 1 h at room temperature (RT). Primary antibodies in PTN were incubated overnight at 4°C. Larvae were rinsed/washed for at least 1 h in PTN at RT. Secondary antibodies in PTN were incubated for 2–4 h at RT and rinsed/washed for at least 2 h in PTN at RT. Larvae were incubated in 4,6-diamidino-2-phenylindole (DAPI) for 10 min and rinsed at least 3 times in PTN and at least 3 times in 1× PBS prior to mounting in ProLong Gold Antifade Reagent. For cell death analysis, the In Situ Cell Death Detection Kit, TMR red (TUNEL; Roche), was preabsorbed on fixed wild-type tissue for 30 min. Secondary antibodies were removed from larval brains and the preabsorbed TUNEL reagent was added. Larval brains were incubated with the cell death reagent for 2 h at RT. Tissues were rinsed with PTN for at least 2 h at RT and rinsed with 1× PBS prior to mounting. For rabbit anti–phospho-Ezrin (Thr567)/Radixin (Thr564)/Moe (thr558), dissected larvae were fixed in 10% trichloroacetic acid (Hayashi et al., 1999) for 45 min on ice and rinsed at least 5 times in 30 mM glycine in 1× PBS.
For rabbit anti–phospho-Myosin light chain 2 (p-Myosin), dissected larvae were fixed in 4% paraformaldehyde containing 0.5 mM ethyl glycol-bis-tetraacetic acid (EGTA) and 5 mM MgCl2 for 20 min and rinsed at least five times in 0.3% Triton X-100 in 1× PBS. Primary antibodies used were as follows: rabbit anti–phospho-Ezrin (Thr567)/Radixin (Thr564)/Moe (thr558) (1:100; Cell Signaling #3149 and #3726; referred to as p-Moesin), rabbit anti–phospho-Myosin light chain 2 (1:30; Cell Signaling #3671), rabbit anti–Moesin D44 (1:20 000; D. Kiehart; referred to as Moesin), rat anti–α-tubulin (1:100; Bio-Rad MCA77G), mouse anti–β-tubulin (1:1000; DSHB E7), rabbit anti-Bazooka (1:1000; A. Wodarz), rabbit anti-Pins (1:1000; F. Yu), rabbit anti–PKC ζ (1:500; Santa Cruz sc-216), rabbit anti–Par-6 (1:500; J. Knoblich), guinea pig anti–Par-6 (1:1000; A. Wodarz), mouse anti-Miranda (1:200; F. Matsuzaki), guinea pig anti-Miranda (1:1000; A. Wodarz), guinea pig anti-Numb (1:1000; J. Skeath), guinea pig anti-Dpn (1:500; J. Skeath), rabbit anti-Dpn (1:1000; Y. N. Jan), mouse anti-Prospero (1:500; DSHB MR1A), rat anti-Elav (1:500; DSHB 7E8A10), rabbit anti–phospho-histone H3 (1:2000; Millipore #06-570), mouse anti–phospho-histone H3 (1:1000; abcam 14955), guinea pig anti-Slik (1:10,000; D. Hipfner), mouse anti–GFP 3E6 (1:500; Invitrogen), and Phalloidin Alexa Fluor 546 (1:1000; Invitrogen). Secondary antibodies used were as follows: donkey anti-rabbit, -mouse, -guinea pig, and -rat Alexa Fluor 488/555/647 (1:2000; abcam). Imaging was performed using a Zeiss LSM 700 confocal microscope using 20× NA 0.8 objective (Plan-Apochromat; Zeiss), 40× NA 1.3 oil immersion objective (EC Plan-Neofluar; Zeiss), and 63× NA 1.4 oil immersion objective (Plan-Apochromat; Zeiss). The acquisition software used was Zen 2009. Adobe Photoshop and Illustrator CS4 were used to generate figures.
Neuroblast quantification and measurements
Measurement of cortical and apical/basal FIs.
For the quantification of relative mean FI of p-Moesin during mitosis (Figure 1), the maximum intensity projections were divided into four equal compartments (I, II, III, IV) from the apical to basal cortical poles in Fiji. A segmented line of 5.0-pixel width was drawn along the NB cortex within each compartment in an apical to basal direction. The XY coordinates of the plot profiles were copied into Excel. The gray values were divided by the maximum gray value within each compartment and the relative mean gray value (%) was determined. The above steps were repeated for each lateral half of the cortex and the overall relative mean FIs within each compartment were determined for each NB.
For quantification of apical/basal FI ratios, the NBs were segmented in Bitplane Imaris x64 7.3.1. The maximum intensity projections of the segmented NBs were divided into four equal compartments (I, II, III, IV) from the apical to basal cortical poles in Fiji. The mean gray value within compartments I and IV were measured and the apical/basal FI ratio was determined by dividing the mean gray value of compartment I (apical) by the mean gray value of compartment IV (basal). An apical/basal FI ratio between 0.90 and 1.09 was considered “absent.” An apical/basal FI ratio between 1.10–1.39 was considered “weak polar” and a ratio greater than 1.40 was considered “polar.” The dot plots were generated and statistical analysis was performed using GraphPad Prism 7.
The relative FI of Rok-GFP and p-Myosin along the apical and basal cortices (Figure 8) was determined by drawing a segmented line of 5.0-pixel width around the entire NB cortex (maximum projections of cell midplanes), starting from the apical half and ending with the basal half. The XY coordinates of the plot profiles were copied into Excel and divided by the maximum gray value to determine the relative FI along NB cortex.
The relative FI of p-Myosin during anaphase (Figure 9) was determined by drawing a segmented line of 5.0-pixel width along the lateral cortex from the apical to basal pole. The XY coordinates of the plot profiles were copied into Excel and divided by the maximum gray value to determine the relative FI along the lateral cortex.
Quantification of NBs and mitotic NBs.
Central brain NBs (Type I and II; excluded intermediate progenitors based on size, proximity, and location within the brain lobe) fluorescently labeled with antibodies specific to Deadpan and PH3 were quantified per brain lobe from confocal sections taken at ∼0.4-μm intervals using the Zen 2 software. The number of PH3-positive and Dpn-positive cells were divided by total number of Dpn-positive cells per central brain lobe to determine proportion (%) of PH3-positive, Dpn- positive cells per central brain lobe. Exact sample sizes (n = number of central brain lobes quantified) for Control/Dicer/MoedsRNA NB and mitotic NB quantifications were as follows: Control at 24 h (n = 40), 48 h (n = 38), 72 h (n = 37), and 96 h (n = 38) ALH; Dicer at 24 h (n = 33), 48 h (n = 39), 72 h (n = 38), and 96 h (n = 30) ALH; MoedsRNA at 24 h (n = 38), 48 h (n = 36), 72 h (n = 28), 96 h (n = 44) ALH.
Neuroblast diameter/area measurements.
The diameter of metaphase NBs and the area of interphase NBs was measured from maximum intensity projections of central brain NBs fluorescently labeled with antibodies specific to apical polarity marker (aPKC, Bazooka, etc.), Miranda, α-tubulin, and PH3. Using Fiji software, the diameter was measured by averaging the axis bisecting the PH3-positive metaphase chromosomes and the orthogonal axis of the apical and basal crescents. The interphase area was measured by drawing a segmented line along the entire NB cortex. The length and area of the scale bars within each projection was measured as a reference. The dot plots were generated and statistical analysis was performed using GraphPad Prism 7.
Quantification of NBs in the stages of mitosis.
The proportion of PH3-positive NBs in the specific stages of mitosis were quantified from central brain NBs fluorescently labeled with antibodies specific to aPKC, Miranda, α-tubulin, and PH3. Mitotic NBs were confirmed using Miranda and PH3 as a NB and mitotic marker, respectively. The stages of mitosis were determined using PH3 and α-tubulin to visualize the chromosomes and mitotic spindle, respectively: Prophase NBs displayed condensed chromosomes and mitotic spindle poles forming as microtubule organizing centers. Metaphase NBs were identified as the mitotic spindle aligning PH3-positive chromosomes at metaphase plate. NBs undergoing anaphase displayed the mitotic spindle separating chromosomes to their respective poles. NBs undergoing telophase were identified as cells that displayed separated chromatids at their respective poles and diffuse/basal Miranda localized to the cleavage furrow formation and the daughter cell.
Measurement of cell asymmetry.
Using Fiji software, a straight line was drawn at the site of furrowing in NBs undergoing late anaphase and late telophase. A perpendicular line was drawn from the apical NB cortex to the line at the furrow and the length of the line was measured (A). Another perpendicular line was drawn from the basal/GMC cortex to the line at the furrow and the length of this line was also measured (B). The A/B ratio was determined by dividing the length of A by the length of B.
Live imaging and processing
Lifeact-GFP and chRFP-Tubulin localization in wild-type and Moesin hypomorphic mutant NBs were imaged in brains from third instar male larvae collected from crosses between Insc-GAL4; UAS-Lifeact-GFP, UAS-chRFP-Tubulin and w1118 and MoeG0323/FM7c, P[Dfd-GMR-nvYFP]1 flies, respectively. The live imaging protocol was adapted from (Lerit et al., 2014). Larval brains were dissected in filter sterilized Schneider’s Insect medium (Sigma) supplemented with penicillin–streptomycin. Larval brains with ventral nerve cords facing down were submerged in 30-μl drop of supplemented media on 25-mm-diameter round Deckgläser cover glass (neuVitro) placed in Attofluor cell chamber for microscopy (Invitrogen). Four drops of 30 μl Halocarbon oil 700 (Sigma-Aldrich) were placed on a cover glass at four corners centered around drop of media containing larval brains. YSI Model 5793 gas-permeable membrane (cut to size of round cover glass) was placed on top of cover glass with drops of media and halocarbon oil. Media and oil was allowed to disperse (5 min) before assembling cell chamber. Imaging was performed at 24°C using a Zeiss coupled to a Ultraview spinning disk confocal microscope (Perkin Elmer) using a 63× NA 1.4 oil immersion objective (Plan-Apochromat; Zeiss) and Hamamatsu C9100-50 camera. 15-25 z sections were taken at 1 μm intervals and recorded every 30–60 s. The acquisition software used was Volocity 6.3.0 (Perkin Elmer). Fiji, Adobe Photoshop, and Illustrator CS4 was used for data analysis and figure formatting.
Supplementary Material
Acknowledgments
We thank Richard Fehon, Gary Eitzen, and Shelagh Campbell for critical review of the article. We are grateful to Yohanns Bellaïche and Richard Fehon for fly stocks and David Hipfner, Dan Keihart, Yuh-Nung Jan, Jürgen Knoblich, Fumio Matsuzaki, James Skeath, Andreas Wodarz, and Fengwei Yu for antibody reagents. We also thank Martin Srayko and members of the Hughes and Simmonds labs for valuable discussions. Furthermore, stocks obtained from the Bloomington Drosophila Stock Center (National Institutes of Health P40OD018537) were used in this study.
Abbreviations used:
- ACD
asymmetric cell division
- AEL
after egg laying
- ALH
after larval hatching
- dsRNA
double-stranded RNA
- ERM
ezrin/radixin/moesin
- FI
fluorescence intensity
- GMC
ganglion mother cell
- IF
immunofluorescence
- NB
neuroblast
- NEB
nuclear envelope breakdown
- PH3
phosphorylated histone H3
- UAS
upstream activation sequence.
Footnotes
This article was published online ahead of print in MBoC in Press (http://www.molbiolcell.org/cgi/doi/10.1091/mbc.E17-05-0294) on December 27, 2017.
REFERENCES
- Albertson R, Chabu C, Sheehan A, Doe CQ. Scribble protein domain mapping reveals a multistep localization mechanism and domains necessary for establishing cortical polarity. J Cell Sci. 2004:6061–6070. doi: 10.1242/jcs.01525. [DOI] [PubMed] [Google Scholar]
- Albertson R, Doe CQ. Dlg, Scrib and Lgl regulate neuroblast cell size and mitotic spindle asymmetry. Nat Cell Biol. 2003:166–170. doi: 10.1038/ncb922. [DOI] [PubMed] [Google Scholar]
- Algrain M, Turunen O, Vaheri A, Louvard D, Arpin M. Ezrin contains cytoskeleton and membrane binding domains accounting for its proposed role as a membrane-cytoskeletal linker. J Cell Biol. 1993:129–139. doi: 10.1083/jcb.120.1.129. [DOI] [PMC free article] [PubMed] [Google Scholar]
- Atwood SX, Chabu C, Penkert RR, Doe CQ, Prehoda KE. Cdc42 acts downstream of Bazooka to regulate neuroblast polarity through Par-6 aPKC. J Cell Sci. 2007:3200–3206. doi: 10.1242/jcs.014902. [DOI] [PMC free article] [PubMed] [Google Scholar]
- Bardet PL, Guirao B, Paoletti C, Serman F, Leopold V, Bosveld F, Goya Y, Mirouse V, Graner F, Bellaiche Y. PTEN controls junction lengthening and stability during cell rearrangement in epithelial tissue. Dev Cell. 2013:534–546. doi: 10.1016/j.devcel.2013.04.020. [DOI] [PubMed] [Google Scholar]
- Barros CS, Phelps CB, Brand AH. Drosophila nonmuscle myosin II promotes the asymmetric segregation of cell fate determinants by cortical exclusion rather than active transport. Dev Cell. 2003:829–840. doi: 10.1016/s1534-5807(03)00359-9. [DOI] [PubMed] [Google Scholar]
- Berryman M, Franck Z, Bretscher A. Ezrin is concentrated in the apical microvilli of a wide variety of epithelial cells whereas moesin is found primarily in endothelial cells. J Cell Sci. 1993;(Pt 4):1025–1043. doi: 10.1242/jcs.105.4.1025. [DOI] [PubMed] [Google Scholar]
- Betschinger J, Mechtler K, Knoblich JA. The Par complex directs asymmetric cell division by phosphorylating the cytoskeletal protein Lgl. Nature. 2003:326–330. doi: 10.1038/nature01486. [DOI] [PubMed] [Google Scholar]
- Bier E, Vaessin H, Younger-Shepherd S, Jan LY, Jan YN. deadpan, an essential pan-neural gene in Drosophila, encodes a helix-loop-helix protein similar to the hairy gene product. Genes Dev. 1992:2137–2151. doi: 10.1101/gad.6.11.2137. [DOI] [PubMed] [Google Scholar]
- Bowman SK, Neumuller RA, Novatchkova M, Du Q, Knoblich JA. The Drosophila NuMA homolog mud regulates spindle orientation in asymmetric cell division. Dev Cell. 2006:731–742. doi: 10.1016/j.devcel.2006.05.005. [DOI] [PubMed] [Google Scholar]
- Brand AH, Perrimon N. Targeted gene expression as a means of altering cell fates and generating dominant phenotypes. Development. 1993:401–415. doi: 10.1242/dev.118.2.401. [DOI] [PubMed] [Google Scholar]
- Britton JS, Edgar BA. Environmental control of the cell cycle in Drosophila: nutrition activates mitotic and endoreplicative cells by distinct mechanisms. Development. 1998:2149–2158. doi: 10.1242/dev.125.11.2149. [DOI] [PubMed] [Google Scholar]
- Broadus J, Doe CQ. Extrinsic cues, intrinsic cues and microfilaments regulate asymmetric protein localization in Drosophila neuroblasts. Curr Biol. 1997:827–835. doi: 10.1016/s0960-9822(06)00370-8. [DOI] [PubMed] [Google Scholar]
- Cabernard C, Prehoda KE, Doe CQ. A spindle-independent cleavage furrow positioning pathway. Nature. 2010:91–94. doi: 10.1038/nature09334. [DOI] [PMC free article] [PubMed] [Google Scholar]
- Cai Y, Yu F, Lin S, Chia W, Yang X. Apical complex genes control mitotic spindle geometry and relative size of daughter cells in Drosophila neuroblast and pI asymmetric divisions. Cell. 2003:51–62. doi: 10.1016/s0092-8674(02)01170-4. [DOI] [PubMed] [Google Scholar]
- Carreno S, Kouranti I, Glusman ES, Fuller MT, Echard A, Payre F. Moesin and its activating kinase Slik are required for cortical stability and microtubule organization in mitotic cells. J Cell Biol. 2008:739–746. doi: 10.1083/jcb.200709161. [DOI] [PMC free article] [PubMed] [Google Scholar]
- Chell JM, Brand AH. Nutrition-responsive glia control exit of neural stem cells from quiescence. Cell. 2010:1161–1173. doi: 10.1016/j.cell.2010.12.007. [DOI] [PMC free article] [PubMed] [Google Scholar]
- Cheng J, Tiyaboonchai A, Yamashita YM, Hunt AJ. Asymmetric division of cyst stem cells in Drosophila testis is ensured by anaphase spindle repositioning. Development. 2011:831–837. doi: 10.1242/dev.057901. [DOI] [PMC free article] [PubMed] [Google Scholar]
- Chenn A, McConnell SK. Cleavage orientation and the asymmetric inheritance of Notch1 immunoreactivity in mammalian neurogenesis. Cell. 1995:631–641. doi: 10.1016/0092-8674(95)90035-7. [DOI] [PubMed] [Google Scholar]
- Connell M, Cabernard C, Ricketson D, Doe CQ, Prehoda KE. Asymmetric cortical extension shifts cleavage furrow position in Drosophila neuroblasts. Mol Biol Cell. 2011:4220–4226. doi: 10.1091/mbc.E11-02-0173. [DOI] [PMC free article] [PubMed] [Google Scholar]
- Ding R, Weynans K, Bossing T, Barros CS, Berger C. The Hippo signalling pathway maintains quiescence in Drosophila neural stem cells. Nat Commun. 2016:10510. doi: 10.1038/ncomms10510. [DOI] [PMC free article] [PubMed] [Google Scholar]
- Doe CQ, Chu-LaGraff Q, Wright DM, Scott MP. The prospero gene specifies cell fates in the Drosophila central nervous system. Cell. 1991:451–464. doi: 10.1016/0092-8674(91)90463-9. [DOI] [PubMed] [Google Scholar]
- Doi Y, Itoh M, Yonemura S, Ishihara S, Takano H, Noda T, Tsukita S. Normal development of mice and unimpaired cell adhesion/cell motility/actin-based cytoskeleton without compensatory up-regulation of ezrin or radixin in moesin gene knockout. J Biol Chem. 1999:2315–2321. doi: 10.1074/jbc.274.4.2315. [DOI] [PubMed] [Google Scholar]
- Franck Z, Gary R, Bretscher A. Moesin, like ezrin, colocalizes with actin in the cortical cytoskeleton in cultured cells, but its expression is more variable. J Cell Sci. 1993;(Pt 1):219–231. doi: 10.1242/jcs.105.1.219. [DOI] [PubMed] [Google Scholar]
- Fuse N, Hisata K, Katzen AL, Matsuzaki F. Heterotrimeric G proteins regulate daughter cell size asymmetry in Drosophila neuroblast divisions. Curr Biol. 2003:947–954. doi: 10.1016/s0960-9822(03)00334-8. [DOI] [PubMed] [Google Scholar]
- Gary R, Bretscher A. Heterotypic and homotypic associations between ezrin and moesin, two putative membrane-cytoskeletal linking proteins. Proc Natl Acad Sci USA. 1993:10846–10850. doi: 10.1073/pnas.90.22.10846. [DOI] [PMC free article] [PubMed] [Google Scholar]
- Gary R, Bretscher A. Ezrin self-association involves binding of an N-terminal domain to a normally masked C-terminal domain that includes the F-actin binding site. Mol Biol Cell. 1995:1061–1075. doi: 10.1091/mbc.6.8.1061. [DOI] [PMC free article] [PubMed] [Google Scholar]
- Gobel V, Barrett PL, Hall DH, Fleming JT. Lumen morphogenesis in C. elegans requires the membrane-cytoskeleton linker erm-1. Dev Cell. 2004:865–873. doi: 10.1016/j.devcel.2004.05.018. [DOI] [PubMed] [Google Scholar]
- Green P, Hartenstein AY, Hartenstein V. The embryonic development of the Drosophila visual system. Cell Tissue Res. 1993:583–598. doi: 10.1007/BF00333712. [DOI] [PubMed] [Google Scholar]
- Hayashi K, Yonemura S, Matsui T, Tsukita S. Immunofluorescence detection of ezrin/radixin/moesin (ERM) proteins with their carboxyl-terminal threonine phosphorylated in cultured cells and tissues. J Cell Sci. 1999;(Pt 8):1149–1158. doi: 10.1242/jcs.112.8.1149. [DOI] [PubMed] [Google Scholar]
- Hebert AM, DuBoff B, Casaletto JB, Gladden AB, McClatchey AI. Merlin/ERM proteins establish cortical asymmetry and centrosome position. Genes Dev. 2012:2709–2723. doi: 10.1101/gad.194027.112. [DOI] [PMC free article] [PubMed] [Google Scholar]
- Hipfner DR, Cohen SM. The Drosophila sterile-20 kinase slik controls cell proliferation and apoptosis during imaginal disc development. PLoS Biol. 2003:E35. doi: 10.1371/journal.pbio.0000035. [DOI] [PMC free article] [PubMed] [Google Scholar]
- Hipfner DR, Keller N, Cohen SM. Slik Sterile-20 kinase regulates Moesin activity to promote epithelial integrity during tissue growth. Genes Dev. 2004:2243–2248. doi: 10.1101/gad.303304. [DOI] [PMC free article] [PubMed] [Google Scholar]
- Hirao M, Sato N, Kondo T, Yonemura S, Monden M, Sasaki T, Takai Y, Tsukita S, Tsukita S. Regulation mechanism of ERM (ezrin/radixin/moesin) protein/plasma membrane association: possible involvement of phosphatidylinositol turnover and Rho-dependent signaling pathway. J Cell Biol. 1996:37–51. doi: 10.1083/jcb.135.1.37. [DOI] [PMC free article] [PubMed] [Google Scholar]
- Hirata J, Nakagoshi H, Nabeshima Y, Matsuzaki F. Asymmetric segregation of the homeodomain protein Prospero during Drosophila development. Nature. 1995:627–630. doi: 10.1038/377627a0. [DOI] [PubMed] [Google Scholar]
- Hughes SC, Fehon RG. Phosphorylation and activity of the tumor suppressor Merlin and the ERM protein Moesin are coordinately regulated by the Slik kinase. J Cell Biol. 2006:305–313. doi: 10.1083/jcb.200608009. [DOI] [PMC free article] [PubMed] [Google Scholar]
- Ikeshima-Kataoka H, Skeath JB, Nabeshima Y, Doe CQ, Matsuzaki F. Miranda directs Prospero to a daughter cell during Drosophila asymmetric divisions. Nature. 1997:625–629. doi: 10.1038/37641. [DOI] [PubMed] [Google Scholar]
- Ito K, Hotta Y. Proliferation pattern of postembryonic neuroblasts in the brain of Drosophila melanogaster. Dev Biol. 1992:134–148. doi: 10.1016/0012-1606(92)90270-q. [DOI] [PubMed] [Google Scholar]
- Izumi Y, Ohta N, Itoh-Furuya A, Fuse N, Matsuzaki F. Differential functions of G protein and Baz-aPKC signaling pathways in Drosophila neuroblast asymmetric division. J Cell Biol. 2004:729–738. doi: 10.1083/jcb.200309162. [DOI] [PMC free article] [PubMed] [Google Scholar]
- Jiang Y, Reichert H. Drosophila neural stem cells in brain development and tumor formation. J Neurogenet. 2014:181–189. doi: 10.3109/01677063.2014.898639. [DOI] [PubMed] [Google Scholar]
- Kaltschmidt JA, Davidson CM, Brown NH, Brand AH. Rotation and asymmetry of the mitotic spindle direct asymmetric cell division in the developing central nervous system. Nat Cell Biol. 2000:7–12. doi: 10.1038/71323. [DOI] [PubMed] [Google Scholar]
- Karagiosis SA, Ready DF. Moesin contributes an essential structural role in Drosophila photoreceptor morphogenesis. Development. 2004:725–732. doi: 10.1242/dev.00976. [DOI] [PubMed] [Google Scholar]
- Knoblich JA, Jan LY, Jan YN. Asymmetric segregation of Numb and Prospero during cell division. Nature. 1995:624–627. doi: 10.1038/377624a0. [DOI] [PubMed] [Google Scholar]
- Knoblich JA, Jan LY, Jan YN. The N terminus of the Drosophila Numb protein directs membrane association and actin-dependent asymmetric localization. Proc Natl Acad Sci USA. 1997:13005–13010. doi: 10.1073/pnas.94.24.13005. [DOI] [PMC free article] [PubMed] [Google Scholar]
- Kraut R, Campos-Ortega JA. inscuteable, a neural precursor gene of Drosophila, encodes a candidate for a cytoskeleton adaptor protein. Dev Biol. 1996:65–81. doi: 10.1006/dbio.1996.0052. [DOI] [PubMed] [Google Scholar]
- Kraut R, Chia W, Jan LY, Jan YN, Knoblich JA. Role of inscuteable in orienting asymmetric cell divisions in Drosophila. Nature. 1996:50–55. doi: 10.1038/383050a0. [DOI] [PubMed] [Google Scholar]
- Kunda P, Pelling AE, Liu T, Baum B. Moesin controls cortical rigidity, cell rounding, and spindle morphogenesis during mitosis. Curr Biol. 2008:91–101. doi: 10.1016/j.cub.2007.12.051. [DOI] [PubMed] [Google Scholar]
- Kunda P, Rodrigues NT, Moeendarbary E, Liu T, Ivetic A, Charras G, Baum B. PP1-mediated moesin dephosphorylation couples polar relaxation to mitotic exit. Curr Biol. 2012:231–236. doi: 10.1016/j.cub.2011.12.016. [DOI] [PubMed] [Google Scholar]
- Lee CY, Robinson KJ, Doe CQ. Lgl, Pins and aPKC regulate neuroblast self-renewal versus differentiation. Nature. 2006:594–598. doi: 10.1038/nature04299. [DOI] [PubMed] [Google Scholar]
- Lerit DA, Plevock KM, Rusan NM. Live imaging of Drosophila larval neuroblasts. J Vis Exp. 2014:51756. doi: 10.3791/51756. [DOI] [PMC free article] [PubMed] [Google Scholar]
- Li P, Yang X, Wasser M, Cai Y, Chia W. Inscuteable and Staufen mediate asymmetric localization and segregation of prospero RNA during Drosophila neuroblast cell divisions. Cell. 1997:437–447. doi: 10.1016/s0092-8674(00)80504-8. [DOI] [PubMed] [Google Scholar]
- Li S, Wang H, Groth C. Drosophila neuroblasts as a new model for the study of stem cell self-renewal and tumour formation. Biosci Rep. 2014:e00125. doi: 10.1042/BSR20140008. [DOI] [PMC free article] [PubMed] [Google Scholar]
- Louvet S, Aghion J, Santa-Maria A, Mangeat P, Maro B. Ezrin becomes restricted to outer cells following asymmetrical division in the preimplantation mouse embryo. Dev Biol. 1996:568–579. doi: 10.1006/dbio.1996.0186. [DOI] [PubMed] [Google Scholar]
- Lu B, Ackerman L, Jan LY, Jan YN. Modes of protein movement that lead to the asymmetric localization of partner of Numb during Drosophila neuroblast division. Mol Cell. 1999:883–891. doi: 10.1016/s1097-2765(00)80218-x. [DOI] [PubMed] [Google Scholar]
- Lu B, Rothenberg M, Jan LY, Jan YN. Partner of Numb colocalizes with Numb during mitosis and directs Numb asymmetric localization in Drosophila neural and muscle progenitors. Cell. 1998:225–235. doi: 10.1016/s0092-8674(00)81753-5. [DOI] [PubMed] [Google Scholar]
- Luxenburg C, Pasolli HA, Williams SE, Fuchs E. Developmental roles for Srf, cortical cytoskeleton and cell shape in epidermal spindle orientation. Nat Cell Biol. 2011:203–214. doi: 10.1038/ncb2163. [DOI] [PMC free article] [PubMed] [Google Scholar]
- Machicoane M, de Frutos CA, Fink J, Rocancourt M, Lombardi Y, Garel S, Piel M, Echard A. SLK-dependent activation of ERMs controls LGN-NuMA localization and spindle orientation. J Cell Biol. 2014:791–799. doi: 10.1083/jcb.201401049. [DOI] [PMC free article] [PubMed] [Google Scholar]
- Matsui T, Maeda M, Doi Y, Yonemura S, Amano M, Kaibuchi K, Tsukita S, Tsukita S. Rho-kinase phosphorylates COOH-terminal threonines of ezrin/radixin/moesin (ERM) proteins and regulates their head-to-tail association. J Cell Biol. 1998:647–657. doi: 10.1083/jcb.140.3.647. [DOI] [PMC free article] [PubMed] [Google Scholar]
- Matsuzaki F, Koizumi K, Hama C, Yoshioka T, Nabeshima Y. Cloning of the Drosophila prospero gene and its expression in ganglion mother cells. Biochem Biophys Res Commun. 1992:1326–1332. doi: 10.1016/0006-291x(92)91878-t. [DOI] [PubMed] [Google Scholar]
- McCartney BM, Fehon RG. Distinct cellular and subcellular patterns of expression imply distinct functions for the Drosophila homologues of moesin and the neurofibromatosis 2 tumor suppressor, merlin. J Cell Biol. 1996:843–852. doi: 10.1083/jcb.133.4.843. [DOI] [PMC free article] [PubMed] [Google Scholar]
- Molnar C, de Celis JF. Independent roles of Drosophila Moesin in imaginal disc morphogenesis and hedgehog signalling. Mech Dev. 2006:337–351. doi: 10.1016/j.mod.2006.02.001. [DOI] [PubMed] [Google Scholar]
- Nakajima Y, Meyer EJ, Kroesen A, McKinney SA, Gibson MC. Epithelial junctions maintain tissue architecture by directing planar spindle orientation. Nature. 2013:359–362. doi: 10.1038/nature12335. [DOI] [PubMed] [Google Scholar]
- Nakamura F, Amieva MR, Furthmayr H. Phosphorylation of threonine 558 in the carboxyl-terminal actin-binding domain of moesin by thrombin activation of human platelets. J Biol Chem. 1995:31377–31385. doi: 10.1074/jbc.270.52.31377. [DOI] [PubMed] [Google Scholar]
- Nakamura F, Huang L, Pestonjamasp K, Luna EJ, Furthmayr H. Regulation of F-actin binding to platelet moesin in vitro by both phosphorylation of threonine 558 and polyphosphatidylinositides. Mol Biol Cell. 1999:2669–2685. doi: 10.1091/mbc.10.8.2669. [DOI] [PMC free article] [PubMed] [Google Scholar]
- Nguyen R, Reczek D, Bretscher A. Hierarchy of merlin and ezrin N- and C-terminal domain interactions in homo- and heterotypic associations and their relationship to binding of scaffolding proteins EBP50 and E3KARP. J Biol Chem. 2001:7621–7629. doi: 10.1074/jbc.M006708200. [DOI] [PubMed] [Google Scholar]
- Nipper RW, Siller KH, Smith NR, Doe CQ, Prehoda KE. Galphai generates multiple Pins activation states to link cortical polarity and spindle orientation in Drosophila neuroblasts. Proc Natl Acad Sci USA. 2007:14306–14311. doi: 10.1073/pnas.0701812104. [DOI] [PMC free article] [PubMed] [Google Scholar]
- Ohshiro T, Yagami T, Zhang C, Matsuzaki F. Role of cortical tumour-suppressor proteins in asymmetric division of Drosophila neuroblast. Nature. 2000:593–596. doi: 10.1038/35046087. [DOI] [PubMed] [Google Scholar]
- Oshiro N, Fukata Y, Kaibuchi K. Phosphorylation of moesin by rho-associated kinase (Rho-kinase) plays a crucial role in the formation of microvilli-like structures. J Biol Chem. 1998:34663–34666. doi: 10.1074/jbc.273.52.34663. [DOI] [PubMed] [Google Scholar]
- Panneton V, Nath A, Sader F, Delaunay N, Pelletier A, Maier D, Oh K, Hipfner DR. Regulation of catalytic and non-catalytic functions of the Drosophila Ste20 kinase Slik by activation segment phosphorylation. J Biol Chem. 2015:20960–20971. doi: 10.1074/jbc.M115.645952. [DOI] [PMC free article] [PubMed] [Google Scholar]
- Parmentier ML, Woods D, Greig S, Phan PG, Radovic A, Bryant P, O’Kane CJ. Rapsynoid/partner of inscuteable controls asymmetric division of larval neuroblasts in Drosophila. J Neurosci. 2000:RC84. doi: 10.1523/JNEUROSCI.20-14-j0003.2000. [DOI] [PMC free article] [PubMed] [Google Scholar]
- Peng CY, Manning L, Albertson R, Doe CQ. The tumour-suppressor genes lgl and dlg regulate basal protein targeting in Drosophila neuroblasts. Nature. 2000:596–600. doi: 10.1038/35046094. [DOI] [PubMed] [Google Scholar]
- Peterson C, Carney GE, Taylor BJ, White K. reaper is required for neuroblast apoptosis during Drosophila development. Development. 2002:1467–1476. doi: 10.1242/dev.129.6.1467. [DOI] [PubMed] [Google Scholar]
- Petritsch C, Tavosanis G, Turck CW, Jan LY, Jan YN. The Drosophila myosin VI Jaguar is required for basal protein targeting and correct spindle orientation in mitotic neuroblasts. Dev Cell. 2003:273–281. doi: 10.1016/s1534-5807(03)00020-0. [DOI] [PubMed] [Google Scholar]
- Petronczki M, Knoblich JA. DmPAR-6 directs epithelial polarity and asymmetric cell division of neuroblasts in Drosophila. Nat Cell Biol. 2001:43–49. doi: 10.1038/35050550. [DOI] [PubMed] [Google Scholar]
- Pilot F, Philippe JM, Lemmers C, Lecuit T. Spatial control of actin organization at adherens junctions by a synaptotagmin-like protein Btsz. Nature. 2006:580–584. doi: 10.1038/nature04935. [DOI] [PubMed] [Google Scholar]
- Poon CL, Mitchell KA, Kondo S, Cheng LY, Harvey KF. The Hippo pathway regulates neuroblasts and brain size in Drosophila melanogaster. Curr Biol. 2016:1034–1042. doi: 10.1016/j.cub.2016.02.009. [DOI] [PubMed] [Google Scholar]
- Prokop A, Bray S, Harrison E, Technau GM. Homeotic regulation of segment-specific differences in neuroblast numbers and proliferation in the Drosophila central nervous system. Mech Dev. 1998:99–110. doi: 10.1016/s0925-4773(98)00068-9. [DOI] [PubMed] [Google Scholar]
- Prokop A, Technau GM. The origin of postembryonic neuroblasts in the ventral nerve cord of Drosophila melanogaster. Development. 1991:79–88. doi: 10.1242/dev.111.1.79. [DOI] [PubMed] [Google Scholar]
- Riedl J, Crevenna AH, Kessenbrock K, Yu JH, Neukirchen D, Bista M, Bradke F, Jenne D, Holak TA, Werb Z, et al. Lifeact: a versatile marker to visualize F-actin Nat Methods 2008. 605 607 [DOI] [PMC free article] [PubMed] [Google Scholar]
- Rolls MM, Albertson R, Shih HP, Lee CY, Doe CQ. Drosophila aPKC regulates cell polarity and cell proliferation in neuroblasts and epithelia. J Cell Biol. 2003:1089–1098. doi: 10.1083/jcb.200306079. [DOI] [PMC free article] [PubMed] [Google Scholar]
- Roubinet C, Decelle B, Chicanne G, Dorn JF, Payrastre B, Payre F, Carreno S. Molecular networks linked by Moesin drive remodeling of the cell cortex during mitosis. J Cell Biol. 2011:99–112. doi: 10.1083/jcb.201106048. [DOI] [PMC free article] [PubMed] [Google Scholar]
- Roubinet C, Tsankova A, Pham TT, Monnard A, Caussinus E, Affolter M, Cabernard C. Spatio-temporally separated cortical flows and spindle geometry establish physical asymmetry in fly neural stem cells. Nat Commun. 2017:1383. doi: 10.1038/s41467-017-01391-w. [DOI] [PMC free article] [PubMed] [Google Scholar]
- Rusan NM, Peifer M. A role for a novel centrosome cycle in asymmetric cell division. J Cell Biol. 2007:13–20. doi: 10.1083/jcb.200612140. [DOI] [PMC free article] [PubMed] [Google Scholar]
- Sabino D, Gogendeau D, Gambarotto D, Nano M, Pennetier C, Dingli F, Arras G, Loew D, Basto R. Moesin is a major regulator of centrosome behavior in epithelial cells with extra centrosomes. Curr Biol. 2015:879–889. doi: 10.1016/j.cub.2015.01.066. [DOI] [PMC free article] [PubMed] [Google Scholar]
- Saotome I, Curto M, McClatchey AI. Ezrin is essential for epithelial organization and villus morphogenesis in the developing intestine. Dev Cell. 2004:855–864. doi: 10.1016/j.devcel.2004.05.007. [DOI] [PubMed] [Google Scholar]
- Sato N, Funayama N, Nagafuchi A, Yonemura S, Tsukita S, Tsukita S. A gene family consisting of ezrin, radixin and moesin. Its specific localization at actin filament/plasma membrane association sites. J Cell Sci. 1992;(Pt 1):131–143. doi: 10.1242/jcs.103.1.131. [DOI] [PubMed] [Google Scholar]
- Sato N, Yonemura S, Obinata T, Tsukita S, Tsukita S. Radixin, a barbed end-capping actin-modulating protein, is concentrated at the cleavage furrow during cytokinesis. J Cell Biol. 1991:321–330. doi: 10.1083/jcb.113.2.321. [DOI] [PMC free article] [PubMed] [Google Scholar]
- Schaefer M, Petronczki M, Dorner D, Forte M, Knoblich JA. Heterotrimeric G proteins direct two modes of asymmetric cell division in the Drosophila nervous system. Cell. 2001:183–194. doi: 10.1016/s0092-8674(01)00521-9. [DOI] [PubMed] [Google Scholar]
- Schaefer M, Shevchenko A, Shevchenko A, Knoblich JA. A protein complex containing Inscuteable and the Galpha-binding protein Pins orients asymmetric cell divisions in Drosophila. Curr Biol. 2000:353–362. doi: 10.1016/s0960-9822(00)00401-2. [DOI] [PubMed] [Google Scholar]
- Schober M, Schaefer M, Knoblich JA. Bazooka recruits Inscuteable to orient asymmetric cell divisions in Drosophila neuroblasts. Nature. 1999:548–551. doi: 10.1038/990135. [DOI] [PubMed] [Google Scholar]
- Schwarz S, Durisko Z, Dukas R. Food selection in larval fruit flies: dynamics and effects on larval development. Naturwissenschaften. 2014:61–68. doi: 10.1007/s00114-013-1129-z. [DOI] [PubMed] [Google Scholar]
- Shen CP, Jan LY, Jan YN. Miranda is required for the asymmetric localization of Prospero during mitosis in Drosophila. Cell. 1997:449–458. doi: 10.1016/s0092-8674(00)80505-x. [DOI] [PubMed] [Google Scholar]
- Shen CP, Knoblich JA, Chan YM, Jiang MM, Jan LY, Jan YN. Miranda as a multidomain adapter linking apically localized Inscuteable and basally localized Staufen and Prospero during asymmetric cell division in Drosophila. Genes Dev. 1998:1837–1846. doi: 10.1101/gad.12.12.1837. [DOI] [PMC free article] [PubMed] [Google Scholar]
- Siegrist SE, Doe CQ. Microtubule-induced Pins/Galphai cortical polarity in Drosophila neuroblasts. Cell. 2005:1323–1335. doi: 10.1016/j.cell.2005.09.043. [DOI] [PubMed] [Google Scholar]
- Siegrist SE, Doe CQ. Extrinsic cues orient the cell division axis in Drosophila embryonic neuroblasts. Development. 2006:529–536. doi: 10.1242/dev.02211. [DOI] [PubMed] [Google Scholar]
- Solinet S, Mahmud K, Stewman SF, Ben El Kadhi K, Decelle B, Talje L, Ma A, Kwok BH, Carreno S. The actin-binding ERM protein Moesin binds to and stabilizes microtubules at the cell cortex. J Cell Biol. 2013:251–260. doi: 10.1083/jcb.201304052. [DOI] [PMC free article] [PubMed] [Google Scholar]
- Sousa-Nunes R, Yee LL, Gould AP. Fat cells reactivate quiescent neuroblasts via TOR and glial insulin relays in Drosophila. Nature. 2011:508–512. doi: 10.1038/nature09867. [DOI] [PMC free article] [PubMed] [Google Scholar]
- Spana EP, Doe CQ. The prospero transcription factor is asymmetrically localized to the cell cortex during neuroblast mitosis in Drosophila. Development. 1995:3187–3195. doi: 10.1242/dev.121.10.3187. [DOI] [PubMed] [Google Scholar]
- Speck O, Hughes SC, Noren NK, Kulikauskas RM, Fehon RG. Moesin functions antagonistically to the Rho pathway to maintain epithelial integrity. Nature. 2003:83–87. doi: 10.1038/nature01295. [DOI] [PubMed] [Google Scholar]
- Thery M, Racine V, Pepin A, Piel M, Chen Y, Sibarita JB, Bornens M. The extracellular matrix guides the orientation of the cell division axis. Nat Cell Biol. 2005:947–953. doi: 10.1038/ncb1307. [DOI] [PubMed] [Google Scholar]
- Tio M, Zavortink M, Yang X, Chia W. A functional analysis of inscuteable and its roles during Drosophila asymmetric cell divisions. J Cell Sci. 1999;(Pt 10):1541–1551. doi: 10.1242/jcs.112.10.1541. [DOI] [PubMed] [Google Scholar]
- Tran Quang C, Gautreau A, Arpin M, Treisman R. Ezrin function is required for ROCK-mediated fibroblast transformation by the Net and Dbl oncogenes. EMBO J. 2000:4565–4576. doi: 10.1093/emboj/19.17.4565. [DOI] [PMC free article] [PubMed] [Google Scholar]
- Truman JW, Bate M. Spatial and temporal patterns of neurogenesis in the central nervous system of Drosophila melanogaster. Dev Biol. 1988:145–157. doi: 10.1016/0012-1606(88)90067-x. [DOI] [PubMed] [Google Scholar]
- Tsankova A, Pham TT, Garcia DS, Otte F, Cabernard C. Cell polarity regulates biased Myosin activity and dynamics during asymmetric cell division via Drosophila Rho kinase and protein kinase N. Dev Cell. 2017:143–155 e145. doi: 10.1016/j.devcel.2017.06.012. [DOI] [PubMed] [Google Scholar]
- Turunen O, Wahlstrom T, Vaheri A. Ezrin has a COOH-terminal actin-binding site that is conserved in the ezrin protein family. J Cell Biol. 1994:1445–1453. doi: 10.1083/jcb.126.6.1445. [DOI] [PMC free article] [PubMed] [Google Scholar]
- Van Furden D, Johnson K, Segbert C, Bossinger O. The C. elegans ezrin-radixin-moesin protein ERM-1 is necessary for apical junction remodelling and tubulogenesis in the intestine. Dev Biol. 2004:262–276. doi: 10.1016/j.ydbio.2004.05.012. [DOI] [PubMed] [Google Scholar]
- Verboon JM, Parkhurst SM. Rho family GTPases bring a familiar ring to cell wound repair. Small GTPases. 2015:1–7. doi: 10.4161/21541248.2014.992262. [DOI] [PMC free article] [PubMed] [Google Scholar]
- White K, Grether ME, Abrams JM, Young L, Farrell K, Steller H. Genetic control of programmed cell death in Drosophila. Science. 1994:677–683. doi: 10.1126/science.8171319. [DOI] [PubMed] [Google Scholar]
- Wodarz A, Ramrath A, Grimm A, Knust E. Drosophila atypical protein kinase C associates with Bazooka and controls polarity of epithelia and neuroblasts. J Cell Biol. 2000:1361–1374. doi: 10.1083/jcb.150.6.1361. [DOI] [PMC free article] [PubMed] [Google Scholar]
- Wodarz A, Ramrath A, Kuchinke U, Knust E. Bazooka provides an apical cue for Inscuteable localization in Drosophila neuroblasts. Nature. 1999:544–547. doi: 10.1038/990128. [DOI] [PubMed] [Google Scholar]
- Younossi-Hartenstein A, Nassif C, Green P, Hartenstein V. Early neurogenesis of the Drosophila brain. J Comp Neurol. 1996:313–329. doi: 10.1002/(SICI)1096-9861(19960701)370:3<313::AID-CNE3>3.0.CO;2-7. [DOI] [PubMed] [Google Scholar]
- Yu F, Cai Y, Kaushik R, Yang X, Chia W. Distinct roles of Galphai and Gbeta13F subunits of the heterotrimeric G protein complex in the mediation of Drosophila neuroblast asymmetric divisions. J Cell Biol. 2003:623–633. doi: 10.1083/jcb.200303174. [DOI] [PMC free article] [PubMed] [Google Scholar]
- Yu F, Morin X, Cai Y, Yang X, Chia W. Analysis of partner of inscuteable, a novel player of Drosophila asymmetric divisions, reveals two distinct steps in inscuteable apical localization. Cell. 2000:399–409. doi: 10.1016/s0092-8674(00)80676-5. [DOI] [PubMed] [Google Scholar]
- Zhu S, Lin S, Kao CF, Awasaki T, Chiang AS, Lee T. Gradients of the Drosophila Chinmo BTB-zinc finger protein govern neuronal temporal identity. Cell. 2006:409–422. doi: 10.1016/j.cell.2006.08.045. [DOI] [PubMed] [Google Scholar]
Associated Data
This section collects any data citations, data availability statements, or supplementary materials included in this article.