Abstract
Apoptosis is a tightly programmed cell suicide which occurs in multiple physiologic and pathological conditions where it plays an important role in tissue development and homeostasis by eliminating unwanted and damaged cells. Appropriate apoptosis signalling is crucial in maintaining the fine balance between cell death and cell survival in cancer. In response to death stimuli the morphology of the cell undergoes unique changes. The aim of this study was to examine and compare the changes in the cell surface morphology using scanning electron microscopy in HCS-2 cells, following 24 hour treatment with components of highly active antiretroviral therapy (HAART) at their clinical plasma concentrations. The cells were fixed in 2.5% Glutaraldehyde and post-fixed in 1% osmium tetroxide. The cells were then dehydrated through a graded series of alcohol and treated with hexamethyl-disilazane, then coated with a double layer of carbon. The cells were viewed under a Zeiss Ultra FEG Scanning Electron Microscope and a one way ANOVA and Tukey Kramer Post Hoc test was conducted based on the scoring of surface morphology of the cells using JMP 11 statistical software. The drugs used in this study induced morphological features which are known to be characteristic of apoptotic cell death. The drug combinations (ATP and LPV/r) were seemingly more effective than individual treatments in inducing cell death because morphological features observed were more advanced than those observed in individual treatments. However, LPV/r was more potent than ATP. In conclusion, HAART showed anticancer properties by inducing cell death through apoptosis.
Keywords: Apoptosis, cell morphology, HAART
1. Introduction
Apoptosis is a tightly programmed cell suicide which occurs in multiple physiologic and pathological conditions where it plays an important role in tissue development and homeostasis by eliminating unwanted and damaged cells [1,2,3]. During apoptosis harmful cells, especially those that have been genetically altered, are removed, therefore this process maintains the integrity of the organism [3].
Cancer is a disease which disturbs tissue growth and it is caused by mutations that favour cell proliferation over cell death [4,5]. Evasion of apoptosis is the most important hallmark of cancer because appropriate apoptosis signalling is crucial in maintaining the fine balance between cell death and cell survival [3]. Tumour development requires defects in the cell cycle which will promote uncontrolled proliferation [3]. On the other hand, cell proliferation is tightly controlled and has mechanisms that serve to detect abnormal proliferation by activating signalling pathways that induce senescence or apoptosis [3].
In order to overcome the protective apoptotic signalling response, cancer cells have both proliferation-stimulating mutations and defects in the apoptotic pathway which work together to deregulate apoptosis [3]. Alternatively cancer cells cause the signalling of aberrantly activated survival pathways as a means to evade apoptosis [3]. Overall, the inhibition of apoptotic signalling provides enhanced survival capacity to cancer cells and is responsible for their characteristic uncontrolled proliferation; consequently it has resulted in the development of many anti-neoplastic agents which target inducing apoptosis [3].
In response to death stimuli the morphology of the cell begins to change, and these changes are unique depending on the type of cell death induced [6]. Scanning Electron Microscopy (SEM) has played an important role to date in contributing to the identification of a variety of cell death mechanisms, including necrosis, apoptosis, autophagy, oncosis and mitotic catastrophe, which are induced by disease or noxious stimuli (such as heat, radiation, hypoxia, or cytotoxic drugs) [7].
The course of cell death through apoptosis is orderly and it involves a series of characteristic morphological features including cell shrinkage, membrane blebbing, nuclear fragmentation and chromatin condensation [2,4,8]. Apoptotic cells detach from their substratum in order to acquire a rounded morphology and surface microvilli and cell junctions, for example, desmosomes, are also lost due to the reorganisation of cytoskeletal structures [2,7,8].
The aim of this study was to examine and compare the changes in the cell surface morphology in HCS-2 cells using scanning electron microscopy (SEM) following treatment with components of highly active antiretroviral therapy (HAART). HAART consists of drugs classified as Nucleo-side/Nucleotide Reverse Transcriptase Inhibitors (NRTI), Non-Nucleoside Reverse Transcriptase Inhibitors (NNRTI) and Protease Inhibitors (PI) and they are mainly used in the treatment of HIV [9,10].
2. Materials and methods
2.1. Cell culture
Human Squamous Cell carcinoma from Uterine Cervix, HCS-2 cell line was purchased from the Japanese Collection of Research Bioresources (JCRB) cell bank (National Institute of Health Sciences, Tokyo, Japan). The cells were routinely grown as a monolayer in Nunc tissue culture grade flasks of 25 cm2 or 50 cm2 (Thermo Scientific, Pittsburgh, PA, USA). The cells were maintained in a humidified environment of 5% CO2 at a temperature of 37°C in Eagle's Minimal Essential Medium (EMEM) (Lonza, Basel, Switzerland) supplemented with 15% foetal calf serum (GIBCO, Darmstadt, Germany). The cells were incubated for approximately 2 days or until they reached ~ 60-80% confluency and were then harvested with 0.1% trypsin and 0.02% EDTA and seeded onto coverslips at a cell density of 1×10⁵ cells/ml, alternatively; the cells were frozen down in the culture medium supplemented with 5% DMSO (SIGMA, St Louis, MO, USA).
2.2. Drug solutions and treatment
The mean steady-state peak plasma concentration (Cmax) is the most physiologically relevant concentration for the ARVs because it represents naturally occurring concentrations of the drugs following their intake [11,12,13,14]; hence it was used to treat the cells for 24 hours. Cmax concentrations are as follows for the drugs; Emtricitabine (FTC) Cmax= 1.8 μg/ml [12], Tenofovir Disoproxil Fumarate (TDF) Cmax= 0.3 μg/ml [11], Efavirenz (EFV) Cmax= 4.07 μg/ml [2006], Ritonavir (RTV) Cmax= 2.45 μg/ml [14], Lopinavir (LPV) Cmax= 9.8 μg/ml [14], Cocktail 1 (ATP) 1.8 μg/ml FTC+ 0.3 μg/ml TDF + 4.07 μg/ml EFV, Cocktail 2 (LPV/r) 2.45 μg/ml RTV+ 9.8 μg/ml LPV. The drugs were initially dissolved in 1 ml of primary diluent; 3600 μg/ml FTC and 600 μg/ml TDF were dissolved in distilled water whereas 6000 μg/ml RTV, 98000 μg/ml LPV and 40700 μg/ml EFV were dissolved in methanol (diluents were specified in the certificate of analysis obtained from Toronto Research Chemicals Inc. for each drug). The drugs were further diluted in EMEM in order to obtain the desired Cmax concentrations as indicated above. The final concentration of methanol in working solution was 0.02%.
2.3. Scanning electron microscopy
Approximately 1X10⁵ cells/ml were seeded onto 22×22 mm glass coverslips (Menzel-Gläser, Braunschweig, Germany) and left overnight in order to attach. They were then supplemented with more EMEM the following day and left in the incubator until they reached ~50% confluency (~1 day). The media was removed and cells were rinsed 3X in PBS (pH 7.4) and treated for 24 hours with FTC, TDF, EFV, ATP and LPV/r. Following drug treatment, the media containing the drugs were removed and cells were rinsed in phosphate buffer (pH 7.4). The cells were fixed for 30 minutes in 2.5% Glutaraldehyde (Agar Scientific, Stansted, United Kingdom), rinsed in phosphate buffer and treated with 1% osmium tetroxide (Agar Scientific, Stansted, United Kingdom) for 10 minutes. The cells were rinsed in dH2O and treated for 5 minutes with 1% Thio-carbarhydrizide, which acts as a ligand and enhances the binding of osmium and the conductivity of the sample by increasing the generation of secondary electrons [15,16], rinsed in dH2O, then treated with 1% osmium tetroxide for 5 minutes and then rinsed in phosphate buffer (pH 7.4). The cells were then dehydrated through a graded series of alcohol; 50%, 70%, 80%, 95% and 3X 100% for 5 minutes each. Then treated with hexamethyldisilazane (HMDS) (SIGMA, St Louis, MO, USA) for 30 seconds and kept in a desiccator containing silica gel until the samples were coated. The cells were then coated with a double layer of carbon by an EMITECH K950X. The cells were viewed under a Zeiss Ultra FEG Scanning Electron Microscope. The accelerating voltage used was 1-2kv and the average working distance used was 2.6 mm.
2.4. Data analysis
A scoring system was established and used in order to analyse differences in cell contacts, microvilli density and size, blebbing density and size, and presence of cell secretions in the cells following drug treatment. The JMP11 software was used in order to conduct the statistical analysis. The micrographs were assessed using a scoring system (Table 1) prior to the statistical analysis. An F-test was conducted in order to check for homogeneity of variances, if variances were unequal the data was transformed using log base10 [17]. Following which a one way ANOVA test was conducted in order to determine whether there was a significant difference between the treated cells and controls. A Tukey Kramer Post Hoc test was also conducted in order to determine where the significant differences between the means were present. The statistical tests were carried out independently for every morphological criteria tested.
Table 1.
Scoring system used in order to analyse surface morphology of the cells.
| Surface characteristics | Scoring system |
|---|---|
| Cell connections | Relative percentage of long and thin cytoplasmic projections (e.g. Filopodia) per cell and connections between adjacent cells; 1= ~0-20% of projections from the cell surface and there are less connections to adjacent cells, 2= ~21-50% of projections from the cell surface and many of them are disrupted therefore there are less connections formed between the cells, 3= ~51-100% of projections from the cells and many cell connections between adjacent cells |
| Microvilli density | Relative distribution of microvilli on the cell surface; 1= sparse, 2=medium, 3= dense |
| Microvilli size | Relative length of microvilli on the cell surface; 1= short, 2= mixture of short and long microvilli, 3= long and thin microvilli |
| Blebbing density | Relative distribution of blebs/surface protrusions on the cell surface; 1= none, 2= sparse, 3= medium, 4= dense |
| Bleb size | Relative size of blebs/surface protrusions on the cell surface;1= none, 2=small, 3= medium, 4= large |
| Cell shape | Change in cell shape; 1= round, 2= oval, 3= flattened |
| Membrane bound secretions | Relative amount of secretions on the surface of the cell; 1= none, 2= few, 3= moderate, 4= abundant |
| Extracellular secretions | Relative amount of secretions on the extracellular space; 1= none, 2= few, 3= moderate, 4= abundant |
3. Results
Drug treatment induced prominent changes in the cell surface morphology and statistical tests showed that the changes observed in treated cells were significantly different from the controls (negative and diluent).
3.1. Cell connections
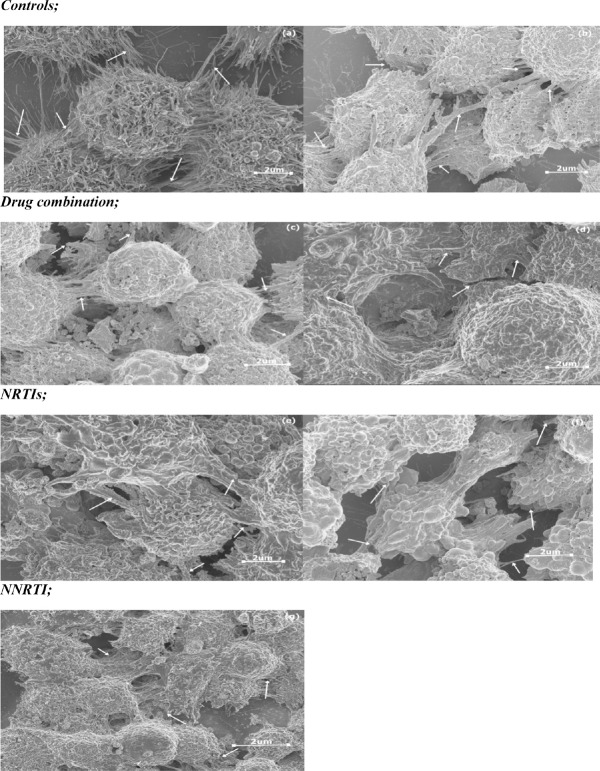
A one way ANOVA test showed that there was a significant difference in cell contacts (as indicated by the lateral cytoplasmic protrusions of the cells, filopodia) between the different groups (Table 2). A Tukey Kramer Post Hoc analysis showed that a significant difference existed between controls and all treated cells (Fig. 1). The micrographs show that there were relatively fewer and more damaged cell contacts in treated cells in comparison to controls. Further differences were observed between LPV/r and FTC, TDF and ATP in that LPV/r treated cells had relatively lesser and more damaged cell contacts than other treatment groups (Fig. 2: a-g).
Table 2.
Summary of one way ANOVA results.
| Significance P<0.05 | |
|---|---|
| Cell contacts | <0.0001 |
| Microvilli density | <0.0001 |
| Microvilli size | <0.0001 |
| Bleb density | <0.0012 |
| Bleb size | <0.0012 |
| Cell shape | <0.0001 |
Fig. 1.
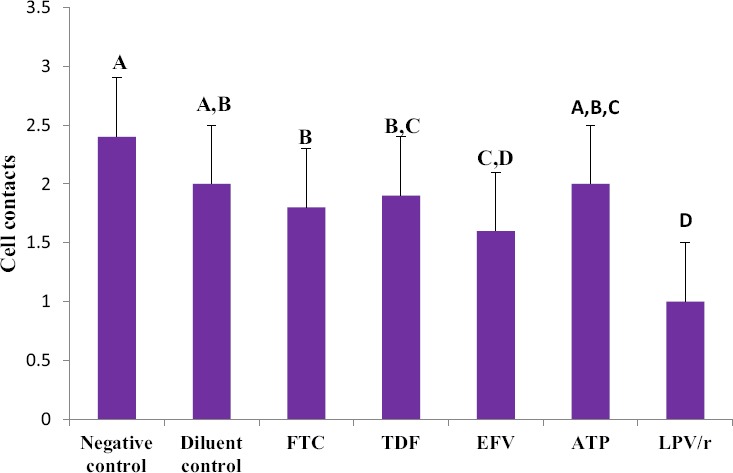
Changes observed in cell contacts in HCS-2 cells following treatment with antiretroviral drugs. There was a significant difference observed between the different groups (p<0.05). Drug treatment damaged and reduced the amount of contacts present; LPV/r resulted in the most reduction and damage in comparison to controls and other treatment groups. Bargraphs not connected by the same letterare significantly different, Tukey Kramer Post Hoc analysis.
Fig. 2.
The change in cell contacts following drug treatment in HCS-2 cells; (a) Negative control, (b) Diluent control, (c) ATP, (d) LPV/r, (e) FTC, (f) TDF, (g) EFV. The arrows show where cell contacts are found represented by long lateral protrusions, filopodia. Extensive cell contacts were characteristic in (a), with drug treatment as observed in (b-g) they were reduced and some were damaged in varying degrees.
3.2. Microvilli density and size
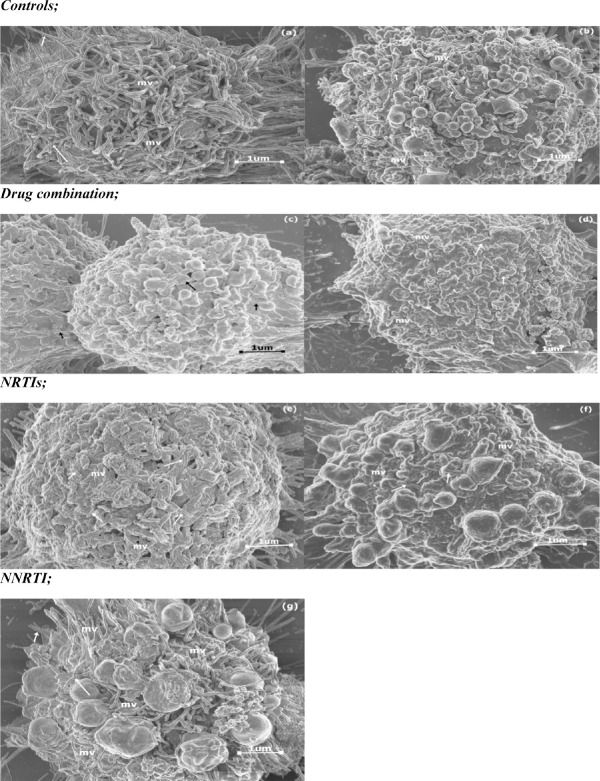
A one way ANOVA test showed that there was a significant difference in microvilli density and size between the different groups (Table 2). A Tukey Kramer Post Hoc analysis for microvilli density showed that a significant difference existed between controls and TDF, ATP and LPV/r treated cells, Furthermore TDF and ATP were significantly different from EFV and the diluent (Fig. 3). The results showed that the different drug treatments did not have a similar effect in altering microvilli density; EFV and FTC treatment showed the least reduction in microvilli density in comparison to the controls whereas ATP, TDF and LPV/r treatment resulted in significant reduction in microvilli density. For microvilli size, a Tukey Kramer Post Hoc analysis showed that a significant difference existed between controls and all the treated cells, thus suggesting that treatment with all the ARV drugs significantly reduced microvilli size. Furthermore TDF, ATP and LPV/r treatment resulted in more reduction of microvilli size in comparison to FTC and EFV treatment (Fig. 4a; a-g).
Fig. 3.
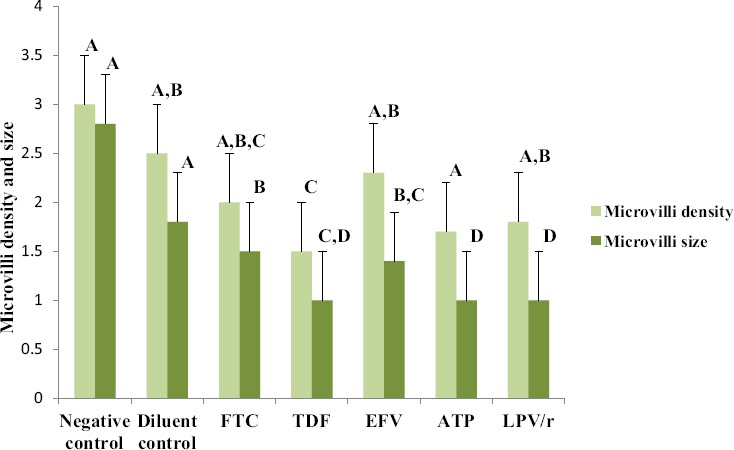
Changes observed in microvilli density and size in HCS-2 cells following treatment with antiretroviral drugs. There was a significant difference observed between the different groups (p<0.05). Drug treatment reduced the size and density of microvilli although the changes were unique to each drug treatment. TDF, ATP and LPV/r treatment showed the most reduction in microvilli size and density in comparison to controls and other drug treatments. Bar graphs not connected by the same letter (per characteristic) are significantly different, Tukey Kramer Post Hoc analysis.
Fig. 4.
The change in density and size of microvilli (mv) following drug treatment (arrows highlight the length of mv); (a) Negative control, (b) Diluent control, (c) ATP, (d) LPV/r, (e) FTC, (f) TDF and (g) EFV. In all the treated cells (b-g) microvilli density decreased in comparison to (a) and the microvilli observed in (c-f) were shorter in comparison to (a) and those seen in (g) were slightly shorter than those in (a), but longer than those seen in other drug treatments (c-f).
3.3. Blebbing density and size
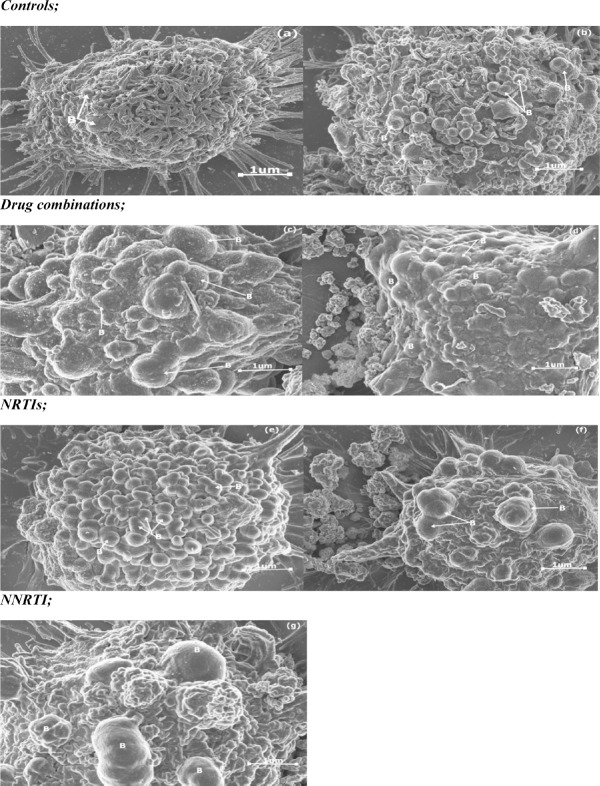
A one way ANOVA test showed that there was a significant difference in blebbing density and size between the different groups (Table 2). A Tukey Kramer Post Hoc analysis for bleb density and size showed that there were fewer blebs in controls in comparison to treated cells, thus suggesting that high bleb formation was induced by drug treatment (Fig. 5). The size of the blebs varied between small, medium and large. ATP, TDF and EFV treated cells had the largest blebs, LPV/r and FTC treated cells presented with mainly small to medium sized blebs (Fig. 6: a-g).
Fig. 5.
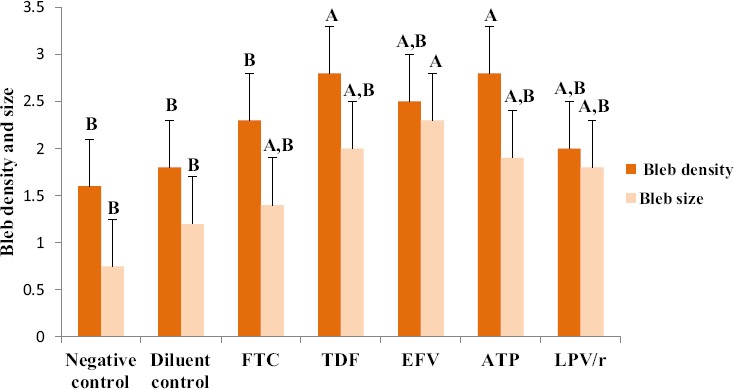
Changes observed in blebbing density and size in HCS-2 cells following treatment with antiretroviral drugs. There was a significant difference observed between the different groups (p<0.05). The expression of blebs increased with drug treatment, thus controls showed the least expression of small sized blebs. TDF and ATP treatment resulted in high bleb density, whereas EFV treatment resulted in large sized blebs in comparison to controls and other treatment groups. Bar graphs not connected by the same letter (per characteristic) are significantly different, Tukey Kramer Post Hoc analysis.
Fig. 6.
The change in bleb density (B) and size following drug treatment; (a) Negative control, (b) Diluent control, (c) ATP, (d) LPV/r, (e) FTC, (f) TDF and (g) EFV. A few small blebs were observed in controls (a-b), drug treatment increase the amount and size of blebs, as seen in micrographs (c-g), in comparison to controls.
3.4. Cell shape and secretions
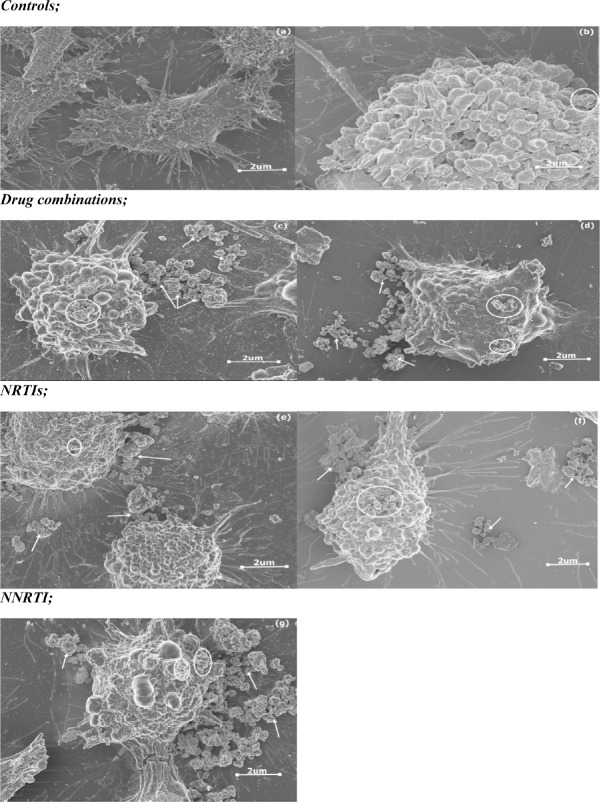
A one way ANOVA test showed that there was a significant difference between the groups in terms of the shape of the cell (Table 2). A Tukey Kramer Post Hoc analysis showed that a significant difference existed between both controls and all the treated groups (Fig. 7 & Fig. 8). In general, drug treatment altered the shape of the cell in varying degrees. FTC, TDF and EFV treated cells acquired mostly a round shape; however, there were a few cells which were ovoid and some flattened, whereas ATP and LPV/r treated cells were mostly round in shape (Fig. 9: a-g). Overall, cell shape changed from flattened and polyhedral in untreated cells to a transition between ovoid/oval to round in treated cells. Treated cells were observed to have some membrane bound secretions on their surface (Fig. 9: a-g: encircled) and in the extracellular matrix (Fig. 9: arrows), these are suggested to be released from the apoptotic bodies.
Fig. 7.
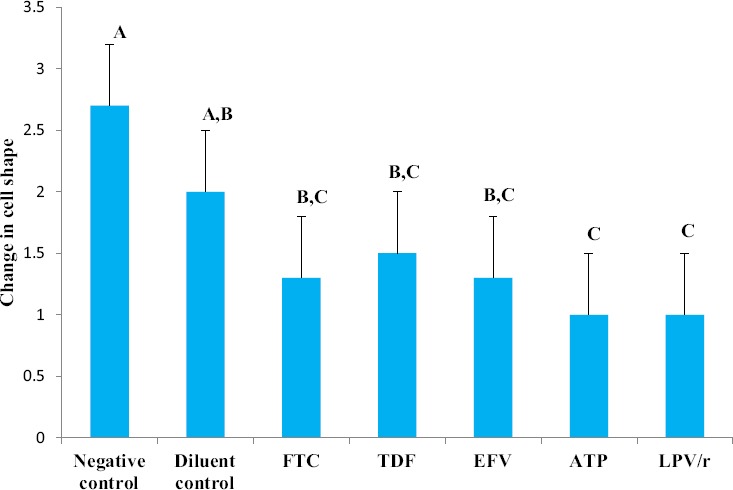
Changes observed in cell shape in HCS-2 cells following treatment with antiretroviral drugs. There was a significant difference observed between the different groups (p<0.05). Negative controls had a flattened and polyhedral shape; however the shape of the cell acquired a more rounded morphology following drug treatment. Treatment with ATP and LPV/r resulted in the most change in cell shape. Bar graphs not connected by the same letterare significantly different, Tukey Kramer Post Hoc analysis.
Fig. 8.
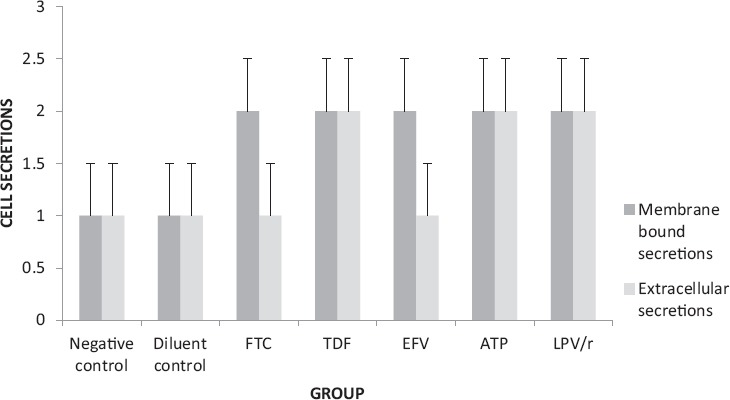
The presence of membrane bound secretions in HCS-2 cells following treatment with antiretroviral drugs. There was a significant difference observed between the different groups (p<0.05). Untreated cells had very few if any secretions on their surface whereas treated cells had secretions in varying amounts with ATP and LPV/r having the most membrane-bound secretions. In contrast bothcontrols (negative and diluent) and FTC treated cells had very few if any secretions in the extracellular space and were hence significantly different from ATP, LPV/r and TDF treated cells which had more secretions in the ECM.
Fig. 9.
cell secretions and change in cell shape following drug treatment; (a) Negative control, (b) Diluent control, (c) ATP, (d) LPV/r, (e) FTC, (f) TDF and (g) EFV. Arrows indicate extracellular secretions whereas circles represent membrane-bound secretions. The cell shape changed from flattened polyhedral in (a) to ovoid and/or circular in (b-g).
4. Discussion and conclusion
The morphological analysis of the plasma membrane using the SEM has revealed features which are characteristic of apoptosis; for example rounding-up of cells, retraction of filopodia, blebbing and maintenance of plasma membrane integrity [2,18]. These features are in contrast to those observed in other forms of cell death, specifically necrosis. Necrosis is characterised by morphological features such as increased cell volume (oncosis) and plasma membrane rupture [18].
Eukaryotic cells respond to intra and extracellular signals by remodelling their sub-membranous cytoskeleton which is reflected by changes in the plasma membrane [19,20]. The cytoskeletal re-arrangements are regulated by small GTPases belonging to the Rho family and downstream signalling caspases and they result in the formation of distinctive types of actin-rich invaginations or protrusions including filopodia, lamellipodia, invadopodia, podosomes, phagocytic cups, and uropods that have specific biological functions [19,20].
Filopodia are thin cytoplasmic protrusions which play a role in attaching the cells to the growth surface, assisting in cell migration and are important components of cell to cell junctions [19,20]. They were the most common type of protrusion observed in the current study. Untreated cells presented with numerous filopodia which were extending from the cells to form connections with adjacent cells and to adhere to the substratum, a feature which is commonly observed in cancer cells due to their high migratory rate and because the cancer cells are highly active they maintain communication with neighbouring cells and therefore numerous cell contacts are a common feature [19,20]. These features were altered to varying degrees in cells which were treated with the ARV drugs as they acquired characteristic features of cell death.
The treated cells displayed loss of cell contacts as indicated by the reduced amount of prominent cell extensions making contact with adjacent cells and fewer and damaged filopodia were observed in the extracellular space. The PI (LPV/r) drug combination resulted in more damaged cell contacts than the other drugs. These findings suggest an adverse effect of the drug treatments on the cell's capacity for invasion, taking into account that metastasis is dependent on the cell's mobility which is ensured by the actin content [19,20].
The destruction of actin rich structures such as filopodia weakens the cancer cells capacity to move, therefore the effect of the drugs on the HCS-2 cells suggest that they may potentially prolong or inhibit onset of metastasis by reducing cancer cell mobility. The change in cell shape from polyhedral and flattened in untreated cells to acquiring a more rounded morphology in treated cells is also an indication of re-organisation of the cytoskeletal components [21].
Blebs are bulky, round structures which can extend up to 2 μm from the plasma membrane [19,20]. The life cycle of blebs lasts for a short period ~1 min and is characterised by rapid bleb expansion, a short stationary phase, and low retraction of the bleb to its point of origin in the plasma membrane [19,20]. The formation of blebs is induced by various actions involving local disruption of membrane actin cortex interactions, which lead to rapid protrusion of the plasma membrane due to the internal hydrostatic pressure of the cell [19,20].
Early studies done on plasma membrane blebs have linked their expression to cell movement, as they were observed during the spreading of human conjunctiva cells and fibroblasts [19,20]. In contrast to these observations plasma membrane blebs were later viewed as a consequence of apoptotic and necrotic processes, in which cells display prominent blebs that do not play a role in locomotion, although blebbing alone is not a pre-requisite for the execution of cell death programmes [19,20]. Non-apoptotic blebs tend to have a reversible nature whereas apoptotic blebs ultimately lead to the formation of apoptotic bodies [19,20].
In this study there were a few blebs observed on the surface of some untreated cells possibly for locomotion, but following drug treatment the HCS-2 cells had an increase in blebs of various sizes across the cell surface. The amount of blebbing varied in density and size between the treatment groups and these two parameters (density and size) were inversely proportional to one another. NRTIs; FTC and TDF, induced the formation of small to medium blebs however FTC treatment induced lesser bleb density than TDF treatment suggesting that TDF induced changes quicker or was more potent in terms of cell death induction than FTC.
The NNRTI; EFV, was amongst the treatments that induced the least amount of bleb occurrence yet the size of the blebs observed following treatment with this drug was the largest. The ATP combination resulted in evenly distributed bleb density and medium sized blebs. These effects were intermediate of those caused by individual drug treatment. The PI combination (LPV/r) showed the least bleb density and smaller blebs.
When the observation of plasma membrane blebbing is reconciled with other morphological features observed in the cells, it is more likely that it resulted from apoptosis induction rather than locomotion. As previously mentioned that blebbing alone cannot be considered to be indicative of apoptosis; this study showed that there were other features present which are known to be characteristic of apoptosis, therefore it is suggested that drug treatment induced some changes in the cytoskeleton that led to the formation of blebs. This feature was not prominent in untreated cells further supporting the hypothesis that it is a result of cell death induction, possibly through apoptosis, and eluding to the fact that drug treatment induced the change.
Changes in cytoskeletal components are not only reflected by bleb formation but can also be shown by changes in surface microvilli [7]. In this study drug treatment with NRTIs; FTC and TDF, NNRTI; EFV, ATP combination;FTC+TDF+ EFV and PIs; LPV/r, reduced microvilli density in contrast to the dense cover and long microvilli observed in untreated cells. FTC and EFV treatment showed less severe reduction in microvilli density and size than TDF and ATP and the PI combination; LPV/r showed the most reduction suggesting that the drugs do not exhibit their effects at the same pace. These changes concur with previous studies which suggest that the cytoskeleton, which forms the core of the microvilli [22], is subject to change in response to cell death stimuli which in this case were the ARV drugs.
Another relationship was observed between blebbing and microvilli density in the plasma membrane. On cell surfaces where there was a high density of blebs the surface microvilli cover was less dense, and where there was low to medium density of blebs the surface microvilli cover was correspondingly denser; in the latter case the blebs would be interspersed among the microvilli. This observation could be an indication of the sequence of events and possibly suggests that loss of microvilli occurs at an early stage of cell death and precedes bleb formation which occurs later.
In addition because both these features (blebs and microvilli) arise from the cytoskeleton, microvilli integrity would be more dependent on an intact cytoskeleton and in cases where a cell is undergoing cell death this is more likely to occur at the initial stages of cell death induction because as time lapses, the cytoskeleton loses integrity and so do the microvilli hence they become shorter. Therefore it is suggested that microvilli gradually decreases in density and size and make way for bleb formation.
In contrast the blebs are more likely to occur at a later stage following loss of microvilli because as previous studies have suggested, the blebs carry degraded products from within the cell and pinch off to become apoptotic bodies [7]; hence an inverse relationship exists between these two morphological features.
At a later stage of apoptosis, the cell condenses and disintegrates into apoptotic bodies which will be detected and removed by macrophages or adjacent cells through phagocytosis [4,7]. Transmission electron microscopy studies have revealed the structure of apoptotic bodies and they are membrane bound vesicles containing cellular organelles, part of the cytoplasm and nuclear fragments [7]. Failure of the apoptotic cell to be phagocytosed as is the case in isolated conditions like cell culture, results in degradation which is similar to necrosis and thus cell death is said to be facilitated via secondary necrosis [8].
In this study the drug treated cells were observed to be releasing some internal cellular secretions into the extracellular space as indicated by cell debri. These secretions likely represent the end stage of cell death in which the blebs begin to pinch-off forming apoptotic bodies. These apoptotic bodies are released from the cell into the extracellular space so that they can be removed via phagocytosis, as previously mentioned [7].
Due to the absence of phagocytic cells, the apoptotic bodies were degraded and released their contents, thus the cell secretions represents their remnants. Some of the secretions were membrane bound and these were observed in all the treatment groups although in varying amounts. Extracellular secretions were the least in FTC and EFV and were relatively more abundant in TDF, ATP and LPV/r.
In conclusion, the ARV drugs used in this study induced morphological features which are known to be characteristic of cell death, especially through apoptosis. Although there were slight differences between the different drugs, TDF seemingly induced morphological changes more rapidly than FTC even though these drugs belong to the same class of ARVs, NRTIs. Similarly EFV, like FTC, was a slower acting drug in terms of inducing morphological changes in the cells. The drug combinations were seemingly more effective than individual treatments in inducing cell death because morphological features observed following 24 hours treatment were relatively more advanced than in individual treatments, although the PI combination LPV/r was more potent than the ATP combination in inducing cell death. The dual effect of HAART against HIV infection and cancer could be beneficial against cervical cancer which is commonly associated with HIV infection.
Disclosure of interest
The authors declare that they have no conflicts of interest concerning this article.
Acknowledgements
This work was supported by a grant from the South African Medical Research Council.
References
- [1].Debatin KM. Apoptosis pathways in cancer and cancer therapy. Cancer Immunology and Immunotherapy. 2004;53:153–9. doi: 10.1007/s00262-003-0474-8. [DOI] [PMC free article] [PubMed] [Google Scholar]
- [2].Bjelaković G, Nagorni A, Bjelaković M, Stamenković I, Arsic R, Katić V. Apoptosis: programmed cell death and its clinical implications. Medicine and Biology. 2005;12:6–11. [Google Scholar]
- [3].Plati J, Bucur O, Khosravi-Far R. Dysregulation of apoptotic signalling in cancer: molecular mechanisms and therapeutic opportunities. Journal of Cellular Biochemistry. 2008;104:1124–49. doi: 10.1002/jcb.21707. [DOI] [PMC free article] [PubMed] [Google Scholar]
- [4].Van England M, Kuijpers HJH, Ramaekers FCS, Reutelingsperger CPM, Schuttle B. Plasma membrane alterations and cytoskeletal changes in apoptosis. Experimental Cell Research. 1997;235:421–30. doi: 10.1006/excr.1997.3738. [DOI] [PubMed] [Google Scholar]
- [5].Bafna S, Kaur S, Batra SK. Membrane-bound mucins: the mechanistic basis for alterations in the growth and survival of cancer cells. Oncogene. 2010;29:2893–904. doi: 10.1038/onc.2010.87. [DOI] [PMC free article] [PubMed] [Google Scholar]
- [6].Majno G, Joris I. Apoptosis, oncosi and necrosis.An overview of cell death. American Journal of Pathology. 1995;146:3–15. [PMC free article] [PubMed] [Google Scholar]
- [7].Condello M, Caraglia M, Castellano M, Arancia G, Meschini S. Structural and functional alterations of cellular components as revealed by electron microscopy. Microscopy Research and Technique. 2013;76:1057–69. doi: 10.1002/jemt.22266. [DOI] [PubMed] [Google Scholar]
- [8].Saraste A, Pulkki K. Morphologic and biochemical hallmarks of apoptosis. Cardiovascular Research. 2000;45:528–37. doi: 10.1016/s0008-6363(99)00384-3. [DOI] [PubMed] [Google Scholar]
- [9].Bean P. New drug targets for HIV. Clinical Infectious Diseases. 2005;41:96–100. doi: 10.1086/429504. [DOI] [PubMed] [Google Scholar]
- [10].Bratcher LF, Sahasrabuddhe VV. The impact of antiretroviral therapy on HPV and cervical intraepithelial neoplasia: current evidence and directions for future research. Infectious Agents and Cancer. 2010;5:8. doi: 10.1186/1750-9378-5-8. [DOI] [PMC free article] [PubMed] [Google Scholar]
- [11].Gilead Science. Highlights of prescribing information (VIREAD) Reactions. 2001:1–43. [Google Scholar]
- [12].Gilead Sciences. Highlights of prescribing information (EMTRIVA) Pharmacology. 2003:1–29. [Google Scholar]
- [13].Gilead Sciences and Bristol-Myers Squibb. Highlights of prescribing information (ATRIPLA). Sciences. New York: 2006. pp. 1–155. [Google Scholar]
- [14].Abbott laboratories, Limited. KALETRA® product monograph. 2010:1–91. [Google Scholar]
- [15].Murakami T, Song Z, Hinenoya H, Ohtsuka A, Taguchi T, Liu J, et al. Lysine-mediated tissue osmication in combination with a tannin-osmium conductive staining method for non-coated scanning electron microscopy of biological specimens. Archives of Histology and Cytology. 1987;50:485–93. doi: 10.1679/aohc.50.485. [DOI] [PubMed] [Google Scholar]
- [16].Jongebloed WL, Stokroos I, Kalicharan D, Van der Want JJL. Is cryopreservation superior over tannic acid/arginine/osmium tetroxide non-coating preparation in field emission scanning electron microscopy. Scanning Electron Microscopy. 1999;13:93–101. [Google Scholar]
- [17].Keen ON. The log transformation is special. Statistics in Medicine. 1995;14:811–9. doi: 10.1002/sim.4780140810. [DOI] [PubMed] [Google Scholar]
- [18].Kroemer G, Galluzzi L, Vandenabeele P, Abrams J, Alnemri ES, Baehrecke EH, et al. Classification of cell death. Cell Death and Differentiation. 2009;1:3–11. doi: 10.1038/cdd.2008.150. [DOI] [PMC free article] [PubMed] [Google Scholar]
- [19].Fackler OT, Grosse R. Cell motility through plasma membrane blebbing. Journal of Cell Biology. 2008;181:879–84. doi: 10.1083/jcb.200802081. [DOI] [PMC free article] [PubMed] [Google Scholar]
- [20].Norman LL, Brugés J, Sengupta K, Sens P, Aranda-Espinoza H. Cell blebbing and membrane area homeostasis in spreading and retracting cells. Biophysical Journal. 2010;99:1726–33. doi: 10.1016/j.bpj.2010.07.031. [DOI] [PMC free article] [PubMed] [Google Scholar]
- [21].Hacker G. The morphology of apoptosis. Cell Tissue Research. 2000;301:5–17. doi: 10.1007/s004410000193. [DOI] [PubMed] [Google Scholar]
- [22].Lange K, Gartzke J. Microvillar cell surface as a natural defense system against xenobiotics: a new interpretation of multidrug resistance. American Journal of Physiology. 2001;281:C369–85. doi: 10.1152/ajpcell.2001.281.2.C369. [DOI] [PubMed] [Google Scholar]


