Abstract
Phosphatidylinositol 3-kinase (PI3K) plays a central role in insulin signaling, glucose metabolism, cell growth, cell development, and apoptosis. A heterozygous missense mutation (R649W) in the p85α regulatory subunit gene of PI3K (PIK3R1) has been identified in patients with SHORT (Short stature, Hyperextensibility/Hernia, Ocular depression, Rieger anomaly, and Teething delay) syndrome, a disorder characterized by postnatal growth retardation, insulin resistance, and partial lipodystrophy. Knock-in mice with the same heterozygous mutation mirror the human phenotype. In this study, we show that Pik3r1 R649W knock-in mice fed a high-fat diet (HFD) have reduced weight gain and adipose accumulation. This is accompanied by reduced expression of several genes involved in lipid metabolism. Interestingly, despite the lower level of adiposity, the HFD knock-in mice are more hyperglycemic and more insulin-resistant than HFD-fed control mice. Likewise, when crossed with genetically obese ob/ob mice, the ob/ob mice carrying the heterozygous R649W mutation were protected from obesity and hepatic steatosis but developed a severe diabetic state. Together, our data demonstrate a central role of PI3K in development of obesity and fatty liver disease, separating these effects from the role of PI3K in insulin resistance and the resultant hyperglycemia.
Introduction
Insulin resistance is a central feature of type 2 diabetes, obesity, and metabolic syndrome. Phosphatidylinositol 3-kinase (PI3K) is a critical mediator of insulin’s metabolic action. Activation of class 1A PI3Ks by insulin or other growth factors leads to the generation of phosphatidylinositol 3,4,5-triphosphate (PIP3) (1), which in turn activates Akt and other downstream kinases regulating cellular processes, including cellular growth, survival, and metabolism. Defects in activation of PI3K are present in virtually all insulin-resistant states (1). Although obesity is a major driver of insulin resistance, PI3K is also required for normal adipogenesis (2–7). Thus, this enzyme is at a critical juncture—required for the development of obesity and defective in insulin resistance.
PI3Ks are heterodimeric enzymes formed by a regulatory subunit and a catalytic subunit (8,9). Three different genes give rise to the p85 regulatory subunit: PIK3R1, which encodes p85α and its splice isoforms p55α and p50α; PIK3R2, which encodes p85β; and PIK3R3, which encodes p55γ. The catalytic subunits also arise from three genes: PIK3CA, PIK3CB, and PIK3CD, encoding p110α, p110β, and p110δ, respectively. Despite PI3K’s critical role in mediating insulin action, mice with heterozygous deletion of p85α or loss of p85β paradoxically have improved PI3K activity and increased insulin sensitivity (10–12), partly due to an improved balance between the p85–p110 dimer and monomeric p85 in competing for binding to phosphorylated insulin receptor substrate (IRS) 1 and IRS-2 (13). However, total deletion of all products of the p85α gene or homozygous deletion of p110α or p110β leads to embryonic/perinatal lethality due to loss of PI3K activity (14–16). By contrast, activating mutations in PIK3R1 or PIK3CA can cause uncontrolled cellular growth and trigger cancer development (17).
Missense mutations in PIK3R1 can also lead to a reduction in the ability of insulin and other growth factors to activate PI3K (18–20). These mutations are found in patients with SHORT syndrome, an autosomal dominant disorder characterized by Short stature, Hyperextensibility of joints and/or hernia, Ocular depression, Rieger anomaly, and Teething delay (21). These patients also have partial lipodystrophy with a selective reduction in subcutaneous fat in the face, flank, and buttocks, as well as systemic insulin resistance (22). The most common of these mutations, Arg649Trp (R649W), changes the FLVR motif in the C-terminal Src homology 2 domain (cSH2) (23). This region is essential for binding of PI3K to tyrosine-phosphorylated proteins, such as IRS-1 and many growth factor receptors, and activation of the PI3K pathway (8,18,24). Other mutations in SHORT syndrome patients include missense mutations (Glu489Lys, Arg631Gln), deletions (Ile539del), truncations (Tyr657*), and frame-shift insertions (Asn636Thrfs*18, Asp643Aspfs*8, Arg649Profs*5) (19,20,25). These mutations all cluster in or near the cSH2 domain region. We recently created knock-in (KI) animals heterozygous for the R649W mutation (24). Similar to affected patients, these mice exhibit a reduction in body weight and length, ocular abnormalities, partial lipodystrophy, and insulin resistance (24,26). Mice with the heterozygous R649W mutation also show reduction in adipose fat mass due largely to a reduction in adipocyte size.
Despite the critical role of PI3K in insulin action, the role of PI3K regulatory subunits in development of obesity and its associated insulin resistance are unclear. Although heterozygous p85α knock-out animals fed a high-fat diet (HFD) gain a normal amount of weight, homozygous p85α knock-out animals gain more weight on an HFD than control animals (27,28). Insulin sensitivity in both of these HFD models is preserved, despite the differences in weight gain, somehow bypassing the obesity-associated reductions in phosphotyrosine activation of downstream signaling. Moreover, pharmacologic inhibition of PI3K has been shown to reduce body weight in obese mice and monkeys due to reduced adiposity (7).
In this study, we have assessed the role of PI3K in body fat accumulation/distribution and insulin resistance by studying the effects of diet- and genetically induced obesity on mice carrying the heterozygous Pik3r1 R649W mutant, thus mimicking humans with this defect. We find that despite being protected from obesity, these mice develop severe diabetes, thereby separating the role of PI3K in adipose development from the occurrence of insulin resistance.
Research Design and Methods
All animal studies followed guidelines by the Joslin Diabetes Center Institutional Animal Care and Use Committee and were in accordance with the guidelines of the National Institutes of Health.
Animals and Diets
All mice were housed at 20–22°C with a 12-h light/12-h dark cycle and given ad libitum access to water and food. Pik3r1 R649W KI mice were generated as described previously (24). These mice were on a pure C57/Bl6 background and were maintained by breeding male Pik3r1 R649W heterozygous KI mice with female C57/Bl6NCrl. The standard chow diet (CD) contained 22% fat by calories (Mouse Diet 9F; PharmaServ). For the HFD experiments, mice were fed a diet containing 60% of calories from fat (D12492; Research Diets) for 8 weeks, beginning at 6 weeks of age. To induce genetic obesity, Pik3r1 R649W heterozygous KI male mice were crossed with heterozygous female B6.V-LepOB/j mice (ob/−, JAX stock no. 000632) to generate heterozygous R649W Pik3r1:ob/− mice, which were used to breed the four study groups: wild type (WT), ob/ob, KI, and ob/ob-KI. We used littermates in the control groups for all studies.
Tissue and Serum Analyses
Tissues were stored frozen at −80°C or fixed in formalin. Adiposoft Image Analysis Software was used to quantify the adipocyte area. For protein measurement, tissues were lysed in radioimmunoprecipitation assay buffer (EMD Millipore) supplemented with protease and phosphatase inhibitor cocktails (BioTools), and protein concentrations were determined using the bicinchoninic acid assay (Thermo Fisher Scientific). Comparable amounts of protein were subjected to SDS-PAGE and transferred to polyvinylidene difluoride membrane (EMD Millipore). Immunoblotting was performed using the indicated antibodies: phosphorylated insulin receptor (p-IR)/IGF-I receptor (#3024), p-AKT (#4060), AKT (#4691) from Cell Signaling Technologies, and IR (sc-711) and actin (sc-1616) from Santa Cruz Biotechnology. RNA was prepared from tissues using QIAzol (QIAGEN). cDNA was synthesized using the High-Capacity cDNA Reverse Transcription Kit (Applied Biosystems), and quantitative PCR was performed using iQ SYBR Green Supermix (Bio-Rad), a cDNA template, and gene-specific primers (Supplementary Table 1) on a CFX384 thermocycler (Bio-Rad). Expression of the TATA-box binding protein (Tbp) gene was used for normalization. Tissue sections were stained with hematoxylin and eosin. Serum insulin, adiponectin, and leptin were assessed by ELISA according to the manufacturer’s instructions (Chrystal Chem). Liver triglycerides were measured by Infinity Triglycerides Liquid Stable Reagent (Pointe Scientific).
Physiologic and Metabolic Assessments
Food intake, energy expenditure, and metabolism were assessed using the Comprehensive Lab Animal Monitoring System (CLAMS). Body composition was assessed by DEXA. Blood glucose was measured using the INFINITY Blood Glucose Monitoring System (USDiagnostics). For glucose tolerance testing, mice were fasted overnight (16 h), injected intraperitoneally with glucose at 2 g/kg body weight, and blood glucose was measured at indicated time points. Insulin tolerance tests were performed by intraperitoneal administration of insulin (1.5 units/kg body weight) to mice in the random fed state, followed by measurements of blood glucose at indicated time points.
Statistical Analyses
Results are presented as mean ± SEM and were analyzed by unpaired Student t tests or ANOVA, as indicated. A P value of <0.05 was considered significant.
Results
The Pik3r1 R649W Mutation Disrupts Weight Gain Induced by HFD
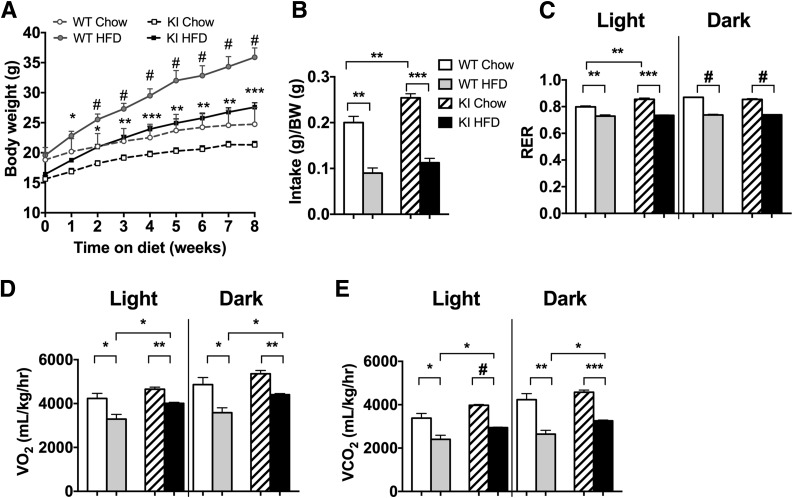
To elucidate the effect of the p85α R649W mutation on the development of obesity and adipose tissue metabolism, we challenged Pik3r1 R649W-KI and WT control littermates with the HFD (60% of total calories) or CD for 8 weeks, starting at 6 weeks of age. Before starting the diet, KI mice had ∼15% lower body weight than WT controls, consistent with our previous findings (24) (Fig. 1A). Although KI and WT mice started at different weights, both gained the same amount of weight on the CD during the 8-week period. This was despite a significantly greater food intake and elevated respiratory exchange ratio during the light cycle in the mutant mice (measured at 8th week on the diet) (Fig. 1B and C). VO2 and VCO2 were elevated in both the light and dark cycle (Fig. 1D and E), with a similar trend at 4 weeks (Supplementary Fig. 1A–D). KI mice fed the HFD gained significantly less weight than the controls, ending at a weight difference of 26.1 ± 0.8 g vs. 34.2 ± 2.3 g (Fig. 1A), despite a trend to greater food intake in the KI mice fed the HFD (Fig. 1B). KI mice, however, showed no difference in water intake (Supplementary Fig. 1E) or activity level (Supplementary Fig. 1F).
Figure 1.
Pik3r1 R649W mice are resistant to HFD-induced obesity. A: Body weight of WT and Pik3r1 R649W KI mice measured over 8 weeks of CD or HFD, shown as mean ± SEM of 12–14 animals per group. *P < 0.05, **P < 0.01, ***P < 0.001, #P < 0.0005, one-way ANOVA. Data from CLAMS of mice in week 8 of diet shows daily food intake normalized to body weight (BW) (B), and respiratory exchange ratio (RER) (C), VO2 (D), and VCO2 (E) in light and dark cycle, shown as the average of two 24-h cycles. **P < 0.01, ***P < 0.001, #P < 0.0005, t tests.
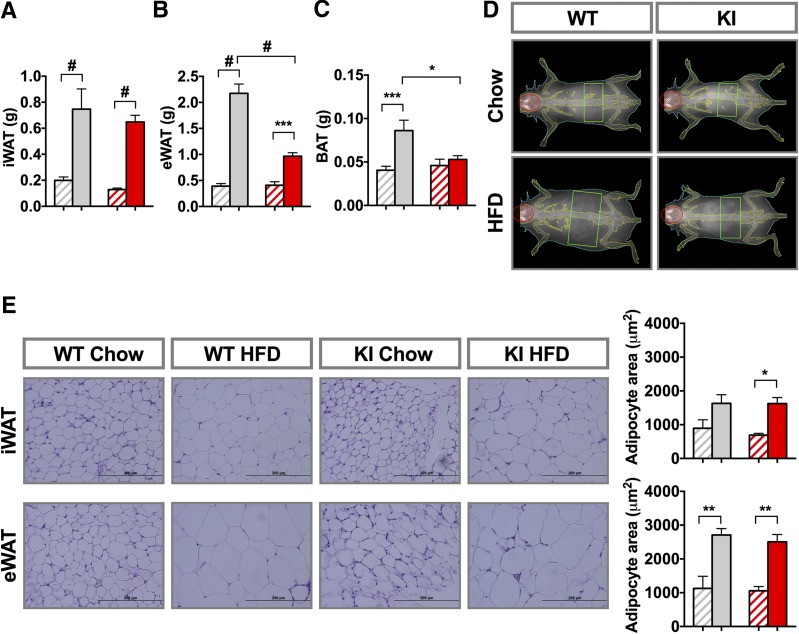
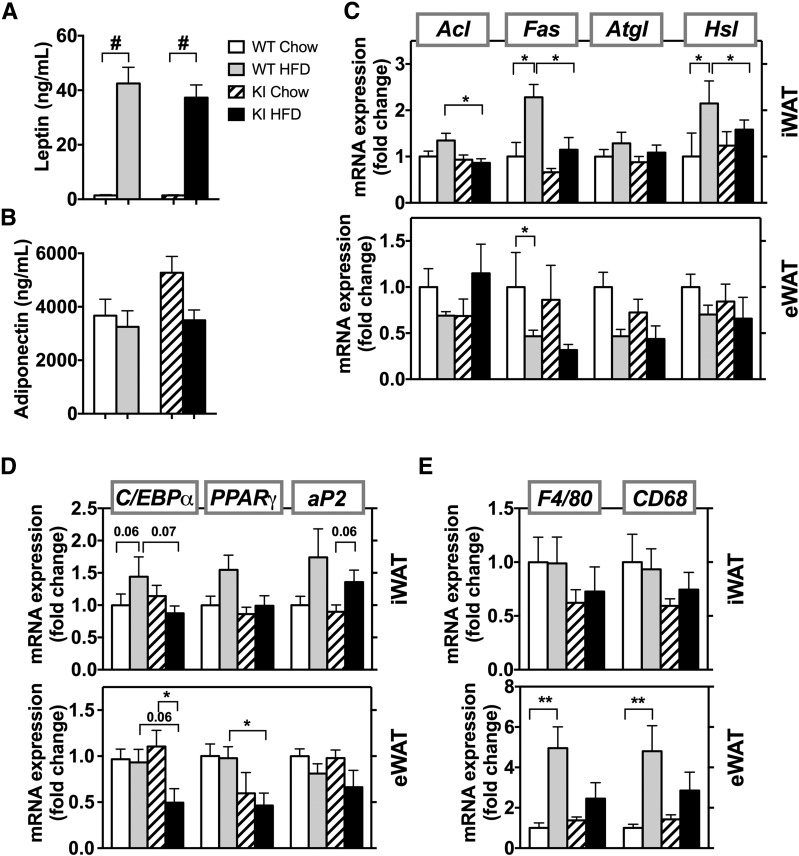
The WT and KI mice both had a significant increase in adipose mass when fed the HFD compared with their respective CD controls. After the 8-week diet challenge, inguinal white fat (iWAT) in mice fed the HFD versus CD was 0.75 ± 0.16 g vs. 0.20 ± 0.03 g in WT mice, respectively, and was 0.65 ± 0.05 g vs. 0.13 ± 0.01 g in KI mice, respectively (Fig. 2A). Epididymal fat depots (eWAT) in WT mice increased even more on the HFD, and again, this was reduced in the KI mice (Fig. 2B). Brown adipose tissue (BAT) mass was the same for both genotypes and showed a trend to increase after 8 weeks of the HFD, somewhat more in WT animals than in KI animals (Fig. 2C). Fat mass, expressed as the percentage of body weight, paralleled adipose mass (Supplementary Fig. 3A–C), but no differences were observed in lean mass (Fig. 2D and Supplementary Fig. 2A). The increase in fat mass on the HFD was associated with an approximate twofold increase in adipocyte size in iWAT and eWAT of both genotypes (Fig. 2E). Serum leptin levels increased ∼40-fold on the HFD in both genotypes, paralleling the increased fat mass (Fig. 3A), with no change in adiponectin levels (Fig. 3B).
Figure 2.
Pik3r1 R649W mice have reduced adipose tissue mass gain by HFD. Weight of iWAT (A), eWAT (B), and BAT (C) after 8 weeks on the CD or HFD. D: Representative DEXA images after the end of the 8-week diet period. E: Hematoxylin and eosin staining of formalin-fixed sections from representative inguinal and epididymal tissue and average adipocyte area (n = 4). Results are shown as mean ± SEM. *P < 0.05, **P < 0.01, ***P < 0.001, #P < 0.0005, one-way ANOVA. Gray diagonal bars: WT chow mice; gray bars: WT HFD mice; red diagonal bars: KI chow mice; red bars: KI HFD mice.
Figure 3.
mRNA levels of regulators of lipid metabolism are unaffected by the HFD in Pik3r1 R649W mice. Serum levels of leptin (A) and adiponectin (B) in WT and KI animals fed the CD or HFD (n = 4–8 animals per group). Results are shown as mean ± SEM. #P < 0.0005, one-way ANOVA. mRNA levels of genes involved in lipid metabolism (C), adipocyte development (D), and inflammation (E) in the inguinal fat pad (top panels) and epididymal fat pad (bottom panels) after 8 weeks of the CD or HFD. mRNA results are mean ± SEM (n = 5–6 animals per group). *P < 0.05, **P < 0.01 by t tests, compared with controls.
In control mice, the HFD increased mRNA levels of lipid metabolism regulators, such as fatty acid synthase (Fas) and hormone-sensitive lipase (Hsl), in iWAT (Fig. 3C, top panel). This increase was significantly reduced in the KI mice with lower fat mass. Consistent with less iWAT in these KI mice after the HFD, the mice had lower mRNA levels of regulators of lipid metabolism, such as ATP citrate lyase (Acl), Fas, and Hsl, compared with WT on HFD. By contrast, in eWAT, the HFD-fed WT and KI mice both showed a trend to lower expression of Fas, adipose triglyceride lipase (Atgl), and Hsl compared with their CD counterparts (Fig. 3C, bottom). mRNA levels of genes involved in adipogenesis, including CCAAT/EBPα (C/EBPα), peroxisome proliferator-activated receptor (PPAR)-γ (PPARγ), and adipocyte protein-2 (ap2), were only mildly affected by the HFD (Fig. 3D). Although the HFD slightly increased these mRNAs in iWAT of WT mice, they did not increase in KI animals fed the HFD. Similarly, in the eWAT of KI animals fed the HFD, mRNA expression of adipogenesis regulators C/EBPα and PPARγ was lower than in WT mice fed the HFD.
Consistent with the lower fat mass, KI mice showed a trend of reduced inflammation in adipose tissue as measured by mRNA levels of macrophage markers F4/80 and CD68. In WT mice, the HFD increased F4/80 and CD68 mRNA expression in eWAT by ∼4.5- to 5-fold compared with their CD controls, whereas these markers in KI mice were increased by only ∼2- to 2.5-fold (Fig. 3E, bottom). Even though the HFD caused some expansion of iWAT in KI mice, no changes were noted in inflammation when fed the HFD (Fig. 3E, top).
HFD Exacerbates Insulin Resistance in Pik3r1 R649W Mice
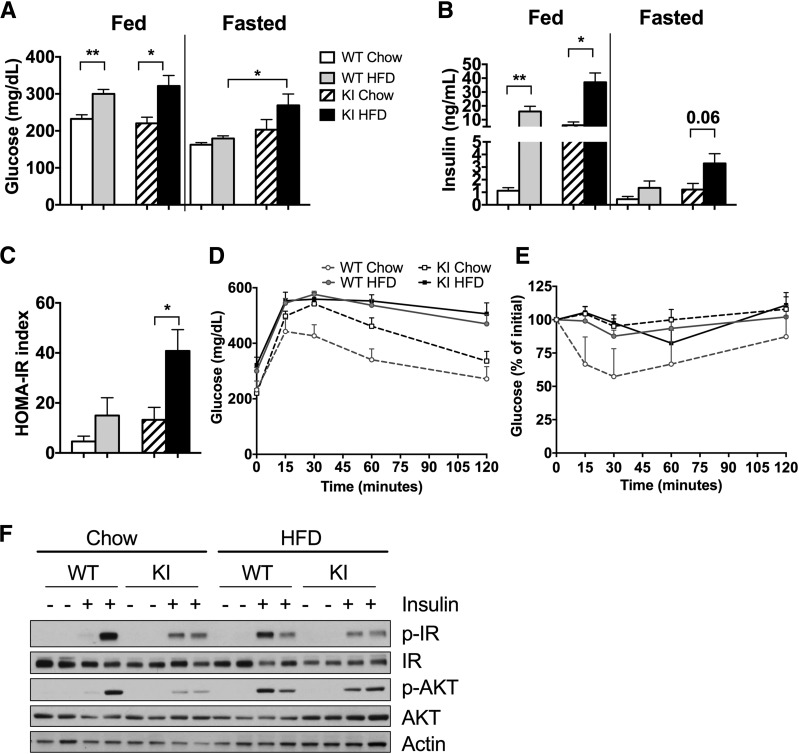
As expected, after 8 weeks of the HFD, WT and Pik3r1 R649W KI animals both had significant ∼1.5-fold increases in fed blood glucose levels, with lesser effects in the fasted state (Fig. 4A). More striking were changes in insulin levels. KI mice fed the CD already had 10-fold higher fed insulin levels than WT animals. After 8 weeks of the HFD, fed insulin levels in both WT and KI mice increased by 16- and 4-fold, respectively, such that KI mice had 2-fold higher insulin levels than WT mice. Fasting insulin levels showed a comparable trend (Fig. 4B). These changes paralleled changes in insulin resistance as assessed by the HOMA of insulin resistance (Fig. 4C). This was also associated with elevated glucose levels during an intraperitoneal glucose tolerance test and a marked blunting of response during an intraperitoneal insulin tolerance test in HFD-fed mice (8 weeks of diet) (Fig. 4D and E). Differences in insulin resistance also paralleled changes in insulin signaling in vivo. Thus, there was a clear reduction in p-IR and p-AKT in the liver of KI mice 10 min after an exogenous insulin injection (Fig. 4F). After 8 weeks of the HFD, control and KI mice both showed a modest decrease in both p-IR and p-AKT.
Figure 4.
HFD exacerbates insulin resistance and glucose metabolism in diabetic Pik3r1 R649W mice. Blood glucose (A) and serum insulin (B) levels after 8 weeks of diet in the fed state and after a 16-h fast. HOMA-insulin resistance (IR) index calculated from fasting insulin and glucose levels (C), and glucose tolerance (D) and insulin tolerance (E) tests after 8 weeks on the CD or HFD. Results shown as mean ± SEM. *P < 0.05, **P < 0.01, compared with controls, t tests (n = 6–8 animals per group). F: Immunoblot analysis of insulin signaling capacity (antibodies against p-IR, IR, p-Akt, Akt, and actin) in liver tissue after 10 min of insulin (5 units) or vehicle administration.
HFD Increased Liver β-Oxidation and Inflammation in Pik3r1 R649W Mice
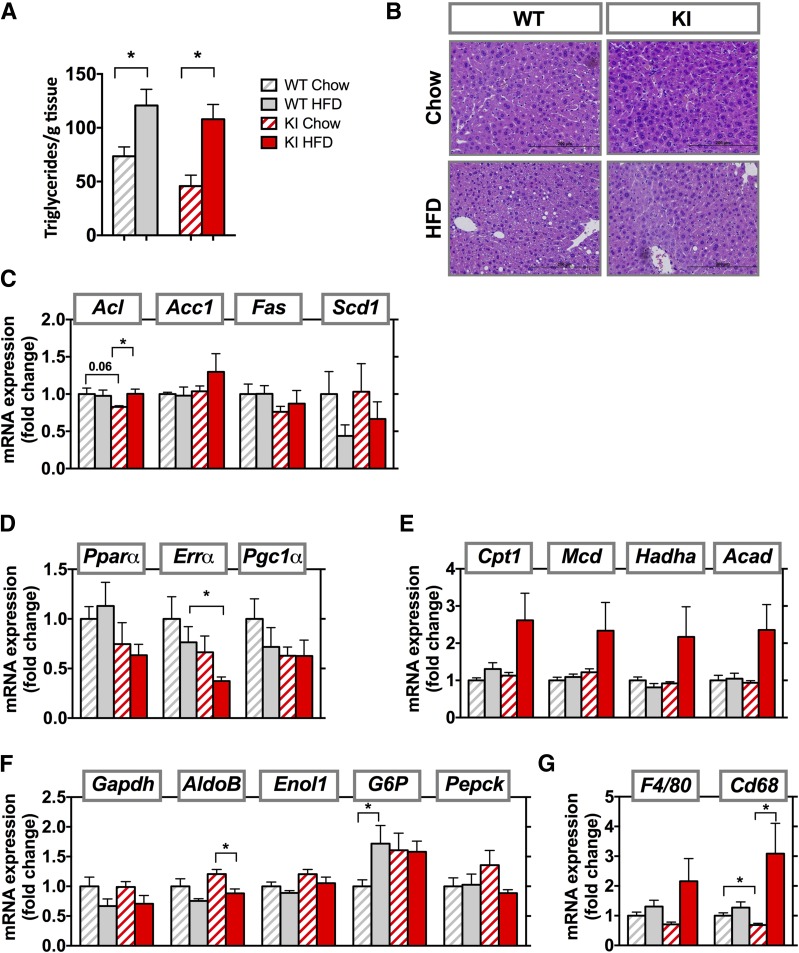
Obesity and lipodystrophy are both often accompanied by fatty liver, whereas patients with SHORT syndrome have partial lipodystrophy, but fatty liver has not been described. After 8 weeks of the HFD, however, WT and KI mice both developed fatty liver, with increases in hepatic triglycerides content of 1.6- and 2.4-fold, respectively (Fig. 5A). Liver weight did not change (Supplementary Fig. 2B), but histologic evaluation revealed lipid accumulation in liver in both groups fed the HFD, with somewhat more lipid in WT compared with KI mice (Fig. 5B). Markers of de novo lipogenesis (Acl, Acc1, Fas, and Scd1) were mostly unchanged between the groups (Fig. 5C). Expression of several regulators of fatty acid oxidation, including PPARα (Pparα), estrogen-related receptor-α (Errα), and PPARγ coactivator 1-α (Pgc1α), showed a downward trend in both genotypes after the HFD. In general, the KI CD animals also had lower levels of mRNA expression for these genes than WT animals (Fig. 5D). Expression of genes of β-oxidation, such as carnitine palmitoyltransferase I (Cpt1), malonyl-CoA decarboxylase (Mcd), hydroxyacyl-CoA dehydrogenase (Hadha), and acyl-CoA dehydrogenase (Acad), however, were 2- to 2.5-fold higher in HFD-fed KI mice compared with controls, although this did not reach statistical significance (Fig. 5E). There were no changes in expression of gluconeogenic enzymes (Gapdh, aldolase B [AldoB], enolase 1 [Enol1], glucose 6-phosphatase [G6P] or Pepck) between KI and WT mice fed either the CD or HFD (Fig. 5F). Interestingly, liver inflammation, as measured by CD68 expression, was lower in KI animals than WT animals, but increased threefold after the HFD. The same trend was observed for F4/80 mRNA expression (Fig. 5G).
Figure 5.
Increased β-oxidation and inflammation in HFD-fed Pik3r1 R649W mice. A: Liver triglycerides measured after 8 weeks of CD or HFD. B: Representative images from liver sections stained with hematoxylin and eosin. Results are shown as mean ± SEM. *P < 0.05, one-way ANOVA. mRNA expression of genes involved in de novo lipogenesis (C), fatty acid oxidation (D), β-oxidation (E), gluconeogenesis (F), and inflammation (G) in livers from WT and KI animals after 8 weeks of the CD or HFD. mRNA results are mean ± SEM of 5–6 animals per group. *P < 0.05 compared with controls, t tests.
The Pik3r1 R649W Mutation Prevents Weight Gain but Not Hyperglycemia in ob/ob Mice
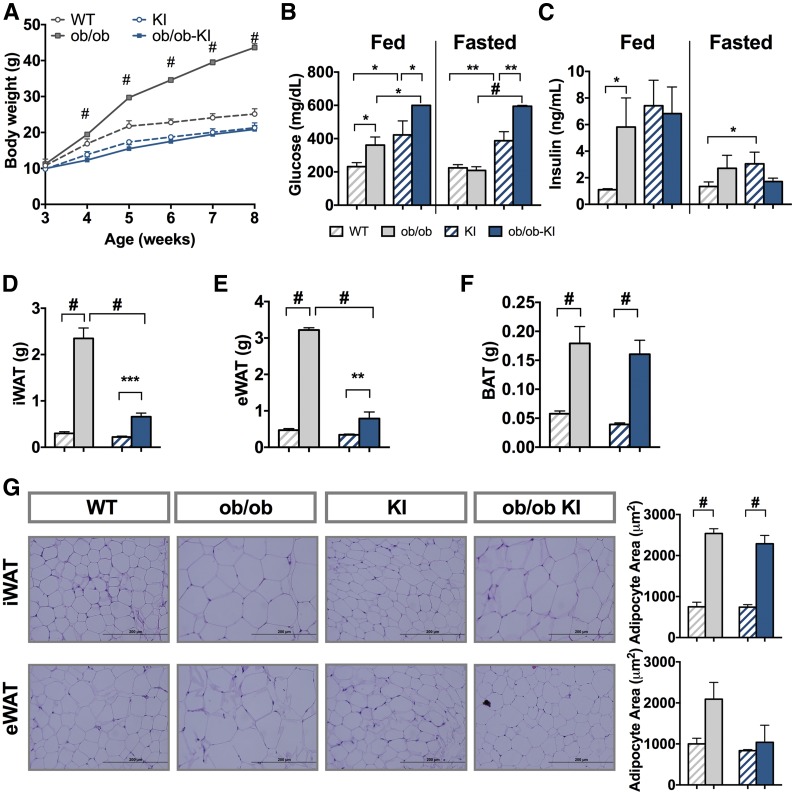
To determine whether the lower fat accumulation in heterozygous Pik3r1 R649W KI mice was restricted to diet-induced obesity, we crossed KI mice with ob/ob mice, which lack a functional leptin gene and results in extreme hyperphagia and obesity (29,30). Remarkably, the presence of the heterozygous R649W mutation completely blocked the increase in weight gain of ob/ob mice (Fig. 6A). At 8 weeks of age, KI mice were severely hyperglycemic, with blood glucose levels ∼400 mg/dL, twofold higher than WT littermates (Fig. 6B) and slightly higher than ob/ob control (∼350 mg/dL). Despite a lower body weight, the ob/ob-KI mice had much higher blood glucose levels, with values >600 mg/dL even after a 1-h fast, during which blood glucose of ob/ob control animals dropped to levels close to WT animals. In line with elevated glucose levels, ob/ob mice had fivefold higher serum insulin levels than WT mice. However, insulin levels of ob/ob-KI mice were not changed compared with the already hyperinsulinemic KI control littermates (Fig. 6C).
Figure 6.
Pik3r1 R649W mice show resistance to genetically induced obesity but worsened the diabetic phenotype. A: Body weight of WT and Pik3r1 R649W KI mice measured over 6 weeks in control mice (circles) and ob/ob mutation (squares). Results shown as mean ± SEM (n = 4–12 mice per group). #P < 0.0005, one-way ANOVA. Blood glucose (B) and serum insulin (C) levels in the fed state and after 3 h of fasting at 8 weeks of age. Results are shown as mean ± SEM of 4–12 mice per group. *P < 0.05, **P < 0.01, ***P < 0.001 #P < 0.0005, t tests. iWAT (D), eWAT (E), and BAT (F) weight at 8 weeks of age (mean ± SEM of 4–12 animals per group). **P < 0.01, ***P < 0.001, #P < 0.0005 compared with controls, one-way ANOVA. G: Formalin-fixed WAT sections from representative inguinal and epididymal depots and average adipocyte area (n = 4). Results are shown as mean ± SEM. #P < 0.0005, one-way ANOVA.
Surprisingly, regardless of the similar body weights of lean Pik3r1 KI mice and ob/ob mice carrying the KI allele, the ob/ob-KI mice had larger fat depots than the lean Pik3r1 KI mice (Fig. 6D and E). At 8 weeks of age, the iWAT of ob/ob mice was eightfold heavier than in WT mice. At the same time, ob/ob-KI mice also had threefold larger iWAT depots than KI control littermates (Fig. 6D). Similarly, the weight of eWAT was sevenfold higher in ob/ob control mice compared with WT control mice and threefold higher in ob/ob-KI compared with KI controls (Fig. 6E). BAT mass in ob/ob-KI mice was also increased fourfold compared with KI controls (Fig. 6F). Fat mass presented as percentage of total body weigh reflected similar differences (Supplementary Fig. 3D–F). Most of the differences in iWAT were due to differences in cell size. Thus, ob/ob and ob/ob-KI mice had 2.5-fold larger adipocytes in iWAT compared with their respective controls. In eWAT however, ob/ob mice had twofold larger adipocytes than their controls, whereas adipocytes in ob/ob-KI mice remained unchanged (Fig. 6G).
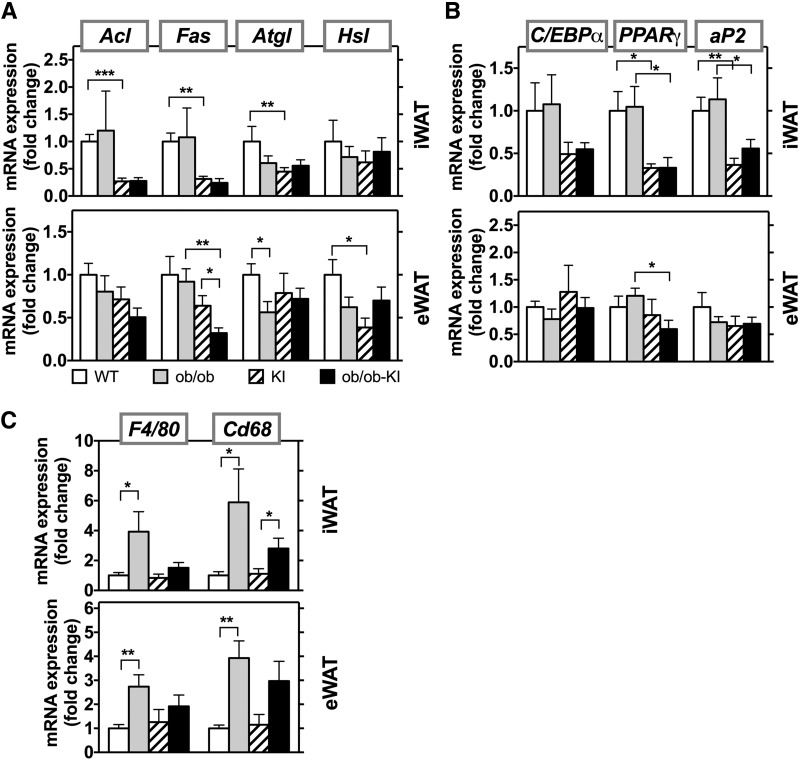
In this cohort of KI mice, there was a reduction in expression of genes of lipid metabolism in KI control mice compared with WT control mice. This was especially dramatic in iWAT, where KI mice had 75% lower levels of Acl, Fas, and stearoyl-CoA desaturase 1 (Scd1) compared with WT control (Fig. 7A, top). This reduction was not observed in the HFD-induced obesity cohorts. Whether this is due to different ages of the mice, the leptin deficiency, or slight differences in genetic background is not fully understood. Lower mRNA levels of Acl and Fas were also observed in ob/ob-KI mice. For Atgl and Hsl, all groups showed a slight decrease compared with WT controls. Similar trends were present in the epididymal fat (Fig. 7A, bottom); however, Fas was significantly lower in this depot in ob/ob-KI mice than in KI mice. In iWAT, expression of adipogenesis markers PPARγ and ap2 were significantly lower in the nonobese KI mice and ob/ob-KI mice compared with their respective controls (Fig. 7B). The ob/ob mice and WT control mice, however, had a similar expression profile for genes involved in adipogenesis, and the gene expression in ob/ob-KI mice remained low. Consistent with increased fat mass, F4/80 and CD68 gene expression was increased in the fat depots of ob/ob mice, indicating increased adipose inflammation. The expression of these markers was slightly, but not significantly, elevated in the ob/ob-KI mice (Fig. 7C).
Figure 7.
Presence of Pik3r1 R649W mutation in ob/ob mice does not change mRNA expression of regulators of lipid metabolism. mRNA expression of genes involved in lipid metabolism (A), adipocyte development (B), and inflammation (C) in the subcutaneous (top panel) and epididymal (bottom panel) fat in ob/ob and ob/ob-KI mice at 8 weeks of age. mRNA results are mean ± SEM of 4–6 animals per group. *P < 0.05, **P < 0.01, ***P < 0.001 compared with controls, t tests.
The R649W Mutation Reduces Lipid Accumulation in Livers of ob/ob Mice
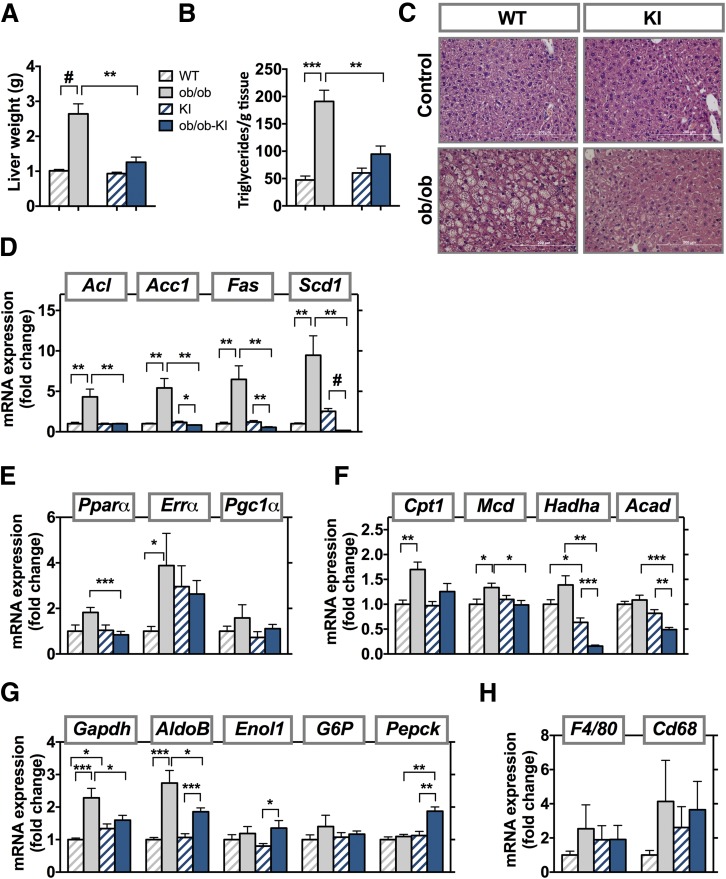
At 8 weeks of age, ob/ob mice had marked hepatomegaly, with a 2.5-fold increase in liver weight (Fig. 8A), accompanied by a 3-fold increase in hepatic triglycerides (Fig. 8B). By comparison livers of ob/ob-KI animals were not increased and showed no increase in triglyceride content (Fig. 8C). Expression of enzymes of de novo lipogenesis (Acl, Acc1, Fas, and Scd1) were elevated in ob/ob mice compared with WT control mice, but did not increase, and in some cases, such as Fas and Scd1, were significantly lower in the ob/ob-KI mice compared with their respective controls (Fig. 8D). Gene expression of Pgc1α, Pparα, and Errα showed an upward trend in ob/ob animals compared with WT animals. KI animals, both control and with leptin deficiency, had a 2.5-fold increase in Errα expression compared with the lean WT controls, with levels close to ob/ob mice (Fig. 8E). Expression of β-oxidation genes Hadha and Acad was also significantly lower in ob/ob-KI mice compared with their nonobese KI controls, whereas expression of Cpt1 and Mcd was significantly increased (Fig. 8F). The ob/ob-KI mice showed lower expression of Enol1 and AldoB than ob/ob mice but had higher Pepck expression (Fig. 8G). There were no significant changes in liver inflammation (Fig. 8H).
Figure 8.
Reduced lipid accumulation in livers of ob/ob Pik3r1 R649W mice. Liver weight (A) and liver triglycerides (B) measured at 8 weeks of age in ob/ob and ob/ob-KI mice. Results are shown as mean ± SEM. **P < 0.01, ***P < 0.001, #P < 0.0005, one-way ANOVA. C: Liver sections stained with hematoxylin and eosin. Scale bars, 200 μm. mRNA expression of genes involved in de novo lipogenesis (D), fatty acid oxidation (E), β-oxidation (F), gluconeogenesis (G), and inflammation (H) in liver at 8 weeks of age. mRNA results are mean ± SEM of four to six animals per group. *P < 0.05, **P < 0.01, ***P < 0.001, #P < 0.0005 compared with controls, t tests.
Discussion
Obesity-related insulin resistance and its metabolic consequences, such as type 2 diabetes and fatty liver disease, are increasing worldwide. Understanding the mechanisms that link obesity and insulin resistance to its complications is therefore of great importance. Interestingly, the loss of adipose tissue (i.e., lipodystrophy), is also associated with many of the metabolic disturbances of obesity. Although SHORT syndrome is a rare disease, understanding the partial lipodystrophy of SHORT syndrome provides a unique opportunity to explore the role of PI3K in adipose biology, insulin resistance, and metabolic syndrome. In recent work, we have shown that mice with a heterozygous KI of the Pik3r1 R649W mutation, the most common mutation in SHORT syndrome, have shorter body length and reduced fat mass, despite normal food consumption (24). These mice also have systemic insulin resistance, with the most dramatic effects in fat and liver.
In the current study, we show that these mice gain significantly less weight than their WT littermates when challenged with an HFD, despite having higher food intake. The R649W mutation also completely blocks weight gain in ob/ob mice. KI mice appear to not have alterations in leptin action (24), and no differences were observed in food intake or physical activity in the mice fed the CD or HFD. Rather, the higher energy expenditure that is observed in HFD-fed KI mice compared with CD-fed mice appears to be one mechanism involved in their resistance to adiposity. In both diet-induced and genetically induced weight gain, the weight differences are largely due to lower accumulation of white fat in both the subcutaneous and perigonadal depots. This reduced mass occurs despite an increase in adipocyte size similar to that in control mice in most depots, possibly as a consequence of the severe diabetic state and reduced insulin action. That the activation of PI3K and its downstream signaling by insulin and insulin-like growth factors is important in adipogenesis and adipose tissue development has been well documented (2–4). Indeed, pharmacologic inhibition of PI3K has been shown to block differentiation of preadipocytes to adipocytes by suppressing transcription of PPARγ and C/EBPα, as well by blocking the phosphorylation of FoxO1 (3,31,32). Despite the defect in p85α and the associated resistance to insulin and other growth factors in KI mice, we have previously shown that the KI mice present with normal numbers of adipocyte progenitor cells and that these preadipocytes are able to differentiate normally in vitro (24).
Although KI mice gain less weight on the HFD or after crossing onto the ob/ob background than controls, KI mice develop more marked hyperglycemia and hyperinsulinemia with these challenges, particularly the ob/ob-KI mice. We have previously shown that the R649W Pik3r1 KI animals have lost first-phase insulin secretion (24). Inhibition and knockout of PI3K is also associated with reduced insulin secretion (33). This reduction in β-cell function coupled with the more severe insulin resistance in the HFD or ob/ob-KI mice leads to the more severe hyperglycemia.
HFD-fed WT mice and KI mice fed the CD or HFD were insulin resistant as measured by insulin tolerant tests. At the insulin doses used, we were not able show any difference between HFD-fed WT and either group of KI animals. HOMA-insulin resistance values were, however, significantly increased in HFD-fed KI mice. Because the KI mice have some increase in fat mass when challenged with the HFD and the ob mutation, it appears that even with severe insulin resistance and reduced activation of the PI3K pathway, there is adequate activity of this pathway to allow excessive triglyceride storage. It is also possible that the lack of weight gain in ob/ob-KI mice is caused by loss of glucose in the urine due to their severe diabetes.
Previous studies have shown that Pik3r1 expression plays a critical role in mediating adipose tissue differentiation and insulin sensitivity. Whole-body heterozygous Pik3r1-knock-out animals, with decreased expression of p85α in all tissues, are insulin sensitive, are protected from obesity, and have reduced accumulation of macrophages in adipose tissue (27). Heterozygous Pik3r1 R649W KI mice are, by contrast, insulin resistant, but also show lower adipose tissue inflammation. This could reflect the lower adipose tissue or some defect in immune cells created by the R649W mutation.
PI3Ks are important regulators in the immune system. Deletion of p85α causes impaired B cell development and proliferation in mice (34), whereas deletion of the p110δ subunit of PI3K impairs B cell development and activation and function of B and T cells (35). Thus, the presence of the R649W mutation in the whole body could explain the low inflammation seen both in the HFD mice and in genetically induced obesity. In both obesity and lipodystrophy, excess energy accumulates as lipids at ectopic sites such as the liver, pancreas, and skeletal muscle. This contributes to the associated insulin resistance and type 2 diabetes.
Strikingly, patients with SHORT syndrome with various mutations in Pik3r1 and mice heterozygous for the Pik3r1 R649W mutation do not develop fatty livers, even with the presence of lipodystrophy (23). Likewise, severe insulin resistance develops in patients and mice with mutations in the IR, but patients with these mutations do not develop fatty liver (36,37). By contrast, patients with mutations in AKT2, the kinase downstream of PI3K, have dyslipidemia and fatty livers in addition to severe insulin resistance (38). We now find that the Pik3r1 R649W mutation has different effects on fatty liver, depending on the mechanism of obesity. After HFD feeding, WT and KI animals both show increased liver triglyceride levels, proving that the Pik3r1 R649W mutation does not completely protect from lipid accumulation at ectopic sites, although the defect is mild. Likewise, even when bred onto the ob/ob background, which normally has markedly elevated liver triglycerides and increased liver weight, the R649W KI mutation protects from fatty liver, perhaps due to reduced expression of several genes involved in lipid metabolism. Other possibilities include accumulation of lipids at other sites or differences in fatty oxidation. In this regard, HFD-fed KI mice exhibit elevated liver β-oxidation, a finding which does not occur in HFD-fed control mice or in ob/ob-KI mice. Steatosis develops when the rate of fatty acid uptake and synthesis is greater than the rate of fatty acid oxidation and secretion. Although studies in humans with nonalcoholic fatty liver disease (NAFLD) have yielded mixed results (39), there is evidence of increased rates of fatty acid oxidation in NAFLD (40,41). Insulin resistance also results in increased lipolysis in adipose tissue, increased concentration of fatty acids in the serum, and subsequently increased uptake by the liver. In an effort to compensate for increased fat deposits, liver mitochondria can increase the rate of fatty acid oxidation. Our data showing an increase in β-oxidation and an increase in liver triglycerides in KI mice after the HFD suggest changes in liver similar to NAFLD.
In summary, PI3K has divergent and critical roles in glucose and adipose tissue metabolism and plays an important role in development and function of adipose tissue. Loss of activity through the PI3K pathway due to a heterozygous dominant-negative PIK3R1 R649W mutation causes lipodystrophy and, in particular, loss of subcutaneous fat in humans and mice. Mice carrying this mutation are also protected from weight gain both by dietary excess and genetic leptin deficiency. Furthermore, despite their lipodystrophy, humans and mice with the R649W mutation are largely free from fatty liver. Heterozygous Pik3r1 knock-out animals (with p50α and p55α splice variants present) are also protected from obesity but, in contrast to the KI mice, remain insulin sensitive (28). Despite the suppressed weight gain both by diet-induced obesity and genetic obesity, glucose metabolism and diabetes significantly worsen in mice heterozygous for the Pik3r1 R649W mutation. This mutation therefore demonstrates a novel and divergent role of PI3K in glucose and adipose tissue metabolism.
Supplementary Material
Article Information
Acknowledgments. The authors thank the Physiology Core at the Joslin Diabetes Center for performing and interpreting the CLAMS and DEXA analysis.
Funding. M.H.S. was partly supported by funds from the University of Norway, the Norwegian Society of Endocrinology, Eckbo’s Foundation, and Tom Wilhelmsen Foundation. A.M. was supported by grants from the Novo Nordisk Foundation (NNF15OC0016330) and the Research Council of Norway (FRIMEDBIO 240788). P.R.N. was supported by the FP7 Ideas: European Research Council (293574), the Research Council of Norway, Stiftelsen Kristian Gerhard Jebsen, and the Western Regional Health Authorities. This work was supported by National Institute of Diabetes and Digestive and Kidney Diseases grants R01-DK-055545 (to C.R.K.) and P30-DK-036836 (to Joslin Diabetes Research Center).
Duality of Interest. No potential conflicts of interest relevant to this article were reported.
Author Contributions. M.H.S. generated the data and wrote the manuscript. J.N.W. and T.M.B. generated the data and reviewed the manuscript. A.M. and P.R.N. contributed to discussion and helped write the manuscript. C.R.K. oversaw the project, contributed to discussion, and helped write the manuscript. C.R.K. is the guarantor of this work and, as such, had full access to all the data in the study and takes responsibility for the integrity of the data and the accuracy of the data analysis.
Footnotes
This article contains Supplementary Data online at http://diabetes.diabetesjournals.org/lookup/suppl/doi:10.2337/db17-1509/-/DC1.
J.N.W. is currently affiliated with AbbVie Foundational Neuroscience Center, Cambridge, MA.
References
- 1.Engelman JA, Luo J, Cantley LC. The evolution of phosphatidylinositol 3-kinases as regulators of growth and metabolism. Nat Rev Genet 2006;7:606–619 [DOI] [PubMed] [Google Scholar]
- 2.Yu W, Chen Z, Zhang J, et al. Critical role of phosphoinositide 3-kinase cascade in adipogenesis of human mesenchymal stem cells. Mol Cell Biochem 2008;310:11–18 [DOI] [PubMed] [Google Scholar]
- 3.Tomiyama K, Nakata H, Sasa H, Arimura S, Nishio E, Watanabe Y. Wortmannin, a specific phosphatidylinositol 3-kinase inhibitor, inhibits adipocytic differentiation of 3T3-L1 cells. Biochem Biophys Res Commun 1995;212:263–269 [DOI] [PubMed] [Google Scholar]
- 4.Sakaue H, Ogawa W, Matsumoto M, et al. Posttranscriptional control of adipocyte differentiation through activation of phosphoinositide 3-kinase. J Biol Chem 1998;273:28945–28952 [DOI] [PubMed] [Google Scholar]
- 5.Garcia-Cao I, Song MS, Hobbs RM, et al. Systemic elevation of PTEN induces a tumor-suppressive metabolic state. Cell 2012;149:49–62 [DOI] [PMC free article] [PubMed] [Google Scholar]
- 6.Ortega-Molina A, Efeyan A, Lopez-Guadamillas E, et al. Pten positively regulates brown adipose function, energy expenditure, and longevity. Cell Metab 2012;15:382–394 [DOI] [PubMed] [Google Scholar]
- 7.Ortega-Molina A, Lopez-Guadamillas E, Mattison JA, et al. Pharmacological inhibition of PI3K reduces adiposity and metabolic syndrome in obese mice and rhesus monkeys. Cell Metab 2015;21:558–570 [DOI] [PMC free article] [PubMed] [Google Scholar]
- 8.Dhand R, Hara K, Hiles I, et al. PI 3-kinase: structural and functional analysis of intersubunit interactions. EMBO J 1994;13:511–521 [DOI] [PMC free article] [PubMed] [Google Scholar]
- 9.Gout I, Dhand R, Panayotou G, et al. Expression and characterization of the p85 subunit of the phosphatidylinositol 3-kinase complex and a related p85 beta protein by using the baculovirus expression system. Biochem J 1992;288:395–405 [DOI] [PMC free article] [PubMed] [Google Scholar]
- 10.Terauchi Y, Tsuji Y, Satoh S, et al. Increased insulin sensitivity and hypoglycaemia in mice lacking the p85 alpha subunit of phosphoinositide 3-kinase. Nat Genet 1999;21:230–235 [DOI] [PubMed] [Google Scholar]
- 11.Mauvais-Jarvis F, Ueki K, Fruman DA, et al. Reduced expression of the murine p85alpha subunit of phosphoinositide 3-kinase improves insulin signaling and ameliorates diabetes. J Clin Invest 2002;109:141–149 [DOI] [PMC free article] [PubMed] [Google Scholar]
- 12.Ueki K, Yballe CM, Brachmann SM, et al. Increased insulin sensitivity in mice lacking p85beta subunit of phosphoinositide 3-kinase. Proc Natl Acad Sci U S A 2002;99:419–424 [DOI] [PMC free article] [PubMed] [Google Scholar]
- 13.Ueki K, Fruman DA, Brachmann SM, Tseng YH, Cantley LC, Kahn CR. Molecular balance between the regulatory and catalytic subunits of phosphoinositide 3-kinase regulates cell signaling and survival. Mol Cell Biol 2002;22:965–977 [DOI] [PMC free article] [PubMed] [Google Scholar]
- 14.Bi L, Okabe I, Bernard DJ, Wynshaw-Boris A, Nussbaum RL. Proliferative defect and embryonic lethality in mice homozygous for a deletion in the p110alpha subunit of phosphoinositide 3-kinase. J Biol Chem 1999;274:10963–10968 [DOI] [PubMed] [Google Scholar]
- 15.Bi L, Okabe I, Bernard DJ, Nussbaum RL. Early embryonic lethality in mice deficient in the p110beta catalytic subunit of PI 3-kinase. Mamm Genome 2002;13:169–172 [DOI] [PubMed] [Google Scholar]
- 16.Fruman DA, Mauvais-Jarvis F, Pollard DA, et al. Hypoglycaemia, liver necrosis and perinatal death in mice lacking all isoforms of phosphoinositide 3-kinase p85 alpha. Nat Genet 2000;26:379–382 [DOI] [PubMed] [Google Scholar]
- 17.Urick ME, Rudd ML, Godwin AK, Sgroi D, Merino M, Bell DW. PIK3R1 (p85α) is somatically mutated at high frequency in primary endometrial cancer. Cancer Res 2011;71:4061–4067 [DOI] [PMC free article] [PubMed] [Google Scholar]
- 18.Chudasama KK, Winnay J, Johansson S, et al. SHORT syndrome with partial lipodystrophy due to impaired phosphatidylinositol 3 kinase signaling. Am J Hum Genet 2013;93:150–157 [DOI] [PMC free article] [PubMed] [Google Scholar]
- 19.Thauvin-Robinet C, Auclair M, Duplomb L, et al. PIK3R1 mutations cause syndromic insulin resistance with lipoatrophy. Am J Hum Genet 2013;93:141–149 [DOI] [PMC free article] [PubMed] [Google Scholar]
- 20.Dyment DA, Smith AC, Alcantara D, et al.; FORGE Canada Consortium . Mutations in PIK3R1 cause SHORT syndrome. Am J Hum Genet 2013;93:158–166 [DOI] [PMC free article] [PubMed] [Google Scholar]
- 21.Gorlin RJ, Cervenka J, Moller K, Horrobin M, Witkop CJ Jr. Malformation syndromes. A selected miscellany. Birth Defects Orig Artic Ser 1975;11:39–50 [PubMed] [Google Scholar]
- 22.Aarskog D, Ose L, Pande H, Eide N. Autosomal dominant partial lipodystrophy associated with Rieger anomaly, short stature, and insulinopenic diabetes. Am J Med Genet 1983;15:29–38 [DOI] [PubMed] [Google Scholar]
- 23.Avila M, Dyment DA, Sagen JV, et al. Clinical reappraisal of SHORT syndrome with PIK3R1 mutations: towards recommendation for molecular testing and management. Clin Genet 2016;89:501–506 [DOI] [PubMed] [Google Scholar]
- 24.Winnay JN, Solheim MH, Dirice E, et al. PI3-kinase mutation linked to insulin and growth factor resistance in vivo. J Clin Invest 2016;126:1401–1412 [DOI] [PMC free article] [PubMed] [Google Scholar]
- 25.Bárcena C, Quesada V, De Sandre-Giovannoli A, et al. Exome sequencing identifies a novel mutation in PIK3R1 as the cause of SHORT syndrome. BMC Med Genet 2014;15:51. [DOI] [PMC free article] [PubMed] [Google Scholar]
- 26.Solheim MH, Clermont AC, Winnay JN, et al. Iris malformation and anterior segment dysgenesis in mice and humans with a mutation in PI 3-kinase. Invest Ophthalmol Vis Sci 2017;58:3100–3106 [DOI] [PMC free article] [PubMed] [Google Scholar]
- 27.McCurdy CE, Schenk S, Holliday MJ, et al. Attenuated Pik3r1 expression prevents insulin resistance and adipose tissue macrophage accumulation in diet-induced obese mice. Diabetes 2012;61:2495–2505 [DOI] [PMC free article] [PubMed] [Google Scholar]
- 28.Terauchi Y, Matsui J, Kamon J, et al. Increased serum leptin protects from adiposity despite the increased glucose uptake in white adipose tissue in mice lacking p85alpha phosphoinositide 3-kinase. Diabetes 2004;53:2261–2270 [DOI] [PubMed] [Google Scholar]
- 29.Mayer J, Russell RE, Bates MW, Dickie MM. Metabolic, nutritional and endocrine studies of the hereditary obesity-diabetes syndrome of mice and mechanism of its development. Metabolism 1953;2:9–21 [PubMed] [Google Scholar]
- 30.Garthwaite TL, Martinson DR, Tseng LF, Hagen TC, Menahan LA. A longitudinal hormonal profile of the genetically obese mouse. Endocrinology 1980;107:671–676 [DOI] [PubMed] [Google Scholar]
- 31.Xia X, Serrero G. Inhibition of adipose differentiation by phosphatidylinositol 3-kinase inhibitors. J Cell Physiol 1999;178:9–16 [DOI] [PubMed] [Google Scholar]
- 32.Miki H, Yamauchi T, Suzuki R, et al. Essential role of insulin receptor substrate 1 (IRS-1) and IRS-2 in adipocyte differentiation. Mol Cell Biol 2001;21:2521–2532 [DOI] [PMC free article] [PubMed] [Google Scholar]
- 33.Kaneko K, Ueki K, Takahashi N, et al. Class IA phosphatidylinositol 3-kinase in pancreatic β cells controls insulin secretion by multiple mechanisms. Cell Metab 2010;12:619–632 [DOI] [PMC free article] [PubMed] [Google Scholar]
- 34.Fruman DA, Snapper SB, Yballe CM, et al. Impaired B cell development and proliferation in absence of phosphoinositide 3-kinase p85alpha. Science 1999;283:393–397 [DOI] [PubMed] [Google Scholar]
- 35.Okkenhaug K, Vanhaesebroeck B. PI3K in lymphocyte development, differentiation and activation. Nat Rev Immunol 2003;3:317–330 [DOI] [PubMed] [Google Scholar]
- 36.Musso C, Cochran E, Moran SA, et al. Clinical course of genetic diseases of the insulin receptor (type A and Rabson-Mendenhall syndromes): a 30-year prospective. Medicine (Baltimore) 2004;83:209–222 [DOI] [PubMed] [Google Scholar]
- 37.Semple RK, Soos MA, Luan J, et al. Elevated plasma adiponectin in humans with genetically defective insulin receptors. J Clin Endocrinol Metab 2006;91:3219–3223 [DOI] [PubMed] [Google Scholar]
- 38.Semple RK, Sleigh A, Murgatroyd PR, et al. Postreceptor insulin resistance contributes to human dyslipidemia and hepatic steatosis. J Clin Invest 2009;119:315–322 [DOI] [PMC free article] [PubMed] [Google Scholar]
- 39.Samuel VT, Shulman GI. Mechanisms for insulin resistance: common threads and missing links. Cell 2012;148:852–871 [DOI] [PMC free article] [PubMed] [Google Scholar]
- 40.Satapati S, Sunny NE, Kucejova B, et al. Elevated TCA cycle function in the pathology of diet-induced hepatic insulin resistance and fatty liver. J Lipid Res 2012;53:1080–1092 [DOI] [PMC free article] [PubMed] [Google Scholar]
- 41.Sanyal AJ, Campbell-Sargent C, Mirshahi F, et al. Nonalcoholic steatohepatitis: association of insulin resistance and mitochondrial abnormalities. Gastroenterology 2001;120:1183–1192 [DOI] [PubMed] [Google Scholar]
Associated Data
This section collects any data citations, data availability statements, or supplementary materials included in this article.


