

SUMMARY
Epithelial-mesenchymal-transition (EMT) is strongly implicated in tumor cell invasion and metastasis. EMT is thought to be regulated primarily at the transcriptional level through the repressive activity of EMT transcription factors. However, these classical mechanisms have been parsed out almost exclusively in vitro, leaving questions about the programs driving EMT in physiological contexts. Here, using a lineage-labeled mouse model of pancreatic ductal adenocarcinoma to study EMT in vivo, we found that most tumors lose their epithelial phenotype through an alternative program involving protein internalization rather than transcriptional repression, resulting in a “partial EMT” phenotype. Carcinoma cells utilizing this program migrate as clusters, contrasting with the single-cell migration pattern associated with traditionally-defined EMT mechanisms. Moreover, many breast and colorectal cancer cell lines utilize this alternative program to undergo EMT. Collectively, these results suggest that carcinoma cells have different ways of losing their epithelial program, resulting in distinct modes of invasion and dissemination.
Keywords: pancreatic cancer, lineage tracing, epithelial-mesenchymal transition, E-cadherin, circulating tumor cells
eTOC
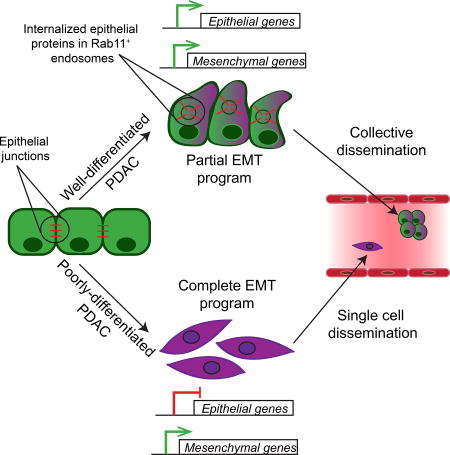
Using a lineage-traced tumor model, Aiello et al. describe a program of epithelial-to-mesenchymal transition (EMT), conserved across several carcinomas, involving re-localization of epithelial proteins rather than transcriptional repression. This alternative program leads to a “partial EMT” phenotype that promotes collective tumor cell migration and formation of circulating tumor cell clusters.
INTRODUCTION
Metastasis is responsible for most cancer-related deaths, and yet the cellular and molecular mechanisms underlying tumor cell spread remain obscure. One attractive model for metastatic dissemination involves epithelial-to-mesenchymal transition (EMT), during which epithelial cells lose their adhesive properties and acquire a fibroblast-like morphology and increased motility (Ye and Weinberg, 2015). EMT mediates multiple morphogenetic events during embryogenesis, including gastrulation and neural crest migration. In cancer, EMT has been observed in murine tumor models where it has been proposed to play a role in invasion, hematogenous dissemination, and chemoresistance (Jolly et al., 2017; Lamouille et al., 2014; Nieto et al., 2016; Ocana et al., 2012; Rhim et al., 2012; Savagner, 2015; Shah et al., 2007; Tsai et al., 2012).
EMT is thought to occur largely through changes in gene expression. Specifically, genes whose products are critical for the epithelial state – adherens junction components (e.g. E-cadherin) and tight junction components (e.g. claudins) – have been shown to be transcriptionally repressed through the action of EMT transcription factors (EMT-TFs) including Snail, Twist, and Zeb (Nieto et al., 2016). In parallel, these and other transcription factors induce the expression of genes associated with the mesenchymal state, including shifts in cadherin and intermediate filament expression. EMT has traditionally been viewed as a binary process involving a complete conversion from epithelial to mesenchymal state. However, it has been increasingly recognized that EMT also encompasses a range of hybrid states, a phenotype that has been referred to “partial EMT” (p-EMT) (Grigore et al., 2016; Jolly et al., 2017). Because p-EMT is not well defined in molecular terms (Savagner, 2015), it is unknown whether this hybrid status signifies an intermediate phase during a mesenchymal transition or represents its own end-state. Likewise, it is unclear whether the same mechanisms of transcriptional repression that drive a “complete EMT” also operate during p-EMT.
While EMT involving classical (transcription-dependent) mechanisms can give rise to single cells capable of crossing basement membranes and invading blood vessels, many tumors have been noted to exhibit “collective” migratory patterns whereby cells retain cell-cell contacts and activate mesenchymal programs, resulting in dissemination of multi-cellular tumor cell clusters (Cheung and Ewald, 2016; Friedl et al., 2012). While both phenomena have been observed in mouse models and clinical specimens (Aceto et al., 2014; Jolly et al., 2017; Maddipati and Stanger, 2015), the programs underlying these differences in epithelial plasticity and cell migration – and the extent to which p-EMT contributes to either phenotype – remain unclear.
Here, we explore the relationship between EMT, tumor subtype, and invasive phenotype in vivo. We show that in a widely-used mouse model of pancreatic ductal adenocarcinoma (PDAC), individual tumors utilize different plasticity programs – a classical EMT program involving transcriptional repression and an alternative program in which the epithelial phenotype is lost post-transcriptionally. Tumors utilizing these programs are phenotypically distinguishable at a histological and transcriptional level in a manner that correlates with the major subtypes of human PDAC. Moreover, these divergent plasticity programs are associated with either single cell invasion or collective migration. Finally, we provide evidence that the alternative program observed in PDAC governs EMT in other tumor types as well. Our findings thus suggest that the mechanisms driving EMT in vivo may differ from the classically described transcriptional programs studied in vitro and indicate a link between the broad transcriptional programs that define tumor subtype and the cellular mechanisms that shape epithelial plasticity and tumor invasion.
RESULTS
KPCY tumors exhibit two distinct EMT programs
To study the mechanism of EMT in vivo, we used the LSL-KrasG12D; P53loxP/+; Pdx1-cre; LSL-Rosa26YFP/YFP (KPCY) mouse model of PDAC. In KPCY mice, pancreas-specific Cre recombinase (Cre) activity triggers expression of a mutant KrasG12D and deletes a single p53 allele, leading to tumor formation over a period of 14–20 weeks. In parallel, Cre activates a yellow fluorescent protein (YFP) lineage label expressed in all mutated pancreatic epithelial cells, enabling tracking of their contribution to all stages of tumor progression (Rhim et al., 2012).
Loss of the adherens junction protein E-cadherin (ECAD) is considered a hallmark of EMT. To assess the EMT state of KPCY tumors, we used the YFP lineage label to distinguish between stromal cells (which are YFP−) and tumor cells (which are YFP+) and looked for histological features of EMT including separation from a lumen-associated structure and a change in cellular architecture from a cuboidal to a spindle or fibroblast-like morphology. As expected, most tumor cells (89% ± 11.9; mean ± SD) exhibiting morphological features of EMT lacked membrane ECAD staining (Figure 1A). In addition, co-staining experiments revealed a tight correlation between the loss of membrane ECAD staining and the loss of staining for the tight junction protein Claudin-7 (CLDN7) and the epithelial cell adhesion molecule (EPCAM) on YFP+ tumor cells (Figure S1A,B). These results indicate that loss of surface E-cadherin identifies most tumor cells undergoing EMT in this model.
Figure 1. Two distinct EMT programs exist among KPCY tumors.

(A) Representative image of a KPCY tumor (n=9 mice, 115 fields examined) stained for YFP (red) and ECAD (green) (DAPI nuclear counterstain, blue). Arrow: YFP+ tumor cells within epithelial structures that are positive for membranous ECAD (M-ECAD). Arrowhead: YFP+ tumor cells that have delaminated from epithelial structures and are negative for M-ECAD. Scale bar, 25µm
(B) Strategy for isolating epithelial and mesenchymal tumor cells by fluorescence activated cell sorting.
(C) Heatmap of unsupervised hierarchical clustering of expression of the 2000 most variable genes between epithelial and mesenchymal tumor cells from KPCY tumors. Tumor IDs are color-coded and listed below the heatmap, with M-ECAD+ (plus) and M-ECAD− (minus) fractions indicated.
(D) Principal components of 2000 most variable genes across all samples. Shape represents M-ECAD sorting status (Triangles = M-ECAD+, Circles = M-ECAD−) and color represents clustering identity (Orange = Cluster 1, Green = Cluster 2).
(E) Fold-difference in mRNA levels for Ecad, EpCAM, and Claudin-7 comparing mesenchymal (M-ECAD−) and epithelial (M-ECAD+) populations (TPM, transcripts per million) in tumors belonging to Cluster 1 (orange) or Cluster 2 (green).
(F) Heatmap of expression fold change for selected epithelial, mesenchymal, and extracellular matrix collagen genes comparing mesenchymal (M-ECAD−) and epithelial (M-ECAD+) populations in tumors belonging to Cluster 1 (“C-EMT”) or Cluster 2 (“P-EMT”).
See also Figures S1–S3.
Because EMT is typically associated with both gain of mesenchymal features and loss of epithelial features, we examined the ability of a series of mesenchymal markers to detect EMT in KPCY tumors. Using ECAD as an “anchor” epithelial marker, we co-stained sections for ECAD and the mesenchymal markers Zinc-finger E-box homeobox 1 (ZEB1), SLUG (SNAI2), Vimentin (VIM), and Fibroblast-specific protein 1 (FSP1). Staining for these proteins was uncommon in YFP+ECAD+ cells (Figure S1C–J), suggesting that loss of membranous ECAD (M-ECAD) precedes a gain of mesenchymal markers in most tumor cells undergoing EMT. By contrast, positive staining for these mesenchymal markers was observed in a third to a half of YFP+ECAD− tumor cells, although this staining showed a high degree of variability from tumor to tumor (Figure S1C–J). Based on these findings, we concluded that loss of M-ECAD, rather than the gain of any single mesenchymal marker, would result in the identification of most cells exhibiting morphological features of EMT in this model.
We used fluorescence-activated cell sorting (FACS) to isolate M-ECAD+ (epithelial) and M-ECAD− (mesenchymal) YFP+ cancer cells from 11 primary KPCY tumors for RNA sequencing (Figures 1B and S2A). We confirmed accurate sorting by visual inspection and ruled out contamination of non-tumor cells by performing qPCR for Cd45 and YFP (Figure S2B–D). Unsupervised hierarchical clustering and principal component analysis identified two subgroups organized independently of E-cadherin status (Figure 1C,D). Instead, tumor pairs (matched M-ECAD+ and M-ECAD− samples) tended to cluster together, with three tumors comprising one group (Cluster 1) and eight comprising another (Cluster 2). To examine how EMT may be regulated in these two clusters, we examined the transcription of epithelial and mesenchymal genes previously implicated in EMT by comparing M-ECAD− and M-ECAD+ cells. In the smaller tumor subgroup (Cluster 1; 3/11), EMT was associated with robust downregulation of mRNAs for Ecad, EpCAM, Claudin-7, and other epithelial genes, as predicted from standard EMT models (Figure 1E,F). Surprisingly, EMT in the larger subgroup (Cluster 2; 8/11) was associated with stable levels of mRNA for Ecad and other epithelial genes (Figure 1E,F) when M-ECAD+ and M-ECAD− cells were compared. Thus, loss of the epithelial program occurs in the absence of Ecad transcriptional repression in the majority of KPCY tumors evaluated.
To distinguish between these phenotypes, we applied the term “complete EMT” (C-EMT) to refer to Cluster 1 tumors, in which induction of a mesenchymal phenotype was accompanied by transcriptional repression of the epithelial program, and the term “partial EMT” (P-EMT) to refer to Cluster 2 tumors, in which tumor cells retained epithelial transcripts during the mesenchymal transition. Tumors in both subgroups exhibited robust upregulation of mesenchymal-related transcripts within the M-ECAD− population (Figure 1F), and gene set enrichment analysis (GSEA) of both C- and P-EMT samples confirmed that M-ECAD− transcriptomes correlated strongly with published EMT datasets (Figure S3A). Notably, C-EMT tumors had markedly higher expression of several EMT-associated transcription factors (Etv1, Prrx1, Zeb1, Twist1, Snai1, Snai2, and Zeb2) compared to P-EMT tumors regardless of whether M-ECAD+ or M-ECAD− cells were examined (Figure S3B,C). Thus, tumors characterized as either C-EMT or P-EMT exhibit overlapping mesenchymal programs during EMT despite repressing their epithelial programs by distinct means.
EMT programs are correlated with tumor differentiation and PDAC subtypes
Histological examination of the KPCY tumors profiled in Figure 1 revealed a striking dissimilarity between the histology of C-EMT (Figure S4A) and P-EMT (Figure S4B) tumors. Specifically, C-EMT tumors exhibited a poorly differentiated histology while P-EMT tumors exhibited a moderately- to well-differentiated histology (Table S1). We thus hypothesized that C-EMT and P-EMT programs might be associated with distinct tumor subtypes. To test this, we compared our KPCY tumor transcriptomes to published signatures for human PDAC subtypes (Bailey et al., 2016b; Collisson et al., 2011; Moffitt et al., 2015) (Figure S5). In all cases, C-EMT tumors were strongly associated with poorly-differentiated transcriptional subtypes (quasi-mesenchymal (Collisson et al., 2011), squamous (Bailey et al., 2016b), and basal-like (Moffitt et al., 2015)) while P-EMT tumors were associated with well-differentiated transcriptional subtypes (classical/exocrine-like (Collisson et al., 2011), pancreatic progenitor/ADEX (Bailey et al., 2016b), and classical (Moffitt et al., 2015))(Table S2). Hence, the mode by which the epithelial phenotype is lost in murine PDAC correlates with distinct histological and transcriptional subtypes of human PDAC.
The P-EMT program is mediated by protein re-localization
To understand how the epithelial program is repressed in different tumor subtypes, we derived a panel of cell lines from poorly- and well-differentiated KPCY tumors. To determine whether the EMT phenotypes of the cells in vitro matched their behavior in vivo, we used FACS to separate cell lines based on surface or membranous ECAD (M-ECAD) staining and then performed qPCR for Ecad mRNA (Figure 2A). Some cell lines (those derived from poorly-differentiated tumors) exhibited a robust down-regulation of Ecad mRNA when comparing M-ECAD− cells to M-ECAD+ cells (Figure 2B). By contrast, other cell lines (those derived from moderately- or well-differentiated tumors) exhibited comparable levels of Ecad mRNA in M-ECAD− versus M-ECAD+ cells (Figure 2B). Thus, cell lines derived from KPCY tumors retain the distinct EMT programs observed in vivo. Henceforth, we refer to cell lines in which EMT is associated with transcriptional repression of Ecad as “C-EMT lines” and to those cell lines in which EMT is associated with stable levels of Ecad mRNA as “P-EMT lines.”
Figure 2. P-EMT is characterized by post-transcriptional regulation of the epithelial program.

(A) Strategy for assessing E-cad mRNA and protein expression from a panel of KPCY tumor cell lines. In total, 3 C-EMT and 5 P-EMT cell lines were used.
(B) Aggregate data showing differences in E-cad mRNA abundance (by qPCR) comparing mesenchymal (M-ECAD−) and epithelial (M-ECAD+) cells from 8 murine PDAC cell lines classified as either C-EMT (N=3: PD6910, PD483, PD3077) or P-EMT (N=5: PD7591, PD798, PD7242, PD454, PD422). A marked decrease in E-cad mRNA in association with EMT is observed in C-EMT cell lines, while no decrease is observed in P-EMT cell lines.
(C) Western blot comparing epithelial protein levels in sorted M-ECAD− (E−) and M-ECAD+ (E+) cells from 2 C-EMT and 2 P-EMT PDAC cell lines.
(D) Strategy for detecting internalized E-cadherin by flow cytometry.
(E) E-cadherin internalization in murine cell lines was quantified by measuring the percentage of cells negative for membranous E-cadherin (M-ECAD−) that were positive for intracellular E-cadherin (I-ECAD+). P-EMT cell lines: PD7591, PD798 (69.8% ± 9.0; mean ± SD). C-EMT cell lines: PD483, PD3077 (0.13% ± 0.1). Each cell line was assessed in triplicate. Data are representative of at least two independent experiments for each cell line.
(F–I) Representative confocal 3-D projections of mesenchymal (F,G) and epithelial (H, I) tumor cells from P-EMT (F, H) and C-EMT (G, I) KPCY tumors. Sections were stained for YFP (red) and ECAD (green) (DAPI nuclear counterstain, blue).
(J–M) Representative confocal 3-D projections of mesenchymal (J, K) and epithelial (L, M) tumor cells from two human primary PDAC tumors. Sections were stained for ECAD (green) (DAPI nuclear counterstain, blue). Mesenchymal tumor cells are outlined for clarity.
(O–Q) Representative confocal 3-D projections of mesenchymal tumor cells from P-EMT KPCY tumors stained for ECAD (green), YFP (red), and additional epithelial proteins (grey) β-catenin (O), Claudin-7 (P), and EpCAM (Q).
Bar graph data are presented as mean ± standard deviation (SD) in this and subsequent figures. Scale bars, 10µm. Statistical differences were identified by Student’s t-test in this and all subsequent figures unless otherwise noted (*, p<0.05; **, p<0.0001).
The persistence of epithelial gene transcription in M-ECAD− negative cancer cells suggested that the epithelial program is regulated post-transcriptionally in tumor cells undergoing P-EMT. To address this possibility, we sorted KPCY cell lines into epithelial (M-ECAD+) and mesenchymal (M-ECAD−) fractions and compared levels of several epithelial proteins in whole cell lysates. As expected, the M-ECAD− fractions from C-EMT lines – harboring low levels of Ecad mRNA – had no detectable ECAD protein (Figure 2C). By contrast, ECAD protein was abundant in the M-ECAD− fractions from P-EMT lines, at levels comparable to their E+ counterparts. Other epithelial proteins, including CLDN7 and EPCAM also persisted in whole cell lysates in P-EMT cell lines that had lost M-ECAD (Figure 2C). Interestingly, levels of p120-catenin (p120), an ECAD interactor (Ireton et al., 2002; Stairs et al., 2011), did not vary between M-ECAD+ and M-ECAD− in either C- or P-EMT cell lines. Nevertheless, P-EMT cell lines expressed both the 1A (mesenchymal) and 3A (epithelial) p120 isoforms (Pieters et al., 2012) while C-EMT cell lines expressed only the 1A isoform. These data suggest that P-EMT cells continue to express components of the epithelial program at the protein level following EMT, while C-EMT cells lack both RNA and protein components of the epithelial program following EMT.
We reasoned that intracellular sequestration might account for the lack of membranous ECAD in P-EMT tumors and cell lines. To test this, we performed dual antibody immunofluorescence by first staining live cells for ECAD using the fluorophore Brilliant Violet 421 (to detect membrane-associated ECAD; M-ECAD) followed by fixation, permeabilization, and a second round of ECAD staining using the fluorophore APC (to detect intracellular ECAD; I-ECAD) (Figure 2D and Figure S6). As expected, C-EMT cells lacking membranous ECAD also lacked intracellular ECAD, consistent with the loss of Ecad mRNA and protein (Figure 2E). By contrast, most P-EMT cells lacking membranous ECAD were positive for intracellular ECAD (Figure 2E). The relocalization of ECAD was confirmed in tissue sections from KPCY mice, where intracellular ECAD staining was observed exclusively in P-EMT tumors (Figure 2F,G; epithelial cells for comparison, Figure 2H,I). Similar patterns were observed in sections from human PDAC (Figure 2J,K; epithelial cells for comparison, Figure 2L,M). Staining for other epithelial proteins, including β-catenin, Claudin-7, and EpCAM, revealed a punctate intracellular pattern similar to that of ECAD (Figure 2O–Q). Taken together, these results suggest that cells undergoing a P-EMT program retain epithelial proteins intracellularly both in vitro and in vivo.
P-EMT is associated with ECAD localization in late recycling vesicles
Turnover and endocytic regulation of surface epithelial proteins is critical to both maintenance of epithelial cell homeostasis and cell migration during EMT (Bruser and Bogdan, 2017; Corallino et al., 2015). This process is regulated by the Rab subfamily of GTPases, which mark internalized proteins for recycling or degradation following sequestration into endosomes (Delva and Kowalczyk, 2009). To further understand the mechanism of ECAD absence from the cell surface, we stained cultured P-EMT cells and found that ECAD protein was confined to intracellular foci in delaminated cells exhibiting a mesenchymal morphology (Figure 3A), suggestive of storage in endocytic complexes. To examine whether Rab family members are differentially expressed in tumors belonging to the two EMT subtypes, we measured the relative abundance of mRNAs encoding the major endocytic proteins Rab5, Rab7, and Rab11 in our tumor panel from Figure 1. In comparison to C-EMT tumors, P-EMT tumors had higher mRNA levels for the late recycling endosome protein Rab11, which is associated with storage and recycling of epithelial proteins back to the cell surface (Figure 3B). By contrast, mRNAs for Rab7, which marks endosomes targeted for lysosomal fusion and protein degradation, were more abundant in C-EMT tumors as compared to P-EMT tumors (Figure 3B).
Figure 3. Intracellular ECAD co-localizes with Rab11+ late recycling vesicles.

(A) Representative confocal images of cultured cells from a P-EMT cell line showing a colony of cells with epithelial features (left) and a delaminated spindle shaped mesenchymal cell (right) stained with ECAD and DAPI. Arrows show membranous ECAD staining pattern in epithelial cells while arrowheads show punctate cytoplasmic staining pattern in mesenchymal cells
(B) Relative mRNA expression of Rab11 (marker of late recycling vesicles), Rab5 (marker of early endosomes), and Rab7 (marker of late endosomes targeted for lysosomal degradation) in P-EMT tumors from Figure 1.
(C–E) Co-immunofluorescent staining of mesenchymal P-EMT cells (as depicted in (A)) with ECAD and Rab5, Rab7, or Rab11. Images representative of data from 20 different cells for each experiment. Mean Pearson’s correlation coefficients of colocalization are 0.18, 0.19, and 0.70 for Rab5, Rab7, and Rab11, respectively.
(*, p<0.05)
See also Figures S4–S6.
To further examine the localization of internalized ECAD during P-EMT, we co-stained P-EMT cells for ECAD and Rab5, Rab7, or Rab11 (Figure 3C–E). In cells that had undergone P-EMT (delaminated spindle shaped cells) we observed rare co-localization of ECAD with Rab5 or Rab7 (Pearson’s correlation coefficients of 0.18 and 0.19, respectively) (Figure 3C,D). By contrast, we observed prominent co-localization of ECAD with Rab11 (Pearson’s correlation coefficient of 0.70) in virtually all cells exhibiting a mesenchymal morphology (Figure 3E). These results suggest that turnover of surface ECAD during P-EMT is associated with storage in recycling endocytic vesicles.
Plasticity between epithelial and mesenchymal states is determined by EMT subtype
Epithelial-mesenchymal plasticity – both EMT and the reverse process of mesenchymal-epithelial transition (MET) – is thought to play a role in tumor cell invasion and metastasis (Nieto et al., 2016). Thus, we sought to determine whether different EMT subtypes (C-EMT vs. P-EMT) are associated with differences in cellular plasticity during EMT in vitro and in vivo. To assess the capacity of cells from either C-EMT or P-EMT cell lines to undergo EMT, we sorted M-ECAD− cells from several cell lines and monitored them for the re-expression of surface ECAD by FACS. Following re-plating of cells from P-EMT lines, most cells re-expressed M-ECAD over a period of 6–9 days (Figure 4A, green curves), consistent with their derivation from well-differentiated tumors. Likewise, a measurable (albeit smaller) fraction of cells from C-EMT lines also became positive for M-ECAD (Figure 4A, orange curves). As expected, mRNA levels for ECAD changed minimally over this timeframe in P-EMT cell lines (Figure 4A). By contrast, mRNAs for mesenchymal genes including CDH11, COLA8A2, PDGFRB, and SNAIL were downregulated as C-EMT tumor cells became positive for M-ECAD (Figure 4B). These results suggest that PDAC cells are competent to undergo MET regardless of which program they use to shed their epithelial program during EMT.
Figure 4. Features of epithelial plasticity in C-EMT and P-EMT subtypes.

(A) Kinetics of mesenchymal-to-epithelial transition (MET) in vitro. ECAD negative cells (>99% purity) were sorted from P-EMT (7591 and 798) and C-EMT (3077, 483, 832) cell lines and cultured for 9 days in standard conditions. At day 6, P-EMT and C-EMT cells were 98.07% ± 1.98 (mean ± SD) and 28.49% ± 26.40 M-ECAD+ respectively. At day 9, P-EMT and C-EMT cells were 86.75% ± 0.73 and 14.61% ± 11.38 M-ECAD+ respectively. Baseline percentage of M-ECAD+ cells prior to sorting for 7591, 798, 3077, 483, and 832 are 97%, 90%, 47%, 12%, and 6% respectively. Insert in A demonstrates stable Ecad mRNA expression in the sorted P-EMT cells from day 0 to 6. Data representative of two independent experiments with cell lines assessed in triplicate.
(B) Mesenchymal gene expression changes during recovery of the epithelial phenotype in P-EMT cells. qPCR for mesenchymal markers Cdh11, Col8a2, Pdgfrβ, and Snail was measured in sorted M-ECAD− P-EMT cells during 6 days of culture in standard conditions.
(C) Quantification of M-ECAD-expressing YFP+ cells in tumors generated from unsorted and M-ECAD-sorted KPCY tumor cell lines. C- and P-EMT cell lines were sorted based on membrane ECAD (>99% purity of M-ECAD+ or M-ECAD−) and 1 × 10⁴ cells were injected subcutaneously into NOD.SCID mice. The resulting tumors (harvested when tumors reached 1 cm diameter) were assessed for ECAD expression in YFP+ tumor cells by immunofluorescence staining and manual quantification. Data are pooled (mean ± SD) from 5 P-EMT cell lines (PD7591, PD454, PD798, PD7242, PD883) and 3 C-EMT lines (PD6910, PD483, PD3077). Unsorted P, 95.0% ± 5.3; P E+, 80.5% ± 25.3; P E−, 76.0% ± 24.5; unsorted C, 22.7% ± 32.0; C E+, 26.7% ± 33.7; C E−, 15.4% ± 13.8.
(D) Schematic summarizing the experimental design and results from (B)
(E) Representative phase-contrast images of P-EMT KPCY tumor cell lines ± TGFβ treatment (10 ng/mL, 5 days).
(F) qPCR for E-cad mRNA with TGFβ treatment or vehicle-only control (10 ng/mL, 5 days) in P-EMT KPCY tumor cell lines.
(G) Western blot for ECAD protein ± TGFβ treatment in P-EMT KPCY tumor cell lines.
(H) Quantification of M-ECAD−, I-ECAD+ cells ± TGFβ treatment by flow cytometry. PD7591, 67.1% ± 3.3; PD7591 + TGFβ, 16.5% ± 2.1; PD798, 85.6% ± 2.3; PD798 + TGFβ, 33.8% ± 2.8.
All data are representative of two or more independent experiments. *, p<0.05; **, p<0.01; ***, p<0.005; ****, p<0.001
To assess the plasticity of epithelial and mesenchymal cells in vivo, we FACS sorted M-ECAD+ and M-ECAD− populations from murine C- and P-EMT cell lines and injected them subcutaneously into NOD.SCID mice (Figure 4C). After tumors reached 1cm in size, YFP+ tumor cells were assessed for M-ECAD expression. Sorted M-ECAD+ P-EMT cells (P E+) and M-ECAD− P-EMT cells (P E−) both gave rise to well-differentiated tumors with a comparably high frequency of ECAD+ tumor cells, recapitulating the phenotype of tumors derived from parental (unsorted) P-EMT cells (Figure 4C). Conversely, sorted M-ECAD+ C-EMT cells (C E+) and M-ECAD− C-EMT cells (C E−) gave rise to poorly-differentiated tumors with a comparably low frequency of M-ECAD+ cells, recapitulating the phenotype of tumors derived from parental (unsorted) C-EMT cells (Figure 4C). These results indicate that all cell lines tested exhibit robust plasticity between the epithelial and mesenchymal states, with an equilibrium governed by cell line-specific “set points.” In P-EMT cell lines (which have an epithelial phenotype at a population level), this equilibrium is skewed to the epithelial state, whereas in C-EMT cell lines (which have a mesenchymal phenotype at a population level) this equilibrium is skewed towards a mesenchymal state (Figure 4D).
TGFβ treatment induces a C-EMT phenotype
EMT is often induced experimentally by exposing cultured cells to exogenous growth factors – most commonly TGFβ – resulting in the downregulation of transcripts for Ecad and other epithelial genes across a variety of tumor types (Zavadil and Bottinger, 2005). However, our data suggested that in the autochthonous setting, well-differentiated tumor cells undergo EMT via post-transcriptional regulation of epithelial proteins without repression of epithelial gene expression. To examine how P-EMT tumor cells respond to TGFβ stimulation, we treated two P-EMT cell lines (PD7591 and PD798) with TGFβ for a period of 5 days. This treatment resulted in morphological changes (Figure 4E) and robust down-regulation of Ecad mRNA (Figure 4F) and protein (Figure 4G). Moreover, TGFβ-treated P-EMT cells that had lost M-ECAD also lacked I-ECAD, contrasting with the marked cytoplasmic ECAD re-localization observed when such cells undergo EMT in the absence of TGFβ (Figure 4H). Thus, cells that use protein relocalization to lose their epithelial phenotype under standard culture conditions remain competent to employ classically-defined transcription dependent mechanisms when confronted with an exogenous (and overriding) growth factor signal such as TGFβ.
EMT subtypes exhibit distinct modes of tumor cell migration
Metastasis is a multi-step process that begins with cellular invasion and bloodstream entry. This process is often conceptualized as the end result of EMT leading to the dissemination of single tumor cells (Brabletz, 2012; Lamouille et al., 2014; Nieto et al., 2016; Savagner, 2015). However, evidence in several cancer types suggest that metastases can also arise from the collective migration and colonization of tumor cells (Aceto et al., 2014; Cheung and Ewald, 2016; Friedl et al., 2012; Haeger et al., 2015; Labernadie et al., 2017; Maddipati and Stanger, 2015) and may not require E-cadherin loss (Liu et al., 2014a). To determine whether different EMT programs affect the mode of cell migration during metastasis, we generated tumor spheres from C- and P-EMT cell lines, embedded them in Matrigel, and performed dynamic imaging to examine invasive behavior in real time. In the C-EMT spheres, we observed spindle-like protrusions at the edges of the primary cell mass and the invasion of single cells (Figure 5A and Movie S1). In P-EMT spheres, by contrast, tumor cells retained cell-cell contacts and invaded as a collective group, with multicellular clusters delaminating from the primary cell mass (Figure 5B and Movie S2). Importantly, while P-EMT cell lines exhibited both modes of escape from the primary cell mass (budding clusters and single cells), invasion in C-EMT cell lines was primarily by single cells.
Figure 5. EMT subtypes exhibit distinct modes of cell migration and dissemination.

(A) Time-lapse DIC microscopy of P-EMT 798 cells embedded in matrigel. Collectively migrating cells emerge from primary tumor sphere. Representative of n=15 tumor spheres from 2 independent experiments
(B) Time-lapse DIC microscopy of C-EMT 3077 cells embedded in matrigel. Collectively migrating cells emerge from primary tumor sphere. Representative of n=18 tumor spheres from 2 independent experiments
(C) Representative bright field and fluorescent images of CTCs detected in the blood stream of NOD.SCID mice following orthotopic injection of P-EMT 798 or C-EMT 3077 cells. Data representative of n=3 NOD.SCID mice per condition
(D) Comparing percentage of single and cluster CTCs/ml between P-EMT 798 or C-EMT 3077 orthotopic injections in (C). N=5 NOD.SCID mice from two independent experiments.
(E) Single CTC and cluster CTCs from blood of 3077 and 798 orthotopic mice respectively. CTCs are stained for YFP (red), ECAD (green) and DAPI (blue).
Scale bars 100µm for A and B, 25µm for (C), and 10µm for (E). *, p<0.005.
To assess whether these different patterns of cell migration impacted tumor cell entry into the bloodstream, we performed orthotopic implantation into the pancreas of NOD.SCID mice and examined the blood for evidence of circulating tumor cells (CTCs). When tumors were derived from a C-EMT cell line, >95% of the CTCs were present as single-cells (Figure 5C,D). By contrast, when tumors were derived from a P-EMT cell line, >50% of CTCs existed as tumor cell clusters (Figure 5C,D). To determine whether the persistence of ECAD protein in cell lines undergoing P-EMT might contribute to the prevalence of cell clusters, we stained CTCs and CTC clusters for ECAD. In contrast to single CTCs arising from C-EMT tumors, which lacked E-cadherin protein altogether, tumor cell clusters arising from P-EMT tumors retained staining for ECAD at points of cell-cell contact but not on the cluster surface (Figure 5E). Overall, these data suggest that EMT subtype influences the mode of cell migration, with the P-EMT subtype exhibiting both single cell and collective migration and C-EMT subtype exhibiting primarily a single-cell invasion phenotype.
C- and P-EMT subtypes are conserved across multiple human cancer cell lines
Our finding that a majority of murine pancreatic tumors utilize a post-transcriptional program to shed their epithelial phenotype prompted us to ask whether human cancer cells also employ distinct EMT programs. By cross-referencing our EMT subtype gene list to expression data from the Cancer Cell Line Encyclopedia (CCLE) (Barretina et al., 2012), we stratified several human pancreatic cancer cell lines as C-EMT or P-EMT. As expected from our mouse studies, human PDAC cell lines associated with the previously-described quasi-mesenchymal signature (Collisson et al., 2011) were predicted to have characteristics of C-EMT whereas cell lines associated with a classical signature were predicted to have characteristics of P-EMT (Figure S7A). To determine whether these classifications were associated with functional differences, we used M-ECAD staining to sort two human PDAC cell lines predicted to have a C-EMT phenotype (MIAPACA2 and PANC1) and three human PDAC cell lines predicted to have a P-EMT phenotype (BXPC3, CAPAN2, and HPAC) and examined the sorted populations for Ecad mRNA and/or M-ECAD vs.I-ECAD. Human PDAC cell lines carrying a C-EMT signature exhibited loss of Ecad mRNA and no intracellular ECAD protein upon loss of membranous ECAD (Figure 6A,B). By contrast, human PDAC cell lines exhibiting a P-EMT signature retained Ecad mRNA despite loss of membranous ECAD (Figure 6A), and a high percentage of M-ECAD-negative cells from these lines were positive for I-ECAD (Figure 6B). These data suggest that human tumor cells belonging to the quasi-mesenchymal/squamous/ basal subtype of PDAC utilize transcriptionally-dominated programs to lose their epithelial phenotype during EMT while those belonging to the classical/ pancreatic progenitor/ADEX subtype rely on protein re-localization to lose their epithelial phenotype during EMT.
Figure 6. Distinct EMT subtypes occur in human pancreas, breast, and colorectal cancer cell lines.

(A, C, E) Relative Ecad mRNA expression in human PDAC (A), breast cancer (C), and colorectal cancer (E) cell lines sorted on membranous E-cadherin.
(B, D, F) Quantification of M-ECAD−, I-ECAD+ cells within human PDAC (B), breast (D) and colorectal (F) cancer cell lines. BXPC3, 39.37 ± 3.1% 3 (mean ± SD), CAPAN2, 40.33 ± 13.1%, HPAC, 53.93 ± 1.629%, PANC1, 7.47 ± 1.9%, MIAPACA2, 1.567 ± 0.24%. MDA-MB-157, 0.12% ± 0.03; MDA-MB-231, 2.3% ± 0.30; MDA-MB-436, 0.93% ± 0.09%; BT747, 83.0 ± 1.3%; MCF7, 83.8 ± 4.7%; HCC1937, 80.6% ± 1.6; MDA-MB-468, 61.1% ± 11.3; HS675T, 0.6% ± 0.5; HS698T, 0.7% ± 0.1; DLD1, 31.6% ± 2.9; HCT116, 69.0% ± 3.7; SW480, 64.0% ± 3.4.
Each cell line was assessed in triplicate. Lines represent mean ± SD. Data are representative of at least two independent experiments for each cell line.
See also Figure S7.
We next sought to assess whether other cancer types utilize these distinct EMT programs and applied the same strategy of gene expression analysis to stratify a panel of human breast cancer (BC) and colorectal cancer (CRC) cell lines into those exhibiting a C-EMT signature and those exhibiting a P-EMT signature (Figure S7B, C). Among BC cell lines, the C-EMT signature was present in the basal-like subtype, while the P-EMT signature was associated with the luminal A/B and normal-like subtypes (Sorlie et al., 2001) (subtype information was not available for the CRC cell lines). To determine whether these classifications would accurately predict cell behavior during EMT, we sorted M-ECAD+ epithelial and M-ECAD− mesenchymal populations from a subset of these BC and CRC cancer cell lines and examined Ecad mRNA and protein localization. Consistent with our prior results, BC and CRC cell lines categorized as P-EMT retained Ecad transcripts in the M-ECAD− population (Figure 6C,D) and exhibited internalization in cells that were negative for M-ECAD (Figure 6E,F), while cell lines categorized as C-EMT had a complete loss of Ecad mRNA and protein (Figure 6C–F). Taken together, these results provide strong evidence that tumor subtype defines distinct EMT programs in several types of human carcinoma.
DISCUSSION
KPCY tumors reflect the heterogeneity of human PDAC
We found, using a panel of murine pancreatic tumors, that the KPCY autochthonous mouse model exhibits broad histological and molecular diversity, as originally described (Hingorani et al., 2005). Surprisingly, we found that these heterogeneous tumors also recapitulate the transcriptionally-defined subtypes of human PDAC (Bailey et al., 2016b; Collisson et al., 2011; Moffitt et al., 2015). At a global transcriptional level, high-grade poorly-differentiated murine tumors resembled human tumors belonging to the quasi-mesenchymal, basal, and squamous subtypes while low-grade well-differentiated murine tumors corresponded to human tumors exhibiting a classical or pancreatic progenitor transcriptional signature. Because the human signatures were based on analysis of bulk tumors, while our analysis of murine tumors relied on sorted YFP+ cells, these cross-species associations reflect similarities in the transcriptomes of the cancer cells themselves rather than signatures derived from the tumor microenvironment.
Given that all KPCY tumors carry the same founder mutations in Kras and p53, the phenotypic diversity exhibited by KPCY tumors is intriguing. Several possibilities could account for this variation. First, it is possible that well-differentiated tumors (which are associated with “partial EMT” programs) and poorly-differentiated tumors (which are associated with “complete EMT” programs) arise from different cells in the pancreas. Several studies have suggested that acinar cells constitute the major cellular source of PDAC as the result of an acinar-to-ductal metaplasia (ADM) → pancreatic intraepithelial neoplasia (PanIN) → carcinoma sequence (De La et al., 2008; Guerra et al., 2007; Habbe et al., 2008; Kopp et al., 2011). However, the Pdx1-Cre driver used in this model mediates recombination in pancreatic progenitor cells during development, meaning that multiple pancreatic lineages are exposed to the effects of mutant Kras and p53. Indeed, non-acinar cells, including cells within the ductal lineage, can also give rise to pancreatic tumors (Bailey et al., 2014; Bailey et al., 2016a; Westphalen et al., 2016). Differences in tumor subtype have recently been linked to distinct cells-of-origin in skin cancer (Latil et al., 2017), and it is enticing to speculate that a similar phenomenon contributes to the heterogeneity in tumor-related EMT phenotypes observed here. Alternatively, different oncogenic “hits” may act in combination with mutant Kras and p53 to drive tumors into one subtype or another, as has been observed in breast cancer (TCGA, 2012). Because the KPCY model provides a ready source of tumors belonging to distinct subtypes, future studies detailing subtype-specific genetic, genomic, and epigenetic correlates may lead to a better understanding of the roots of intertumoral heterogeneity.
Two broadly distinct programs drive EMT in vivo
In the setting of cancer, EMT has traditionally been viewed as a transcriptionally regulated process whereby tumor cells repress epithelial gene transcription and upregulate mesenchymal gene transcription (Brabletz, 2012; Lamouille et al., 2014; Nieto et al., 2016; Savagner, 2015; Tam and Weinberg, 2013). Recent work has called attention to the fact that EMT can also exist along a spectrum, resulting in a bi-phenotypic partial EMT state wherein tumor cells retain both epithelial and mesenchymal programs; importantly, such a hybrid state has been proposed to confer a greater ability to metastasize than a fully mesenchymal state (Jolly et al., 2015; Lambert et al., 2017; Li and Kang, 2016; Nieto et al., 2016).
Our finding that the majority of murine PDAC tumors and cell lines examined use protein re-localization rather than transcriptional repression to subdue the epithelial program provides molecular insight into epithelial-mesenchymal plasticity. These tumors exhibit low expression of EMT TFs and co-express epithelial and mesenchymal genes, consistent with a partial EMT state. Evidence for partial EMT in human cancer has been reported, as single cell analysis of head and neck tumors indicates the existence of an in vivo partial EMT program that correlates with increased metastatic potential and differs fundamentally from the EMT programs defined in vitro (Puram et al., 2017). Considering our observation that loss of the epithelial program is achieved post-transcriptionally in several human cancer cell lines, it is enticing to speculate that protein re-localization, rather than transcriptional repression, is responsible for the hybrid epithelial-mesenchymal phenotypes observed in human carcinoma.
It remains unclear whether cells that undergo P-EMT are paused in a transitional state (i.e. an intermediate stage in a mesenchymal differentiation continuum) or whether it represents a final state in its own right. While different tumors appeared to use either transcriptional or post-transcriptional programs to lose their phenotype, we found no evidence that these two programs co-exist within the same tumor, suggesting that the tendency to use either a C- or P-EMT program to undergo a mesenchymal transition is a specific and stable feature of an individual tumor. Thus, the P-EMT program described here appears to represent the end-manifestation of EMT in many KPCY tumors.
Nevertheless, we cannot rule out the possibility that tumors exhibiting a P-EMT phenotype at the time of analysis might exhibit a C-EMT phenotype at some later time point (or vice versa). Consistent with this notion, we found that P-EMT cells execute a C-EMT program when exposed to TGFβ, suggesting that signals within the tumor microenvironment may also influence the EMT phenotype. In either event, the equilibrium between the epithelial vs. mesenchymal phenotype appears to be subject to tumor cell-intrinsic “set-points,” as evidenced by the tendency of pure populations of sorted tumor cells to give rise to tumors with the same ratios of M-ECAD+ and M-ECAD− cells as the parental population, both in vivo and in vitro.
P-EMT is associated with the re-localization of ECAD and other epithelial proteins to the interior of the cancer cell, clearing its plasma membrane of molecules that facilitate cellular adhesion while preserving the capacity to redeploy such proteins to the surface. The finding that intracellular ECAD is localized to Rab11+ recycling endosomes is consistent with this notion and suggests that P-EMT involves an interruption of the last step in ECAD trafficking: the return of the protein to the plasma membrane. These findings regarding protein re-localization and epithelial-mesenchymal plasticity are consistent with prior studies relating ECAD trafficking to cell motility. ECAD is subject to substantial recycling in normal epithelial cells (Bruser and Bogdan, 2017), providing cancer cells with an alternate means to efficiently lose and re-establish their epithelial properties (Corallino et al., 2015). Indeed, post-transcriptional mechanisms have been shown to mediate EMT-like processes during normal embryonic development. During zebrafish epiboly, for example, protein endocytosis, rather than transcriptional repression, accounts for the loss of M-ECAD protein and subsequent increases in cell motility (Song et al., 2013). Similarly, mesoderm formation during sea urchin embryogenesis and mesoderm formation during mouse gastrulation rely on post-transcriptional mechanisms to downregulate ECAD protein (Wu and McClay, 2007; Zohn et al., 2006). Thus, carcinoma cells appear capable of repurposing either of two distinct developmental EMT mechanisms – transcriptional regulation or protein trafficking – to enhance their motility.
EMT subtype impacts invasion and dissemination
Our study also has implications for the mechanism of cellular invasion. Two distinct patterns of invasive growth leading to metastases have been described: single cell migration leading to dissemination of individual tumor cells, and collective (group) migration resulting in multi-cellular circulating tumor cell (CTC) clusters (Cheung and Ewald, 2016; Friedl et al., 2012; Lambert et al., 2017). We find that both modes of cell migration occur in KPCY tumors in a manner that correlates with EMT subtype. In C-EMT tumors, where cells that have undergone EMT lack ECAD protein entirely, tumor cells tend to invade and disseminate as single cells. In P-EMT tumors, by contrast, dysregulated trafficking of ECAD and other epithelial proteins allows tumor cells to retain some associative properties, resulting in cell clusters that lack epithelial features on the outer surface. The P-EMT program may thus confer tumor cells with invasive properties while simultaneously allowing them to retain intercellular cohesions that facilitate collective behavior (Cheung et al., 2013; Lambert et al., 2017; Liu et al., 2014b; Puram et al., 2017; Revenu and Gilmour, 2009; Westcott et al., 2015).
In addition, we found that these divergent EMT programs were correlated with tumor subtype in several human carcinoma lines. In breast cancer cell lines harboring a luminal-A, luminal-B, or normal-like signature, for example, EMT was associated with a persistence of ECAD mRNA and a re-localization of ECAD protein inside the cell, features of the P-EMT program. Cell lines harboring a basal signature, by contrast, had complete loss of ECAD mRNA and protein. These results suggest that the mechanisms by which tumors undergo EMT and invasive spread are dictated at least in part by the same broad molecular programs that determine their subtypes across a variety of carcinomas.
These differences in EMT programs are likely to translate into different invasive mechanisms. Specifically, tumors associated with a P-EMT program may be predisposed to form CTC clusters, a notion that is consistent with the finding that P-EMT cell lines gave rise to CTC clusters more readily than C-EMT cell lines. Our results are also in line with the findings of Gampieri et al., who showed that TGFβ signaling in breast cancer cells prompted a switch from collective to single cell migration (Giampieri et al., 2009) – a phenomenon that we hypothesize is attributable to a switch from a P-EMT to a C-EMT program. Considering the observation that tumor cell clusters display enhanced metastatic potential compared to single cells (Aceto et al., 2014; Cheung and Ewald, 2016; Maddipati and Stanger, 2015), it is tempting to speculate that tumors exhibiting a P-EMT phenotype might exhibit an increased metastatic rate compared to tumors exhibiting a C-EMT phenotype. However, the factors governing metastasis and patient survival are complex and multifaceted, reflecting the ability of tumor cells to overcome many challenges besides invasion. Thus, while these EMT programs are likely to be relevant for the invasive mechanisms utilized by a given tumor, the relationships between C-EMT, P-EMT, and clinical outcome remain to be defined. Likewise, considering the finding that tumor cells with different degrees of epithelial-mesenchymal plasticity are prone to metastasize to different sites (Reichert et al., this issue), the extent to which the divergent EMT programs described here contribute to metastatic organotropism also remains to be explored.
STAR Methods
CONTACT FOR REAGENT AND RESOURCE SHARING
Further information and requests for resources and reagents should be directed to and will be fulfilled by the Lead Contact, Ben Z. Stanger (bstanger@exhange.upenn.edu).
EXPERIMENTAL MODEL AND SUBJECT DETAILS
Mouse Strains
KrasLSL-G12D; p53L/+; Pdx1-cre; Rosa26YFP/YFP (KPCY) mice have been described previously (Rhim et al., 2012). Mice were palpated and examined for evidence of morbidity twice per week. Tumor-bearing animals were sacrificed when moribund. NOD.SCID mice were used for tumor cell injection experiments as KPCY cell lines are of mixed background and would be rejected by an immuno-competent animal. Both male and female KPCY and NOD/SCID animals were used in this study. Tumors were examined by a GI Pathologist (E.E.F.) and categorized as moderately-to-well- or poorly-differentiated based on the predominant histology following examination of multiple regions. Mice were housed in standard microisolator cages and chow with a 12 hour light cycle. All vertebrate animals were maintained and experiments were conducted in compliance with the National Institutes of Health guidelines for animal research and approved by the University of Pennsylvania Institutional Animal Care and Use Committee.
Cell lines
Murine PDAC cell lines PD7591 (female), PD798 (male), PD454 (male), PD7242 (unknown), PD883 (male), PD6910 (female), PD483 (female) and PD3077 (male) were derived from primary KPCY tumors. The PD832 (male) cell line was obtained from the ascites fluid of KPCX mice (Maddipati and Stanger, 2015). The C- and P-EMT status of all cells was confirmed by RT-PCR for Ecad mRNA after sorting as well as and intracellular staining for ECAD. Human PDAC cell lines Capan2, HPAC, Bxpc3, and Panc1 were provided by Dr. Anil Rustgi, University of Pennsylvania. Human breast cancer cell lines MCF7, BT474 and MDA-MB-453 were provided by Dr. Erica Carpenter, University of Pennsylvania. Human breast cancer cell lines MDA-MB-157, MDA-MB-231, MDA-MB-436, MDA-MB-468 and HCC1937 were provided by Dr. Andy Minn, University of Pennsylvania. Human colorectal cancer cell lines DLD1, HCT116 and SW480 were provided by Dr. Anil Rustgi, University of Pennsylvania. Human colorectal cancer cell lines Hs255T (CRL-7213), Hs675T (CRL-7400) and Hs698T (CRL-7435) were purchased directly from ATCC. All human lines provided by previously mentioned investigators were originally obtained from ATCC. Human cell lines were authenticated by the University of Arizona Genetics Core. Cell lines were regularly tested for mycoplasma using MycoAlert Mycoplasma Detection Kit (Lonza).
Murine cell lines were cultured in Dulbeccos’ Modified Eagle Medium/F12 medium supplemented with 5 mg/mL D-glucose (Invitrogen), 0.1 mg/mL soybean trypsin inhibitor type I (Invitrogen), 5 mL/L insulin-transferrin-selenium (ITS Premix; BD Biosciences), 25 µg/mL bovine pituitary extract (Gemini Bio-Products), 5 nmol/L 3,3′,5-triiodo-L-thyronine (Sigma), 1 µmol/L dexamethasone (Sigma), 100 ng/mL cholera toxin (Sigma), 10 mmol/L nicotinamide (Sigma), 5% Nu-serum IV culture supplement (ThermoFisher Scientific), and antibiotics (gentamicin 150 µg/mL, Gibco; amphotericin B 0.25 µg/mL, Invitrogen). Human cell lines were cultured in 10% Dulbecco’s Modified Eagle Medium supplemented to 10% decomplemented fetal bovine serum at 37°C, 5% CO2, 21% O2 and 100% humidity. Cell lines were maintained and passaged according to ATCC recommended procedures.
METHOD DETAILS
Immunofluorescence
Tissues were fixed in Zn-formalin and embedded in paraffin prior to staining. Sections were deparaffinized, rehydrated and subjected to antigen retrieval. For staining cell lines, cells were fixed in 4% paraformaldehyde for 15 mins. For staining, sections and fixed cells were blocked in 5% donkey serum for 1 hour at room temperature (RT), incubated with primary antibodies for 1 hour at RT, washed, incubated with secondary antibodies for 1 hour at RT, washed and mounted. Primary antibodies used include goat anti-GFP (Abcam), rat anti-Ecadherin (Takara Bio), rabbit anti-Zeb1 (Santa Cruz), rabbit anti-Slug (gift of Dr. Joel Habener), rabbit anti-Vimentin (Cell Signaling Technologies), rabbit anti-Fsp1 (DAKO), rabbit anti-Rab5 (Cell Signaling Technologies), rabbit anti-Rab7 (Cell Signaling Technologies), rabbit anti-Rab11 (Cell Signaling Technologies), rabbit anti-EpCAM (Abcam), rabbit anti-Claudin-7 (Abcam), and rabbit anti-B-catenin (Cell Signaling Technologies). Zeb1 required additional tyramide signaling amplification (PerkinElmer). Slides were visualized using an Olympus IX71 inverted multicolor fluorescent microscope equipped with a DP71 camera. Select slides were also visualized using a Zeiss LSM 710 confocal microscope with Zen 2011 software.
Flow cytometry
For surface/intracellular E-cadherin staining of KPCY tumor cell lines, cells were stained with rat anti-E-cadherin (Takara Bio, clone M108) at 1:250 and Brilliant Violet 421 goat anti-rat (Biolegend) at 1:100 for 15 min. at 4°C in the dark for each step with three washes between. Cells were then fixed and permeabilized using Foxp3/Transcription Factor Staining Buffer Set (eBioscience) according to the manufacturer’s instructions. Cells were then stained with rat anti-E-cadherin again at 1:250 and APC donkey anti-rat (Jackson Immunoresearch) at 1:100 for 15 min. at 4°C in the dark for each step with three washes between. Finally, the cells were resuspended in 5% FCS in PBS and analyzed on a BD LSR II flow cytometer.
Fluorescence-Activated Cell Sorting (FACS)
To create a single cell suspension, pancreatic tumor tissue was rinsed in cold, sterile 1× PBS before mincing with scissors (approximately 100 chops). The minced pieces were then incubated in preheated collagenase with protease inhibitors (2 mg/ml; Sigma) for 20 min at 37°C. Vigorous vortexing was performed ev ery 5 min during this incubation. The dissolved pieces were then poured over a 70 µM cell strainer and large pieces were mechanically broken down. The flow through was resuspended in cold DMEM/F12, centrifuged, washed once, and kept on ice in the dark. The cells were then stained with rat anti-E-cadherin (1:250; Takara Bio, clone M108) for 15 minutes at 4°C in the dark, followed by three 5 minute washes in 5% FCS in PBS and incubation with APC donkey anti-rat (1:100; Jackson Immunoresearch) prior to FACS (FACSVantage with FACSDiva option, BD).
RNA isolation, library construction, and next-generation sequencing
RNAseq libraries were prepared using the Clontech Ultra low RNA kit – HV, with 12 cycles of PCR for cDNA amplification, and the Clontech Low Input Kit for library prep, with 9 cycles of PCR amplification, following the manufacturer’s protocol. The amplified library was purified using AMPure beads, quantified by Qubit and QPCR, and visualized in an Agilent Bioanalyzer. The libraries were pooled equimolarly, and loaded on either one rapid run HiSeq 2500 flow cell, onboard clustering protocol, or on HiSeq 2500 high output flow cell lanes, as paired 50 nucleotide reads.
Sequencing alignment, differential gene expression and clustering analysis
The quality of raw reads was assessed using Fastqc (v0.11; Babraham Bioinformatics). Reads passing quality control were aligned to the mouse genome version UCSC GRCm38/mm10 with STAR (v2.3.1)(Dobin et al., 2013) using default parameters. Total reads, with alignment quality of at least 10, mapping to each gene were counted using HTseq-count(Anders et al., 2015) and GRCm38/mm10 gene annotation files. Differential gene expression analysis was performed using the R/Bioconductor package DESeq2 (Love et al., 2014). Genes with Benjamini-Hochberg adjusted P values ≤ 0.1 and absolute log2 fold change ≥ 1.0 were considered differentially expressed. As an alternate approach to obtain gene and transcript level abundances, transcripts per million (TPM) were calculated using RSEM (v1.2.18) (Li and Dewey, 2011) with default parameters. Microarray expression data for human pancreatic cancer cell lines were obtained from the Cancer Cell Line Encyclopedia (Barretina et al., 2012).
Gene expression Heat Maps and Box Plot Generation
For unsupervised hierarchical clustering and heat map generation, variance-stabilized expression values were clustered using average linkage with distance metric equal to 1 minus the Pearson correlation coefficient using the 2000 genes with the most variable expression levels. To visualize expression of specific genes involved in EMT, the log2 ratio of normalized TPM values between paired mesenchymal (YFP+/M-Ecad−) and epithelial (YFP+/M-Ecad+) fractions from each individual tumor sample were plotted with ggplot2 in R. Markers specific for epithelial cells, mesenchymal cells and EMT transcription factors were selected from published literature (Lamouille et al., 2014; Nieto et al., 2016).
Gene Set Enrichment Analysis
Gene expression signatures from published EMT profiles (Anastassiou et al., 2011; Gotzmann et al., 2006; Jechlinger et al., 2003) were obtained from GSEA/MSigDB. Gene set lists corresponding to established PDAC subtypes were obtained from original publications (Bailey et al., 2016b; Collisson et al., 2011; Moffitt et al., 2015). Statistical tests and enrichment association was calculated using Gene Set Enrichment Analysis (GSEA v.2.2.0).
RNA isolation and qPCR
Total RNA was extracted from samples consisting of less than 5 × 10⁵ cells using the RNeasy Micro Kit (Qiagen), while samples consisting of greater than 5 × 10⁵ cells were subjected to the RNeasy Mini Kit (Qiagen). High Capacity cDNA Reverse Transcription Kit (Life Technologies) was used to generate cDNA. qPCR was performed with SsoAdvanced SYBR (BioRad) using a CFX384 Real-Time System (BioRad). Transcript quantities were determined using the difference of Ct method and values were normalized to Gapdh. Primary sequences are listed in Table S3.
Tumor sphere invasion assay
Murine PDAC cell lines PD798, PD7591, PD3077, and PD832 were plate at 5000cells/well in 96-well ultra-low attachment plate (Corning) media for 2 days to enable sphere formation. Equal amounts of matrigel was then added to each well and cells were incubated for 3 days at 37°C, 5% CO2, 21% O2 a nd 100% humidity. Live imaging was then performed for 72hrs in a humidified chamber at 37°C, 5% CO2. Imaging was performed using the Olympus IX81 microscope with Brightfield/DIC and automated stage for imaging multiple stage positions.
Analysis of circulating tumor cells
Blood was isolated from orthotopic tumor bearing mice via cardiac puncture with a 1-ml insulin syringe containing 100ul of 1mg/ml heparin sulfate (Sigma-Aldrich, H3149) to prevent coagulation. Fluid was immediately placed in a 100cm gridded plate (BD Falcon) containing RBC lysis buffer (BD biosciences). Following 10 minutes of lysis, PBS was added to the plate and CTCs were directly visualized on a fluorescent microscope and imaged. CTC immunofluorescence was performed by manual isolation of CTCs under microscope visualization followed by embedding in matrigel. Cells were then fixed and stained for E-cadherin and YFP and visualized by confocal microscopy.
Human Specimens
De-identified primary PDAC tissue samples were obtained from patients who consented to a research autopsy in association with the IRB approved Johns Hopkins Rapid Medical Donation Program (PMID: 19273710).
QUANTIFICATION AND STATISTICAL ANALYSIS
Differences between two groups were analyzed by two-tailed Student’s t-test unless otherwise noted. All statistical analyses were performed using GraphPad Prism 6 (GraphPad, La Jolla, CA).
DATA AND SOFTWARE AVAILABILITY STATEMENT
RNAseq data reported in Figure 1 and Supplementary Figure S3 has been deposited into the NCBI SRA database with the SRA accession: SRP144501.
Supplementary Material
Supplemental Movie S1, Related to Figure 5
Time-lapse DIC microscopy of C-EMT 3077 cells embedded in Matrigel as represented in Figure 5A. Representative of n=14 tumor spheres from 2 independent experiments.
Supplemental Movie S2, Related to Figure 5
Time-lapse DIC microscopy of P-EMT 7591 cells embedded in matrigel. Representative of n=20 tumor spheres from 2 independent experiments.
Highlights.
-
-
Pancreatic carcinoma cells use two distinct programs to undergo EMT
-
-
Transcriptional repression of epithelial genes mediates EMT in a minority of tumors
-
-
Re-localization of epithelial proteins mediates EMT in a majority of tumors
-
-
Different EMT programs are associated with different modes of invasion
Acknowledgments
The authors thank H. Pletcher in the Penn Flow Cytometry Core, J. Wang in the AFCRI Histology Core, members of the P30 Center Molecular Pathology and Imaging core, C. Yang for helping to maintain the KPCY colony, C. Iacobuzio-Donahue for providing human PDAC tissue sections, A. Rustgi for reading the manuscript, and all members of the Stanger laboratory for helpful discussions.
Grant Support
This work was supported by the NIH (R01-CA169123 to B.Z.S., F31-CA177163-01A1 to N.M.A., and K12-CA076931 and K08-DK109292 to R.M.) the American Cancer Society (Postdoctoral Fellowship to D.B.), and in part by the Penn Center for Molecular Studies in Digestive and Liver Diseases (P30-DK050306) from the National Institute of Diabetes and Digestive and Kidney Diseases and the Genome Technology Center and Cancer Center Support Grant (P30-CACA016087) at the Laura and Isaac Perlmutter Cancer Center at NYU.
Footnotes
Publisher's Disclaimer: This is a PDF file of an unedited manuscript that has been accepted for publication. As a service to our customers we are providing this early version of the manuscript. The manuscript will undergo copyediting, typesetting, and review of the resulting proof before it is published in its final citable form. Please note that during the production process errors may be discovered which could affect the content, and all legal disclaimers that apply to the journal pertain.
Authors’ Contributions
Conceptualization, N.M.A., R.M., R.J.N., and B.Z.S.; Methodology, N.M.A., D.B., R.M., R.J.N., and B.Z.S.; Investigation, N.M.A., T.B., R.J.N., J.L., S.Y., R.M., A.S., T.Y., and D.B.; Formal Analysis, N.M.A., D.B., R.M., R.J.N., and E.E.F.; Writing— Original Draft, N.M.A., D.B., and B.Z.S.; Writing—Review and Editing, N.M.A., R.M., R.J.N., and B.Z.S.; Supervision, B.Z.S.
Declaration of Interest
The authors declare no competing interests.
References
- Aceto N, Bardia A, Miyamoto DT, Donaldson MC, Wittner BS, Spencer JA, Yu M, Pely A, Engstrom A, Zhu H, et al. Circulating tumor cell clusters are oligoclonal precursors of breast cancer metastasis. Cell. 2014;158:1110–1122. doi: 10.1016/j.cell.2014.07.013. [DOI] [PMC free article] [PubMed] [Google Scholar]
- Anastassiou D, Rumjantseva V, Cheng W, Huang J, Canoll PD, Yamashiro DJ, Kandel JJ. Human cancer cells express Slug-based epithelial-mesenchymal transition gene expression signature obtained in vivo. BMC Cancer. 2011;11:529. doi: 10.1186/1471-2407-11-529. [DOI] [PMC free article] [PubMed] [Google Scholar]
- Anders S, Pyl PT, Huber W. HTSeq--a Python framework to work with high-throughput sequencing data. Bioinformatics. 2015;31:166–169. doi: 10.1093/bioinformatics/btu638. [DOI] [PMC free article] [PubMed] [Google Scholar]
- Bailey JM, Alsina J, Rasheed ZA, McAllister FM, Fu YY, Plentz R, Zhang H, Pasricha PJ, Bardeesy N, Matsui W, et al. DCLK1 marks a morphologically distinct subpopulation of cells with stem cell properties in preinvasive pancreatic cancer. Gastroenterology. 2014;146:245–256. doi: 10.1053/j.gastro.2013.09.050. [DOI] [PMC free article] [PubMed] [Google Scholar]
- Bailey JM, Hendley AM, Lafaro KJ, Pruski MA, Jones NC, Alsina J, Younes M, Maitra A, McAllister F, Iacobuzio-Donahue CA, et al. p53 mutations cooperate with oncogenic Kras to promote adenocarcinoma from pancreatic ductal cells. Oncogene. 2016a;35:4282–4288. doi: 10.1038/onc.2015.441. [DOI] [PubMed] [Google Scholar]
- Bailey P, Chang DK, Nones K, Johns AL, Patch AM, Gingras MC, Miller DK, Christ AN, Bruxner TJ, Quinn MC, et al. Genomic analyses identify molecular subtypes of pancreatic cancer. Nature. 2016b;531:47–52. doi: 10.1038/nature16965. [DOI] [PubMed] [Google Scholar]
- Barretina J, Caponigro G, Stransky N, Venkatesan K, Margolin AA, Kim S, Wilson CJ, Lehar J, Kryukov GV, Sonkin D, et al. The Cancer Cell Line Encyclopedia enables predictive modelling of anticancer drug sensitivity. Nature. 2012;483:603–607. doi: 10.1038/nature11003. [DOI] [PMC free article] [PubMed] [Google Scholar]
- Brabletz T. To differentiate or not--routes towards metastasis. Nat Rev Cancer. 2012;12:425–436. doi: 10.1038/nrc3265. [DOI] [PubMed] [Google Scholar]
- Bruser L, Bogdan S. Adherens Junctions on the Move-Membrane Trafficking of E-Cadherin. Cold Spring Harbor perspectives in biology. 2017;9 doi: 10.1101/cshperspect.a029140. [DOI] [PMC free article] [PubMed] [Google Scholar]
- Cheung KJ, Ewald AJ. A collective route to metastasis: Seeding by tumor cell clusters. Science. 2016;352:167–169. doi: 10.1126/science.aaf6546. [DOI] [PMC free article] [PubMed] [Google Scholar]
- Cheung KJ, Gabrielson E, Werb Z, Ewald AJ. Collective invasion in breast cancer requires a conserved basal epithelial program. Cell. 2013;155:1639–1651. doi: 10.1016/j.cell.2013.11.029. [DOI] [PMC free article] [PubMed] [Google Scholar]
- Collisson EA, Sadanandam A, Olson P, Gibb WJ, Truitt M, Gu S, Cooc J, Weinkle J, Kim GE, Jakkula L, et al. Subtypes of pancreatic ductal adenocarcinoma and their differing responses to therapy. Nature medicine. 2011;17:500–503. doi: 10.1038/nm.2344. [DOI] [PMC free article] [PubMed] [Google Scholar]
- Corallino S, Malabarba MG, Zobel M, Di Fiore PP, Scita G. Epithelial-to-Mesenchymal Plasticity Harnesses Endocytic Circuitries. Frontiers in oncology. 2015;5:45. doi: 10.3389/fonc.2015.00045. [DOI] [PMC free article] [PubMed] [Google Scholar]
- De La OJ, Emerson LL, Goodman JL, Froebe SC, Illum BE, Curtis AB, Murtaugh LC. Notch and Kras reprogram pancreatic acinar cells to ductal intraepithelial neoplasia. Proceedings of the National Academy of Sciences of the United States of America. 2008;105:18907–18912. doi: 10.1073/pnas.0810111105. [DOI] [PMC free article] [PubMed] [Google Scholar]
- Delva E, Kowalczyk AP. Regulation of cadherin trafficking. Traffic. 2009;10:259–267. doi: 10.1111/j.1600-0854.2008.00862.x. [DOI] [PMC free article] [PubMed] [Google Scholar]
- Dobin A, Davis CA, Schlesinger F, Drenkow J, Zaleski C, Jha S, Batut P, Chaisson M, Gingeras TR. STAR: ultrafast universal RNA-seq aligner. Bioinformatics. 2013;29:15–21. doi: 10.1093/bioinformatics/bts635. [DOI] [PMC free article] [PubMed] [Google Scholar]
- Friedl P, Locker J, Sahai E, Segall JE. Classifying collective cancer cell invasion. Nature cell biology. 2012;14:777–783. doi: 10.1038/ncb2548. [DOI] [PubMed] [Google Scholar]
- Giampieri S, Manning C, Hooper S, Jones L, Hill CS, Sahai E. Localized and reversible TGFbeta signalling switches breast cancer cells from cohesive to single cell motility. Nature cell biology. 2009;11:1287–1296. doi: 10.1038/ncb1973. [DOI] [PMC free article] [PubMed] [Google Scholar]
- Gotzmann J, Fischer AN, Zojer M, Mikula M, Proell V, Huber H, Jechlinger M, Waerner T, Weith A, Beug H, et al. A crucial function of PDGF in TGF-beta-mediated cancer progression of hepatocytes. Oncogene. 2006;25:3170–3185. doi: 10.1038/sj.onc.1209083. [DOI] [PubMed] [Google Scholar]
- Grigore AD, Jolly MK, Jia D, Farach-Carson MC, Levine H. Tumor Budding: The Name is EMT. Partial EMT. Journal of clinical medicine. 2016;5 doi: 10.3390/jcm5050051. [DOI] [PMC free article] [PubMed] [Google Scholar]
- Guerra C, Schuhmacher AJ, Canamero M, Grippo PJ, Verdaguer L, Perez-Gallego L, Dubus P, Sandgren EP, Barbacid M. Chronic pancreatitis is essential for induction of pancreatic ductal adenocarcinoma by K-Ras oncogenes in adult mice. Cancer Cell. 2007;11:291–302. doi: 10.1016/j.ccr.2007.01.012. [DOI] [PubMed] [Google Scholar]
- Habbe N, Shi G, Meguid RA, Fendrich V, Esni F, Chen H, Feldmann G, Stoffers DA, Konieczny SF, Leach SD, et al. Spontaneous induction of murine pancreatic intraepithelial neoplasia (mPanIN) by acinar cell targeting of oncogenic Kras in adult mice. Proceedings of the National Academy of Sciences of the United States of America. 2008;105:18913–18918. doi: 10.1073/pnas.0810097105. [DOI] [PMC free article] [PubMed] [Google Scholar]
- Haeger A, Wolf K, Zegers MM, Friedl P. Collective cell migration: guidance principles and hierarchies. Trends Cell Biol. 2015;25:556–566. doi: 10.1016/j.tcb.2015.06.003. [DOI] [PubMed] [Google Scholar]
- Hingorani SR, Wang L, Multani AS, Combs C, Deramaudt TB, Hruban RH, Rustgi AK, Chang S, Tuveson DA. Trp53R172H and KrasG12D cooperate to promote chromosomal instability and widely metastatic pancreatic ductal adenocarcinoma in mice. Cancer Cell. 2005;7:469–483. doi: 10.1016/j.ccr.2005.04.023. [DOI] [PubMed] [Google Scholar]
- Ireton RC, Davis MA, van Hengel J, Mariner DJ, Barnes K, Thoreson MA, Anastasiadis PZ, Matrisian L, Bundy LM, Sealy L, et al. A novel role for p120 catenin in E-cadherin function. The Journal of cell biology. 2002;159:465–476. doi: 10.1083/jcb.200205115. [DOI] [PMC free article] [PubMed] [Google Scholar]
- Jechlinger M, Grunert S, Tamir IH, Janda E, Ludemann S, Waerner T, Seither P, Weith A, Beug H, Kraut N. Expression profiling of epithelial plasticity in tumor progression. Oncogene. 2003;22:7155–7169. doi: 10.1038/sj.onc.1206887. [DOI] [PubMed] [Google Scholar]
- Jolly MK, Boareto M, Huang B, Jia D, Lu M, Ben-Jacob E, Onuchic JN, Levine H. Implications of the Hybrid Epithelial/Mesenchymal Phenotype in Metastasis. Frontiers in oncology. 2015;5:155. doi: 10.3389/fonc.2015.00155. [DOI] [PMC free article] [PubMed] [Google Scholar]
- Jolly MK, Ware KE, Gilja S, Somarelli JA, Levine H. EMT and MET: necessary or permissive for metastasis? Molecular oncology. 2017;11:755–769. doi: 10.1002/1878-0261.12083. [DOI] [PMC free article] [PubMed] [Google Scholar]
- Kopp JL, Dubois CL, Schaffer AE, Hao E, Shih HP, Seymour PA, Ma J, Sander M. Sox9+ ductal cells are multipotent progenitors throughout development but do not produce new endocrine cells in the normal or injured adult pancreas. Development. 2011;138:653–665. doi: 10.1242/dev.056499. [DOI] [PMC free article] [PubMed] [Google Scholar]
- Labernadie A, Kato T, Brugues A, Serra-Picamal X, Derzsi S, Arwert E, Weston A, Gonzalez-Tarrago V, Elosegui-Artola A, Albertazzi L, et al. A mechanically active heterotypic E-cadherin/N-cadherin adhesion enables fibroblasts to drive cancer cell invasion. Nature cell biology. 2017;19:224–237. doi: 10.1038/ncb3478. [DOI] [PMC free article] [PubMed] [Google Scholar]
- Lambert AW, Pattabiraman DR, Weinberg RA. Emerging Biological Principles of Metastasis. Cell. 2017;168:670–691. doi: 10.1016/j.cell.2016.11.037. [DOI] [PMC free article] [PubMed] [Google Scholar]
- Lamouille S, Xu J, Derynck R. Molecular mechanisms of epithelial-mesenchymal transition. Nat Rev Mol Cell Biol. 2014;15:178–196. doi: 10.1038/nrm3758. [DOI] [PMC free article] [PubMed] [Google Scholar]
- Latil M, Nassar D, Beck B, Boumahdi S, Wang L, Brisebarre A, Dubois C, Nkusi E, Lenglez S, Checinska A, et al. Cell-Type-Specific Chromatin States Differentially Prime Squamous Cell Carcinoma Tumor-Initiating Cells for Epithelial to Mesenchymal Transition. Cell Stem Cell. 2017;20:191–204. e195. doi: 10.1016/j.stem.2016.10.018. [DOI] [PMC free article] [PubMed] [Google Scholar]
- Li B, Dewey CN. RSEM: accurate transcript quantification from RNA-Seq data with or without a reference genome. BMC Bioinformatics. 2011;12:323. doi: 10.1186/1471-2105-12-323. [DOI] [PMC free article] [PubMed] [Google Scholar]
- Li W, Kang Y. Probing the Fifty Shades of EMT in Metastasis. Trends in cancer. 2016;2:65–67. doi: 10.1016/j.trecan.2016.01.001. [DOI] [PMC free article] [PubMed] [Google Scholar]
- Liu X, Huang H, Remmers N, Hollingsworth MA. Loss of E-cadherin and epithelial to mesenchymal transition is not required for cell motility in tissues or for metastasis. Tissue Barriers. 2014a;2:e969112. doi: 10.4161/21688362.2014.969112. [DOI] [PMC free article] [PubMed] [Google Scholar]
- Liu X, Yi C, Wen Y, Radhakrishnan P, Tremayne JR, Dao T, Johnson KR, Hollingsworth MA. Interactions between MUC1 and p120 catenin regulate dynamic features of cell adhesion, motility, and metastasis. Cancer research. 2014b;74:1609–1620. doi: 10.1158/0008-5472.CAN-13-2444. [DOI] [PMC free article] [PubMed] [Google Scholar]
- Love MI, Huber W, Anders S. Moderated estimation of fold change and dispersion for RNA-seq data with DESeq2. Genome Biol. 2014;15:550. doi: 10.1186/s13059-014-0550-8. [DOI] [PMC free article] [PubMed] [Google Scholar]
- Maddipati R, Stanger BZ. Pancreatic Cancer Metastases Harbor Evidence of Polyclonality. Cancer Discov. 2015 doi: 10.1158/2159-8290.CD-15-0120. [DOI] [PMC free article] [PubMed] [Google Scholar]
- Moffitt RA, Marayati R, Flate EL, Volmar KE, Loeza SG, Hoadley KA, Rashid NU, Williams LA, Eaton SC, Chung AH, et al. Virtual microdissection identifies distinct tumor- and stroma-specific subtypes of pancreatic ductal adenocarcinoma. Nat Genet. 2015;47:1168–1178. doi: 10.1038/ng.3398. [DOI] [PMC free article] [PubMed] [Google Scholar]
- Nieto MA, Huang RY, Jackson RA, Thiery JP. Emt: 2016. Cell. 2016;166:21–45. doi: 10.1016/j.cell.2016.06.028. [DOI] [PubMed] [Google Scholar]
- Ocana OH, Corcoles R, Fabra A, Moreno-Bueno G, Acloque H, Vega S, Barrallo-Gimeno A, Cano A, Nieto MA. Metastatic colonization requires the repression of the epithelial-mesenchymal transition inducer Prrx1. Cancer Cell. 2012;22:709–724. doi: 10.1016/j.ccr.2012.10.012. [DOI] [PubMed] [Google Scholar]
- Pieters T, van Roy F, van Hengel J. Functions of p120ctn isoforms in cell-cell adhesion and intracellular signaling. Front Biosci (Landmark Ed) 2012;17:1669–1694. doi: 10.2741/4012. [DOI] [PubMed] [Google Scholar]
- Puram SV, Tirosh I, Parikh AS, Patel AP, Yizhak K, Gillespie S, Rodman C, Luo CL, Mroz EA, Emerick KS, et al. Single-Cell Transcriptomic Analysis of Primary and Metastatic Tumor Ecosystems in Head and Neck Cancer. Cell. 2017;172:1–14. doi: 10.1016/j.cell.2017.10.044. [DOI] [PMC free article] [PubMed] [Google Scholar]
- Reichert M, Bakir B, Moreira L, Pitarresi JR, Feldmann K, Simon L, Suzuki K, Maddipati R, Rhim AD, Schlitter AM, Kriegsmann M, Weichert W, Wirth M, Schuck K, Schneider G, Saur D, Reynolds AB, Klein-Szanto A, Pehlivanoglu B, Memis B, Adsay NV, Rustgi AK. Regulation of epithelial plasticity determines metastatic organotropism in pancreatic cancer. Dev Cell, this issue. 2018 doi: 10.1016/j.devcel.2018.05.025. [DOI] [PMC free article] [PubMed] [Google Scholar]
- Revenu C, Gilmour D. EMT 2.0: shaping epithelia through collective migration. Current opinion in genetics & development. 2009;19:338–342. doi: 10.1016/j.gde.2009.04.007. [DOI] [PubMed] [Google Scholar]
- Rhim AD, Mirek ET, Aiello NM, Maitra A, Bailey JM, McAllister F, Reichert M, Beatty GL, Rustgi AK, Vonderheide RH, et al. EMT and dissemination precede pancreatic tumor formation. Cell. 2012;148:349–361. doi: 10.1016/j.cell.2011.11.025. [DOI] [PMC free article] [PubMed] [Google Scholar]
- Savagner P. Epithelial-mesenchymal transitions: from cell plasticity to concept elasticity. Current topics in developmental biology. 2015;112:273–300. doi: 10.1016/bs.ctdb.2014.11.021. [DOI] [PubMed] [Google Scholar]
- Shah AN, Summy JM, Zhang J, Park SI, Parikh NU, Gallick GE. Development and characterization of gemcitabine-resistant pancreatic tumor cells. Ann Surg Oncol. 2007;14:3629–3637. doi: 10.1245/s10434-007-9583-5. [DOI] [PubMed] [Google Scholar]
- Song S, Eckerle S, Onichtchouk D, Marrs JA, Nitschke R, Driever W. Pou5f1-dependent EGF expression controls E-cadherin endocytosis, cell adhesion, and zebrafish epiboly movements. Dev Cell. 2013;24:486–501. doi: 10.1016/j.devcel.2013.01.016. [DOI] [PMC free article] [PubMed] [Google Scholar]
- Sorlie T, Perou CM, Tibshirani R, Aas T, Geisler S, Johnsen H, Hastie T, Eisen MB, van de Rijn M, Jeffrey SS, et al. Gene expression patterns of breast carcinomas distinguish tumor subclasses with clinical implications. Proceedings of the National Academy of Sciences of the United States of America. 2001;98:10869–10874. doi: 10.1073/pnas.191367098. [DOI] [PMC free article] [PubMed] [Google Scholar]
- Stairs DB, Bayne LJ, Rhoades B, Vega ME, Waldron TJ, Kalabis J, Klein-Szanto A, Lee JS, Katz JP, Diehl JA, et al. Deletion of p120-catenin results in a tumor microenvironment with inflammation and cancer that establishes it as a tumor suppressor gene. Cancer Cell. 2011;19:470–483. doi: 10.1016/j.ccr.2011.02.007. [DOI] [PMC free article] [PubMed] [Google Scholar]
- Tam WL, Weinberg RA. The epigenetics of epithelial-mesenchymal plasticity in cancer. Nature medicine. 2013;19:1438–1449. doi: 10.1038/nm.3336. [DOI] [PMC free article] [PubMed] [Google Scholar]
- TCGA. Comprehensive molecular portraits of human breast tumours. Nature. 2012;490:61–70. doi: 10.1038/nature11412. [DOI] [PMC free article] [PubMed] [Google Scholar]
- Tsai JH, Donaher JL, Murphy DA, Chau S, Yang J. Spatiotemporal regulation of epithelial-mesenchymal transition is essential for squamous cell carcinoma metastasis. Cancer Cell. 2012;22:725–736. doi: 10.1016/j.ccr.2012.09.022. [DOI] [PMC free article] [PubMed] [Google Scholar]
- Westcott JM, Prechtl AM, Maine EA, Dang TT, Esparza MA, Sun H, Zhou Y, Xie Y, Pearson GW. An epigenetically distinct breast cancer cell subpopulation promotes collective invasion. The Journal of clinical investigation. 2015;125:1927–1943. doi: 10.1172/JCI77767. [DOI] [PMC free article] [PubMed] [Google Scholar]
- Westphalen CB, Takemoto Y, Tanaka T, Macchini M, Jiang Z, Renz BW, Chen X, Ormanns S, Nagar K, Tailor Y, et al. Dclk1 Defines Quiescent Pancreatic Progenitors that Promote Injury-Induced Regeneration and Tumorigenesis. Cell Stem Cell. 2016;18:441–455. doi: 10.1016/j.stem.2016.03.016. [DOI] [PMC free article] [PubMed] [Google Scholar]
- Wu SY, McClay DR. The Snail repressor is required for PMC ingression in the sea urchin embryo. Development. 2007;134:1061–1070. doi: 10.1242/dev.02805. [DOI] [PMC free article] [PubMed] [Google Scholar]
- Ye X, Weinberg RA. Epithelial-Mesenchymal Plasticity: A Central Regulator of Cancer Progression. Trends Cell Biol. 2015;25:675–686. doi: 10.1016/j.tcb.2015.07.012. [DOI] [PMC free article] [PubMed] [Google Scholar]
- Zavadil J, Bottinger EP. TGF-beta and epithelial-to-mesenchymal transitions. Oncogene. 2005;24:5764–5774. doi: 10.1038/sj.onc.1208927. [DOI] [PubMed] [Google Scholar]
- Zohn IE, Li Y, Skolnik EY, Anderson KV, Han J, Niswander L. p38 and a p38-interacting protein are critical for downregulation of E-cadherin during mouse gastrulation. Cell. 2006;125:957–969. doi: 10.1016/j.cell.2006.03.048. [DOI] [PubMed] [Google Scholar]
Associated Data
This section collects any data citations, data availability statements, or supplementary materials included in this article.
Supplementary Materials
Supplemental Movie S1, Related to Figure 5
Time-lapse DIC microscopy of C-EMT 3077 cells embedded in Matrigel as represented in Figure 5A. Representative of n=14 tumor spheres from 2 independent experiments.
Supplemental Movie S2, Related to Figure 5
Time-lapse DIC microscopy of P-EMT 7591 cells embedded in matrigel. Representative of n=20 tumor spheres from 2 independent experiments.