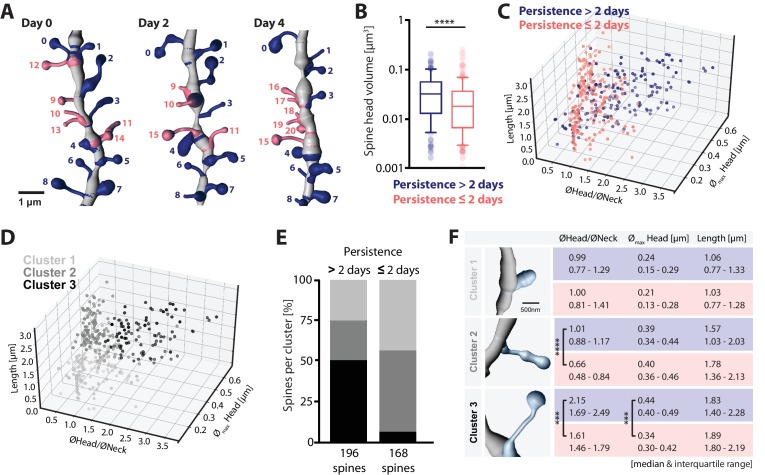
Figure 4. Structure-dynamics relationship of hippocampal spines.
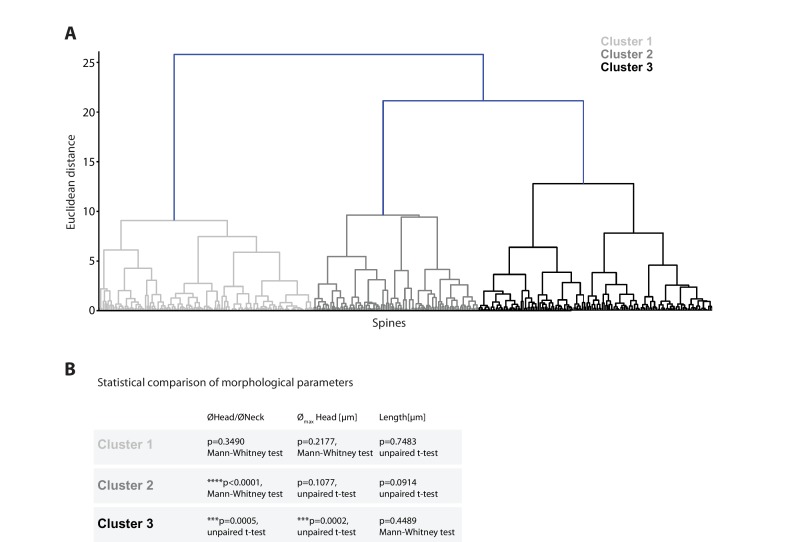
(A) 3D reconstruction of a dendrite imaged on days 0, 2 and 4. Spines persisting for more than 2 days (#0–8, blue), and 2 days or less (#9–20, salmon) are illustrated. (B) Spine head volumes measured on reconstructed dendrites (p<0.0001, Mann-Whitney test; n = 14 dendrites, 3 mice; box plot shows median and 10, 25, 75 and 90th percentiles). (C, D) 3D morphology plots visualizing the populations of spines observed persistent for more than 2 days and 2 days or less (C), and their affiliation to identified clusters 1, 2 and 3 (D) (see also Figure 4—figure supplement 1A). Plotted are, the ratio of mean head to neck diameters (ØHead/ØNeck), spine length and maximum head diameter (Ømax Head). (E) Quantification of spine proportions within identified clusters, distinguishing spines of different persistence (>2 days versus ≤2 days). (F) Table summarizing the morphological parameters utilized for cluster analysis: ØHead/ØNeck, Ømax Head and length of spines, for spines that persist for >2 days (blue) and ≤2 days (salmon). Data are represented as median and interquartile range (25th–75th percentile). Significant differences are marked by asterisks (***p<0.001, ****p<0.0001, unpaired t-test or Mann-Whitney test; for all comparisons see Figure 4—figure supplement 1B; n = 14 dendrites, 3 mice).


