

Abstract
Background: The effective use of limited health care resources is of prime importance. Assessing the length of stay (LOS) is especially important in organizing hospital services and health system. This study was conducted to identify predictors of LOS among patients who were admitted to a general surgical unit.
Methods: In this cross-sectional study, the sample included all patients who were admitted to the general surgical unit of Shariati hospital in 2013 (n= 334). To determine the factors affecting LOS, Zero-inflated Poisson (ZIP), zero-inflated negative binomial (ZINB), and zero-inflated generalized Poisson (ZIGP) regression models were fitted using R software, and then the best model was selected.
Results: Among all 334 patients, the mean (±SD) age of the patients was 45.2 (±16.47) years and 220 (65.9%) of them were male. The results revealed that based on ZIGP model, type of surgery (appendicitis, abdomen and its contents, hemorrhoids, lung, and skin), type of insurance, comorbid diseases (hypertension, heart disease, and hyperlipidemia), place of residence (local and non-local), age, and number of tests had significant effects on the LOS of GS patients.
Conclusion: According to the Akaike information criterion (AIC) in each fitted model, it was found that ZIGP regression model is more appropriate than ZIP and ZINB regression models in assessing LOS in GS patients, especially due to the presence of excess zeros and overdispersion in count data.
Keywords: Length of stay, General surgical unit, Zero-inflated generalized Poisson regression
↑ What is “already known” in this topic:
LOS is one of the simplest indicators of hospital activity, and many studies have identified LOS as a risk factor for 30-day readmission.
→ What this article adds:
We used GLM to identify the effective factors on LOS in a general surgical unit.
Introduction
One of the main objectives of applied and medical statistics is modeling data to analyze and explain medical phenomena. Modeling of length of stay (LOS) is an efficient way to determine the factors that affect LOS. Moreover, LOS is one of the simplest indicators of hospital activity used for various purposes including hospital care management, quality control, appropriate use of hospital services, hospital planning, determining efficiency, and using hospital resources (1-4). Furthermore, many studies have identified LOS as a risk factor for 30-day readmission (5-7). Lim et al. collected effective factors on LOS for patients who died from 2000 to 2003. The results revealed that the older the patients the longer the LOS will be. Old patients with chronic diseases had long LOS, while young patients with mainly acute disease had a short one (8). Lobato et al. identified prolonged-stay risk factors after colorectal surgery (the colon and rectum). They found that congestive heart failure, high levels of albumin, and anemia are 3 contributing factors that prolonged LOS after colorectal surgery (9). To determine the associated factors with length of stay, Huang JQ studied 2757 adults’ data who had been admitted during 2 years. Patients’ age, functional status, comorbid disease, and weight were considered effective factors in LOS (10). Arab et al., in a study in Lorestan public hospitals, found that age, gender, marital status, place of residence, job, type of referral, type of insurance, causes of hospitalization, and patient condition on discharge affect the average length of stay. LOS is also longer among males than females. Recovered or relatively recovered patients on discharge have shorter LOS (11). Hosseini et al. conducted an analytic cross- sectional study on a sample of 570 hospitalized patients for appendicitis in 25 provinces and 50 social security hospitals in Iran in March 21st, 2009 to September 22nd, 2009. The recorded age, gender, type of insurance, and hospital stay variables for each single patient were obtained from the hospitals’ information management system. The findings revealed that the number of active beds, gender, age, and type of insurance did not affect the increase or decrease of LOS (12).
Because the data of LOS are count data, statistical techniques based on the normal distribution are not appropriate, instead generalized linear models including negative binomial regression or Poisson regression should be used (13-17).
Mean and variance equality of response variable is the main condition for using Poisson model. If the condition is not fulfilled, then, generalized Poisson and negative binomial models are appropriate (18-20).
Generalized Poisson regression and negative binomial regression models are, to some extent, capable of determining dispersion. When the zero data are exceeded, data such as LOS of these models will not be efficient. These methods cannot be used to explain and analyze overdispersion in LOS data, so one of the proper approaches to analyze them is zero- inflated regression models (21). In this method, response distribution consists of 2 components: zero and non-zero, and these models depend on the non-zero component. For example, if non-zero Poisson is considered, then, it is called ZIP (Zero Inflated Poisson). However, if negative binominal distribution is taken into account, it is called ZINB (Zero Inflated Negative Binomial), and if a generalized Poisson distribution is considered, it is called ZIGP (Zero Inflated Generalized Poisson).
Considering the importance of LOS for surgical patients, this study was conducted to determine the factors affecting the LOS of general surgical patients using zero- inflated regression models (ZIP, ZINB and ZIGP).
Methods
Data
A cross-sectional study was conducted and data were collected from patients admitted to the general surgical unit of Shariati hospital during March 21st, 2013 and June 21st, 2013. The number of records was reported to be 334. The features consisted of type of surgery, which included appendicitis, digestive disease, abdomen and its contents, skeletal and muscle system, blood and lymphatic system, glands, urinary system, hemorrhoids, cardiovascular system, female reproductive system, breast, lung, and skin. This classification is based on California Tariff. Other features included number of surgery, type of insurance, history of smoking, pulse, different types of diseases (hypertension, diabetes, hyperlipidemia, kidney failure, and other comorbid diseases), blood hemoglobin levels, age, gender, number of tests, and type of admission.
Statistical Analysis
In this study, many patients were hospitalized just for one day, which resulted in excess zeros in LOS data, so the zero-inflated models were proper choices.
The general form of the ZIP model is as follows:
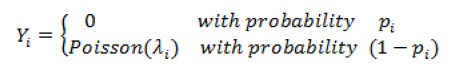
In which the parameters P=(p1,...,pN)T and λ=(λ1,...,λN)T are modeled via canonical link in GLMs family as log(λ)=Bβ and logit p=Gɣ to design matrices B and G.
The probability mass function is as follows:

where 0<p<1 and .
Three models including zero-inflated Poisson, zero-inflated negative binomials, and zero-inflated generalized Poisson were fitted to data. Then, these models were compared using the AIC (smaller AIC means better fit). Data were analyzed using R software and p<0.05 was considered as statistically significant.
Results
Most patients were local males aged 14 to 44 years with insurance. Table 1 displays demographic characteristics. From the perspective of model selection, AIC indicated that the ZIGP model (AIC= 1070) offers the best fit for this data set. Tables 2 and 3 demonstrated the results of ZIP, ZINP, and ZIGP models. According to the results of the ZIGP model (Table 3), some factors such as type of surgery, appendicitis (p= 0.008), abdomen and its contents (p= 0.036), hemorrhoids (p= 0.011), lung (p= 0.059), skin (p= 0.04), type of insurance (p= 0.008), type of comorbid disease, hypertension (p= 0.023), heart disease (p=0.0470, hyperlipidemia (p= 0.047), type of residence (local or non-local) (p= 0.019), number of tests (p<0.001), and age (p= 0.045) had a significant effect on the LOS in the general surgical unit.
Table 1. Frequency Distribution of the General Surgical Patients .
| Variable | Category | Number | % |
| Gender | Female | 114 | 34.1 |
| Male | 220 | 65.9 | |
| Type of insurance | Have insurance | 278 | 83.2 |
| Do not have Insurance | 56 | 16.8 | |
| Place of residence | Non-local | 71 | 21.3 |
| Local | 263 | 78.7 | |
| Age (year) | < 14 | 6 | 1.8 |
| 14-44 | 152 | 45.5 | |
| 45-65 | 136 | 40.7 | |
| > 65 | 40 | 12 | |
| length of stay (day) | 0 | 179 | 53.6 |
| 1 | 62 | 18.6 | |
| 2 | 27 | 8 | |
| ≥3 | 66 | 19.8 |
Table 2. The Fitness Of Zero-Inflated Poisson and Zero-Inflated Negative Binominals Regression Models .
| Parameter (category) | ZIP | ZINB | ||
| Estimation | p | Estimation | p | |
| Fixed value | 0.14 | 0.83 | 0.24 | 0.838 |
| Appendicitis (No*/Yes) | -3.71 | <0.001 | -3.80 | <0.001 |
| Digestive disease (No*/Yes) | 0.0992 | 0.65 | 0.02 | 0.95 |
| Abdomen and its Contents (No*/Yes) | -0.79 | <0.001 | -0.78 | 0.023 |
| Skeletal and muscle system (No*/Yes) | 0.15 | 0.604 | .004 | 0.99 |
| Blood and lymphatic system (No*/Yes) | -0.11 | 0.74 | -0.16 | 0.747 |
| Glands (No*/Yes) | 0.38 | 0.101 | 0.38 | 0.317 |
| Urinary system (No*/Yes) | 0.05 | 0.854 | -0.12 | 0.802 |
| Hemorrhoids (No*/Yes) | -2.16 | 0.001 | -1.97 | 0.003 |
| Cardiovascular system (No*/Yes) | -0.03 | 0.91 | -0.14 | 0.772 |
| Female reproductive system (No*/Yes) | 0.58 | 0.175 | 0.39 | 0.569 |
| Breast (No*/Yes) | -0.62 | 0.292 | -0.77 | 0.275 |
| Lung (No*/Yes) | -1.54 | 0.004 | -1.69 | 0.047 |
| Skin (No*/Yes) | -2.24 | 0.004 | -2.08 | 0.041 |
| Type of insurance (No*/Yes) | 0.54 | 0.001 | 0.01 | 0.047 |
| History of smoking (Non-smoker*/Smoker) | 0.18 | 0.187 | 0.28 | 0.242 |
| Hypertension (No*/Yes) | 0.53 | 0.000 | 0.55 | .019 |
| Diabetes (No*/Yes) | 0.04 | 0.763 | -0.14 | 0.593 |
| Heart disease (No*/Yes) | 0.43 | 0.006 | 0.41 | 0.049 |
| Hyperlipidemia (No*/Yes) | 0.61 | 0.001 | 0.39 | 0.062 |
| Kidney disease (No*/Yes) | -0.01 | 0.963 | -0.042 | 0.905 |
| Comorbid disease (No*/Yes) | -0.01 | 0.957 | -0.09 | 0.709 |
| Hemoglobin (Not natural*/Natural) | -0.06 | 0.551 | -0.10 | 0.60 |
| Gender (Female*/male) | 0.04 | 0.751 | 0.01 | 0.944 |
| Marital status (Single*/Married) | 0.18 | 0.21 | 0.19 | 0.38 |
| Place of residence (Non-local*/Local) | -0.51 | 0.000 | -0.64 | 0.001 |
| Type of admission (Low risk*/Medium Risk) | 0.03 | 0.872 | 0.173 | 0.992 |
| Type of admission (Low risk*/High Risk) | 0.58 | 0.023 | 0.066 | 0.90 |
| Type of admission (Emergency/ hospitalization) | -0.26 | 0.029 | -0.29 | 0.162 |
| Number of tests | 0.17 | 0 .000 | .1589 | 0 .000 |
| Age | 0.24 | .0424 | 0.25 | .0456 |
| Number of surgery | 0.06 | 0.231 | 0.143 | 0.120 |
| Pulse | -0.01 | 0.415 | -0.001 | 0.965 |
| AIC | 1184 | 1072 | ||
*Reference group
Table 3. Frequency Distribution and Result of the ZIGP Model .
| Parameter (category) | Number | % | Estimation | SE | p |
| Fixed value | 334 | - | 0.15 | 1.139 | 0.89 |
| Appendicitis (No*/Yes) | 30 | 9 | -3.70 | 1.411 | 0.008 |
| Digestive disease (No*/Yes) | 123 | 36.8 | 0.06 | 0.360 | 0.871 |
| Abdomen and its contents (No*/Yes) | 53 | 15.9 | -0.74 | 0.353 | 0.036 |
| Skeletal and muscle system (No*/Yes) | 19 | 5.7 | 0.14 | 0.468 | 0.769 |
| Blood and lymphatic system (No*/Yes) | 13 | 3.9 | -0.12 | 0.532 | 0.827 |
| Glands (No*/Yes) | 40 | 12 | 0.35 | 0.382 | 0.365 |
| Urinary system (No*/Yes) | 7 | 2.1 | 0.05 | 0.457 | 0.908 |
| Hemorrhoids (No*/Yes) | 21 | 6.3 | -2.14 | 0.847 | 0.011 |
| Cardiovascular system (No*/Yes) | 25 | 7.5 | -0.042 | 0.453 | 0.926 |
| Female reproductive system (No*/Yes) | 3 | 0.9 | 0.59 | 0.750 | 0.435 |
| Breast (No*/Yes) | 8 | 2.4 | -0.61 | 0.826 | 0.458 |
| Lung (No*/Yes) | 5 | 1.5 | -1.56 | 0.814 | 0.049 |
| Skin (No*/Yes) | 13 | 3.9 | -2.23 | 1.088 | 0.040 |
| Type of insurance (No*/Yes) | 278 | 83.2 | 0.53 | 0.266 | 0.046 |
| History of smoking (Non-smoker*/Smoker) | 50 | 15 | 0.19 | 0.226 | 0.407 |
| Hypertension (No*/Yes) | 47 | 14.1 | 0.49 | 0.215 | 0.023 |
| Diabetes (No*/Yes) | 39 | 11.7 | -0.004 | 0.239 | 0.987 |
| Heart disease (No*/Yes) | 38 | 11.4 | 0.44 | 0.260 | 0.047 |
| Hyperlipidemia (No*/Yes) | 16 | 4.8 | 0.58 | 0.305 | 0.047 |
| Kidney disease (No*/Yes) | 25 | 7.5 | -0.03 | 0.309 | 0.916 |
| Comorbid disease (No*/Yes) | 41 | 12.3 | -0.002 | 0.234 | 0.993 |
| Hemoglobin (Not natural*/Natural) | 243 | 72.8 | -0.07 | 0.178 | 0.697 |
| Gender (Female*/male) | 220 | 65.9 | 0.055 | 0.192 | 0.774 |
| Marital status (Single*/Married) | 252 | 75.4 | 0.12 | 0.225 | 0.606 |
| Place of residence (Non-local*/Local) | 71 | 21.3 | -0.43 | 0.183 | 0.019 |
| Type of admission (Low risk*/Medium Risk) | 56 | 16.8 | 0.001 | 0.275 | 0.997 |
| Type of admission (Low risk*/High Risk) | 13 | 3.9 | -0.57 | 0.430 | 0.181 |
| Type of admission (Emergency/ hospitalization) | 219 | 65.6 | -0.20 | 0.204 | 0.323 |
| Number of tests | 4.82 | 3.13 | 0.17 | 0.023 | <0.001 |
| Age | 45.174 | 16.47 | 0.25 | 0.006 | 0.046 |
| Number of surgery | 1.59 | 1.02 | 0.06 | 0.090 | 0.496 |
| Pulse | 81.03 | 7.42 | -0.005 | 0.012 | 0.701 |
*Reference group
For example, appendicitis is a significant variable on LOS and its estimated value is 3.71. Thus, we can interpret that the log of expected LOS is expected to be 3.71 days lower for patients who have appendicitis compared to those who don’t, while holding the other variables constant in the model.
Discussion
Nowadays improving the quality and efficiency of health care services necessitates the application of efficient and quality indicators. Length of stay (LOS), one of these indicators, has been used as a source of hospital costs and quality indicator (2).
Length of stay, like other count data, needs count models to be analyzed. Poisson distribution has been widely used by researchers. Not having any overdispersion larger than expected, variability is the important assumption of the Poisson regression model. Until recent years, the NB (Negative Binomial) and GP (Generalized Poisson) models have been used to describe overdispersion caused by observed heterogeneity in distribution. The distribution of LOS involves a large proportion of zeros that can lead to overdispersion. Thus, zero-inflated models were fitted to the data. According to AIC criterion, ZIGP was the best model for analyzing this data. Effective demographic and hospital factors (clinical and non-clinical) were studied in the general surgery ward at Shariati hospital in Tehran using zero-inflated generalized Poisson regression model to analyze many zero-stay days. The results of zero-inflated generalized Poisson regression model revealed that type of surgery (appendicitis, abdomen and its contents, hemorrhoids, lung, and skin), type of insurance, type of comorbid disease (hypertension, heart disease, and hyperlipidemia), place of residence (local and non-local), and number of tests affected hospital stay. Non-local patients stayed longer than the local ones, as these patients referred to advanced referral hospitals in Tehran when their diseases reached severe stages and they needed more complex treatment. This delay lies in the lack of definitive diagnosis of multiple visits to doctors or shortcomings on essential and necessary facilities in their hometowns. Lack of accommodation in Tehran is another contributing factor for long hospital stay. These patients refer to the hospital for earlier hospitalization and diagnostic and therapeutic measures, which lead to prolonged hospital stay (22). Ravangard et al., who divided the place of residence in to Tehran, Tehran suburb, Western, Central, Northern, Southern, and Southeast of Iran, concluded that patients coming from Southern and Southeastern regions of Iran have longer hospital stay than others (22). Age is found to be directly associated with length of stay, which is consistent with the results of the study conducted by Arab et al. (11). In the present study, type of insurance was found to be directly associated with length of stay. Patients without insurance had shorter length of hospital stay than those with insurance. This result is consistent with that of Arab et al. (11). The model was separately fitted for each of the 13 types of surgery. The results revealed that appendicitis, abdomen and its contents, and hemorrhoids were found to be significantly associated with length of stay. According to the negative coefficient of type of surgery (appendicitis, abdomen and its contents, hemorrhoids, and skin), such patients had shorter length of stay. The other effective factor was type of comorbid disease (hypertension, heart disease, and hyperlipidemia); the positive coefficients showed longer length of stay, as heart patients require long CCU, ICU, and surgical ward stay. Therefore, heart disease is found to be directly associated with length of hospital stay. Finally, the results of zero-inflated Poisson regression model indicated that increased number of tests led to longer hospital stay. This was due to many routine tests at the beginning for diagnosis as well as delay in response to inpatient wards, which is consistent with results of Ravangard et al. (22).
Conclusion
According to AIC, we conclude that zero-inflated generalized Poisson regression is more appropriate than zero-inflated Poisson regression and zero-inflated negative binominal models based on this dataset.
Acknowledgments
This study was financially supported by Tarbiat Modares University. We also thank health professionals and staff in Shariati Hospital.
Conflict of interests
The authors declare that they have no competing interests.
Cite this article as: Farhadi Hassankiadeh R, Kazemnejad A, Gholami Fesharaki M, Kargar Jahromi S, Vahabi N. Assessment of length of stay in a general surgical unit using a zero-inflated generalized Poisson regression. Med J Islam Repub Iran. 2017 (17 Dec);31:91. https://doi.org/10.14196/mjiri.31.91
References
- 1.Clarke A. Length of in-hospital stay and its relationship to quality of care. Quality Safety Health Care. 2002;11(3):209–10. doi: 10.1136/qhc.11.3.209. [DOI] [PMC free article] [PubMed] [Google Scholar]
- 2.Jimenez R, Lam R, Marot M, Delgado A. Observed-predicted length of stay for an acute psychiatric department, as an indicator of inpatient care inefficiencies Retrospective case-series study. BMC Health Service Res. 2004;4(1):4. doi: 10.1186/1472-6963-4-4. [DOI] [PMC free article] [PubMed] [Google Scholar]
- 3.Atienza N, García‐Heras J, Muñoz‐Pichardo J, Villa R. An application of mixture distributions in modelization of length of hospital stay. Statistic Med. 2008;27(9):1403–20. doi: 10.1002/sim.3029. [DOI] [PubMed] [Google Scholar]
- 4. Ghoreishi Nejad S. Agent simulation in healthcare. Canada:. The University of Regina Canada. 2008.
- 5.Brooke BS, Goodney PP, Powell RJ, Fillinger MF, Travis LL, Goodman DC. et al. Early discharge does not increase readmission ormortality after high-risk vascular surgery. J Vasc Surg. 2013;57:734–40. doi: 10.1016/j.jvs.2012.07.055. [DOI] [PMC free article] [PubMed] [Google Scholar]
- 6.Lucas DJ, Haider A, Haut E, Dodson R, Wolfgang CL, Ahuja N. et al. Assessing readmission after general, vascular, and thoracic surgery usingACS-NSQIP. Ann Surg. 2013;258:430–9. doi: 10.1097/SLA.0b013e3182a18fcc. [DOI] [PMC free article] [PubMed] [Google Scholar]
- 7.Schneider EB, Hyder O, Wolfgang CL, Hirose K, Choti MA, Makary MA. et al. Patient readmission and mortality after surgery for hepato-pancreato-biliary malignancies. J Am Coll Surg. 2012;215:607–15. doi: 10.1016/j.jamcollsurg.2012.07.007. [DOI] [PMC free article] [PubMed] [Google Scholar]
- 8.Lim A, Tongkumchum P. Methods for analyzing hospital length of stay with application to inpatients dying in Southern Thailand. Global Journal of Health Science. 2009;1(1):p27. [Google Scholar]
- 9.de Campos Lobato LF, Ferreira PCA, Wick EC, Kiran RP, Remzi FH, Kalady MF. et al. Risk factors for prolonged length of stay after colorectal surgery. J Coloproctology. 2013;33(1):22–7. [Google Scholar]
- 10.Huang JQ, Hooper PM, Marrie TJ. Factors associated with length of stay in hospital for suspected community-acquired pneumonia. Canadian respiratory journal: journal of the Canadian Thoracic Society. 2006;13(6):317. doi: 10.1155/2006/325087. [DOI] [PMC free article] [PubMed] [Google Scholar]
- 11.Arab M, Zarei A, Rahimi A, Rezaiean F, Akbari F. Analysis of factors affecting length of stay in public hospitals in Lorestan Province, Iran. Hakim Research Journal. 2010;12(4):27–32. [Google Scholar]
- 12.Hosseini AF, Gohari MR. Application of multilevel model in determining the effective factors in the length of stay among appendectomy patients. Razi J Med Sci. 2014;20(115):70–7. [Google Scholar]
- 13.Marazzi A, Paccaud F, Ruffieux C, Beguin C. Fitting the distributions of length of stay by parametric models. Medical care. 1998;36(6):915–27. doi: 10.1097/00005650-199806000-00014. [DOI] [PubMed] [Google Scholar]
- 14.Famoye F, Wulu J, Singh KP. On the generalized Poisson regression model with an application to accident data. J Data Sci. 2004;2:287–95. [Google Scholar]
- 15.Skrondal A, Rabe-Hesketh S. Some applications of generalized linear latent and mixed models in epidemiology: repeated measures, measurement error and multilevel modeling. Norsk epidemiologi. 2003;13(2) [Google Scholar]
- 16.Wang K, Yau KK, Lee AH. A zero-inflated Poisson mixed model to analyze diagnosis related groups with majority of same-day hospital stays. J Comp Method Prog Biomed. 2002;68(3):195–203. doi: 10.1016/s0169-2607(01)00171-7. [DOI] [PubMed] [Google Scholar]
- 17.Wang W, Famoye F. Modeling household fertility decisions with generalized Poisson regression. J Population Econ. 1997;10(3):273–83. doi: 10.1007/s001480050043. [DOI] [PubMed] [Google Scholar]
- 18.Karlis D, Xekalaki E. Mixed poisson distributions. Int Statist Rev. 2005;73(1):35–58. [Google Scholar]
- 19.Ng S, Yau K, Lee A. Modelling inpatient length of stay by a hierarchical mixture regression via the EM algorithm. Math Comp Model. 2003;37(3):365–75. [Google Scholar]
- 20.Wulu J, Singh K, Famoye F, McGwin G. Regression analysis of count data. J Indian Soc Agri Stat. 2002;55(2):220–31. [Google Scholar]
- 21. Hilbe J. Negative binomial regression: Cambridge University Press; 2011.
- 22.Ravangard R, Arab M, Zeraati H, Rashidian A, Akbarisari A, Mostaan F. Patients' length of stay in women hospital and its associated clinical and non-clinical factors, Tehran, Iran. Iranian Red Crescent Med J. 2011;13(5):309. [PMC free article] [PubMed] [Google Scholar]