Abstract
Purpose
To determine whether ocular trauma occurs more frequently in the summer months.
Design
Retrospective, cross-sectional study.
Methods
The Nationwide Emergency Department Sample (NEDS) is a large, publicly available administrative database that provides nationally representative estimates of emergency department (ED) visits in the United States. Billing codes from NEDS from 2006-2013 were used to identify all cases of ocular trauma, and the United States decennial census was used to estimate the population at risk for visiting an ED. The main outcome measures were the seasonal and annual trends in the incidence of ED-diagnosed eye trauma.
Results
Eye trauma was the primary diagnosis for an estimated 5,615,532 ED encounters over the eight-year study period. The most common ocular trauma presentations were superficial injury of eye and adnexa (101 ED-diagnosed cases per 100,000 population), extraocular foreign body (54 per 100,000 population), contusion of eye and adnexa (27 per 100,000 population), and ocular adnexal open wound (26 per 100,000 population). Each exhibited a statistically significant annual cycle, with a mean annual peak between May and July (p<0.01 for each, Edwards test). Eye trauma visits decreased by an average of 4% per year over the study period, with a similar pattern of decline during each calendar month (IRR 0.96, 95% CI 0.94 to 0.98).
Conclusions
Eye trauma, although decreasing in incidence, is a seasonal condition. Prevention efforts would likely be most effective if implemented in the spring or summer months and if targeted toward men and those under age 60. Further study to identify other individual-level or regional-level factors that would most benefit from public health efforts is warranted.
Introduction
Ocular trauma accounts for approximately one-third of all eye-related emergency department (ED) visits in the United States (US) each year1. Visual outcomes, while dependent on the type and severity of trauma, can be extremely poor following an injury to the eye or ocular adnexa2. Fortunately, eye trauma is preventable, and several prevention programs have reported success in reducing ocular trauma in multiple occupational settings3,4. Public health programs addressing eye trauma must decide on a population to target and the most appropriate time to promote prevention campaigns. While previous studies have assessed risk factors for eye trauma, the seasonality of ocular injuries has not been well characterized5,6. Based on clinical experience, we hypothesized that eye trauma was more likely to occur in the summer. In this report, we analyze 8 years of data from a nationally representative sample of ED visits to investigate seasonal patterns of eye trauma.
Methods
Data Sources
This was a cross-sectional study examining ED visits for ocular trauma from 2006 to 2013 using discharge data from the Nationwide Emergency Department Sample (NEDS), a publically available data source developed by the Agency for Healthcare Research and Quality as part of the Healthcare Cost and Utilization Project (HCUP). Analysis of this dataset was granted exempt status by the institutional review board at University of California, San Francisco as this data is publicly available and does not include information, such as patient identifiers, that would allow subject identification. All research activities were conducted in adherence to the Declaration of Helsinki and federal and state law.
The NEDS is the largest all-payer, publicly available ED database in the US, containing approximately 30 million records per year from about 1,000 EDs. The NEDS is designed as a nationally representative dataset, comprised of a stratified probability sample of administrative billing records for approximately 20% of US hospital-based EDs.7 Stratification is based on geographic region, trauma center designation, urban or rural location of the hospital, teaching status, and hospital ownership. Post-stratification weights are provided, and when applied allow extrapolation to the roughly 130 million ED visits nationwide that occur each year. The NEDS includes a variety of patient-level and hospital-level variables such as age, sex, insurance status, primary diagnosis code, etc. Further information on sampling methodology is available from HCUP.7 We defined the population at risk for an ED eye trauma visit as the entire US population, and thus used data from the US Census to approximate monthly and annual population totals8.
Study Population
We identified cases with a primary diagnosis code corresponding to ocular trauma according to the International Classification of Diseases, Ninth Revision, Clinical Modification (ICD-9-CM). The implementation of ICD-10-CM was not mandatory until an effective date of October 2015, which is outside of the study period. Trauma-related eye diagnoses were grouped into 8 categories as outlined in the Table.
Table.
Frequency of ocular trauma by diagnosis code (national estimates)
| Diagnosis (ICD-9-CM code) | Total number, 2006-2013 | Annual incidence per 100,000 US population (95% CI) |
|---|---|---|
| Superficial injury of eye/adnexa | 2,481,084 | 100.7 (96.4-105.1) |
| Corneal abrasion (918.1) | 2,151,019 | 87.3 (83.4-91.3) |
| Other (918.0, 918.2-918.9) | 330,065 | 13.4 (12.9-13.9) |
| Extraocular foreign body | 1,320,196 | 53.6 (50.7-56.5) |
| Corneal foreign body (930.0) | 684,969 | 27.8 (25.9-29.7) |
| Other (930.1-930.9) | 635,227 | 25.8 (24.5-27.1) |
| Contusion of eye and adnexa (921.0-921.9) | 672,221 | 27.3 (25.7-28.9) |
| Ocular adnexal open wound | 646,959 | 26.3 (25.3-27.3) |
| Eyelid laceration (870.0-870.2) | 383,602 | 15.6 (14.9-16.3) |
| Other (870.3-870.9) | 263,357 | 10.7 (10.2-11.2) |
| Orbital floor fractures (802.6, 802.7) | 217,929 | 8.9 (8.4-9.3) |
| Burn of eye and adnexa | 161,051 | 6.5 (6.2-6.9) |
| Corneal/conjunctival sac burn (940.2-940.4) | 99,750 | 4.1 (3.9-4.2) |
| Eyelid and periocular burn (940.0, 940.1) | 25,848 | 1.1 (0.9-1.2) |
| Other (940.5-940.9) | 35,453 | 1.4 (1.3-1.6) |
| Open wounds in the eyeball | 112,233 | 4.6 (4.1-5.1) |
| Open globe (871.0-871.4, 871.7, 871.9) | 93,641 | 3.8 (3.3-4.3) |
| Intraocular foreign body (871.5, 871.6) | 18,592 | 0.8 (0.7-0.8) |
| Other | 3,859 | 0.16 (0.14-0.17) |
| Optic nerve/pathway injury (950.0-950.9) | 3,702 | 0.15 (0.13-0.17) |
| Oculomotor nerve injury (951.0) | 157 | 0.006 (0.004-0.009) |
Statistical Analyses
We performed all statistics with R version 3.3.1 for Macintosh (R Foundation for Statistical Computing, Vienna, Austria, 2016). The most granular calendar time in NEDS was the month and year of the ED visit; we estimated nationwide monthly frequencies of each category of eye trauma using sample weights provided by NEDS (survey package). We calculated the monthly incidence of eye trauma treated at US EDs using monthly population figures provided by the US census as the denominator, or if these were unavailable then performed cubic spline interpolation of the annual census population figures to derive monthly estimates (zoo package). We assessed for seasonal trends in the monthly incidence figures with the Edwards test, which tests the null hypothesis of a uniform distribution of events within a year.9 We used Poisson regression to test for yearly trends, with the annual estimate of the US population as the offset and a time series bootstrap to account for potential autocorrelation (tsboot package; 10,000 repetitions, fixed width of 2 years). Given the numerous statistical tests performed in the study, we conservatively set a significance level of 0.001.
Results
Eye trauma diagnoses accounted for an estimated 5,615,532 ED visits in the US from 2006-2013 (estimated incidence based on US census: 228 per 100,000 person-years). Demographic characteristics for those presenting with eye trauma were similar to previous reports from the same database: 66.1% (66.0%–66.3%, 95% confidence) were male. 28% (27.2%–29.0%) were aged 0-19 years, 62.7% (62.0%–63%) were aged 20-59 years, and 9.3% (9.1%–10.0%) were aged 60 years or older. The Table lists the diagnostic groupings from most to least common.
As shown in Figure 1, ocular trauma visits demonstrated a statistically significant seasonal pattern (P<0.001 for annual cycle, Edwards test), with a peak in July (mean 19.2 visits per 100,000 person-months) and nadir in February (mean 12.5 visits per 100,000 person-months). This pattern did not differ when normalizing by number of ED visits instead of the US population (Supplemental Figure 1). In contrast, total ED visits— regardless of diagnosis—did not display significant seasonality (P=0.24, Edwards test).
Figure 1. Seasonal variation of eye trauma and overall emergency department visits, 2006-2013.
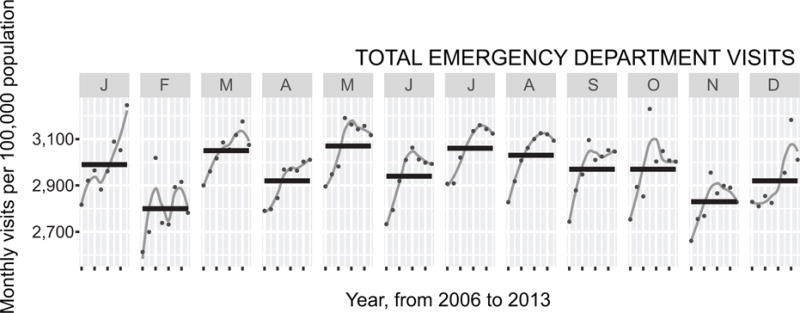
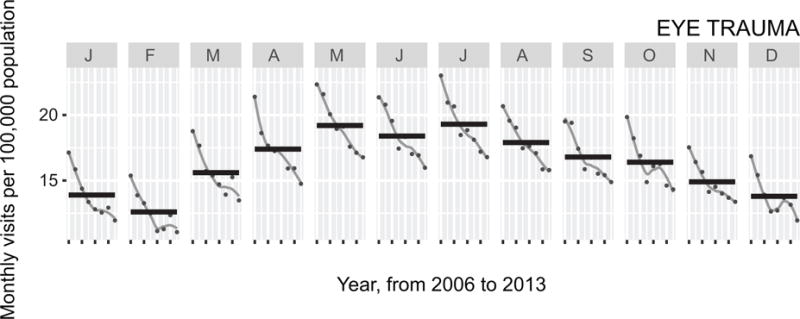
Each shaded vertical panel displays a calendar month (January to December), with each point representing the monthly incidence due to eye trauma during that month at each of the 8 years of the study period. The grey line is a loess curve depicting trends within a given month over the study period, and the black horizontal line shows the mean number of visits over the study period. The top part of the figure shows eye trauma visits and the bottom part shows total emergency department visits, regardless of diagnosis.
The downward trending lines in Figure 1 indicate a reduction in the number of eye trauma visits for a particular month over each year of the study period. We observed an average of 4% fewer ED visits each year (IRR 0.96, 95% CI 0.94 to 0.98, P<0.001; Poisson regression), with a remarkably consistent pattern of reduction during each calendar month. The 7 most common diagnostic groups exhibited similar seasonal patterns (P<0.001 for each) and annual patterns (P<0.001 for each diagnosis except orbital floor fractures, which exhibited a non-significant increase over the study period, P=0.06; Figure 2). To determine whether seasonality was more pronounced in certain populations, we performed the same analyses stratified by age and sex. These analyses did not show marked differences in the seasonal patterns of ocular trauma (Figure 3).
Figure 2. Seasonal variation of eye trauma diagnostic groups, 2006-2013.
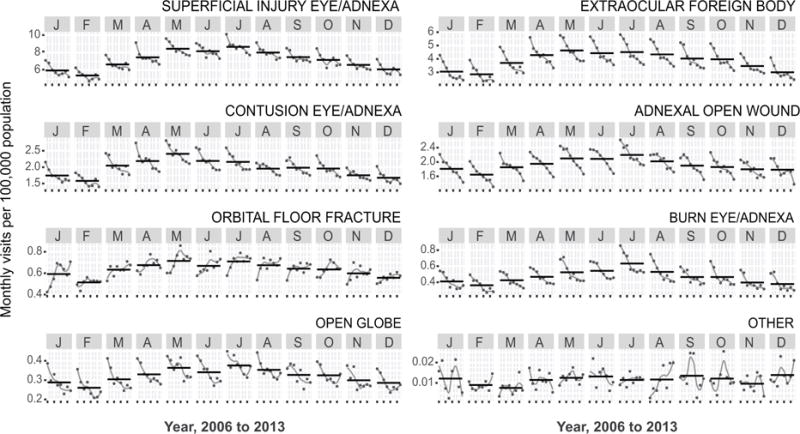
Each shaded vertical panel displays a calendar month (January to December), with each point representing the monthly incidence due to eye trauma during that month at each of the 8 years of the study period. The grey line is a loess curve depicting trends within a given month over the study period, and the black horizontal line shows the mean number of visits over the study period. The eight parts of the figure each represent a different diagnostic group, which is labeled at the top right.
Figure 3.
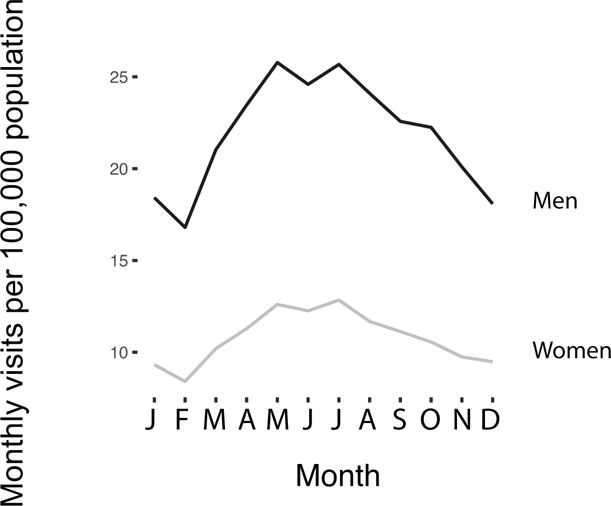
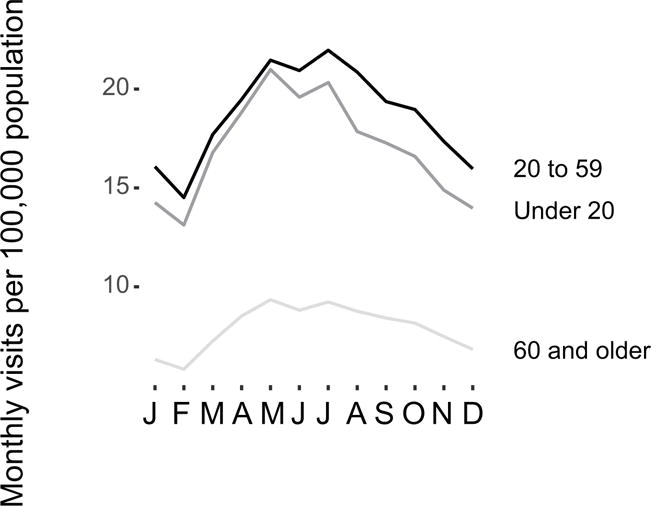
Monthly variation in eye trauma presentations per 100,000 population, stratified by Age group (top) and sex (bottom).
The proportion of patients with eye trauma utilizing private insurance as the primary payment method decreased over the study period (Figure 4). In 2006, roughly 44% of those presenting to the ED for ocular trauma used private insurance, which declined to 39% by 2013. Over the same period, Medicaid coverage among these patients increased from 15% to 23%, and Medicare coverage from 7% to 10%. Insurance patterns for patients with eye trauma were similar when assessed as incident ED encounters among the entire US population (Supplemental Figure 2). Similar trends in insurance coverage were also observed among all-comers to the ED (Figure 4).
Figure 4. Annual trends in insurance status for (A) all visits for ocular trauma and (B) all ED visits.

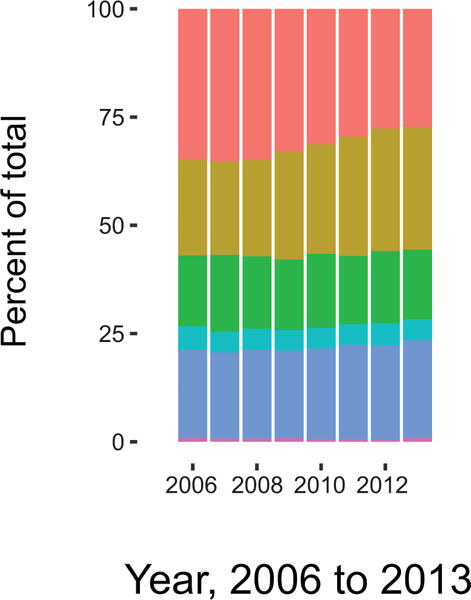
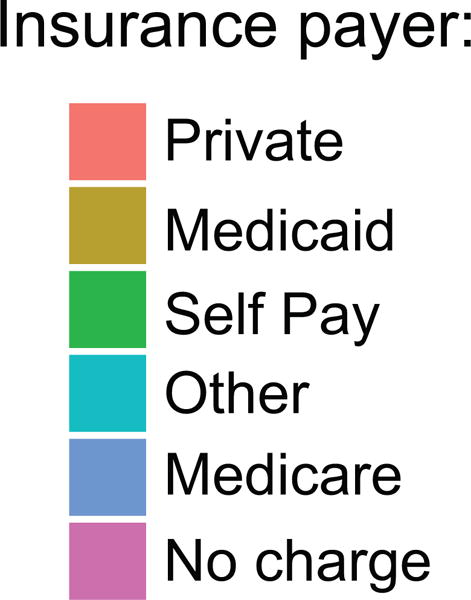
The left panel demonstrates annual trends for the corresponding primary payer, and the right panel shows the relative proportion of visits for which each payer is responsible.
Discussion
Two of every 1000 Americans visited an ED for eye trauma each year from 2006 to 2013, although the rate steadily decreased throughout the study period. During this time, ED visits for eye trauma exhibited a strong seasonal pattern, with more visits occurring in the late spring and summer months and fewer in the winter months. A similar pattern was observed for the majority of individual diagnostic groupings for eye trauma, but not for ED visits as a whole. Stratified analyses failed to detect specific populations driving the seasonal effect.
Seasonal trends have been observed previously for corneal infections. For example, fungal keratitis has been found to be associated with hotter, more humid, and windier times of the year10–12, often corresponding to the harvest season in agricultural communities13. Acanthamoeba keratitis is also thought to be more common in the warmer months due to increased exposure to fresh water through recreational activities14. We suspect that a considerable proportion of the increase in infectious keratitis during the summer months is due to traumatic injuries of the cornea that subsequently become infected, as corneal trauma is one of the most important risk factors for corneal infections15. Thus, our finding of an increased incidence of superficial eye injuries presenting to United States EDs in the summer months is consistent with these previous studies showing a similar seasonal timing for infectious keratitis.
Other traumatic conditions have also been found to be subject to seasonal patterns. A recent systematic review found that trauma was generally more likely to occur during warmer periods of time, and that this effect was more pronounced for children than for adults16. Although we found no differences in the seasonal pattern by age, this study’s findings were otherwise consistent with the general pattern of increased trauma in the summer months. Other studies have found that crime and violence displays a strong seasonal pattern, with more cases in the summer17. We speculate that the warmer temperatures and longer daylight hours of the summer months lead to more time outside performing potentially risky activities.
We found a significant reduction in the annual incidence of eye trauma from 2006-2013, with an average of 4% fewer ED visits due to eye trauma per year. The declining trend in eye trauma ED presentations was observed for each individual diagnostic group except for orbital floor fractures. This finding is consistent with most,5,18,19 but not all,20 previous reports from NEDS and other nationwide databases during the same time period.
The underlying reason for a reduction in ED eye trauma encounters is unclear. We saw a decrease in the number of eye trauma patients presenting to the ED with private insurance, and an increase in those presenting with Medicaid or Medicare. This is consistent with national trends, as those receiving health insurance through private means have been gradually decreasing over time21. The Affordable Care Act resulted in several states expanding their Medicaid programs but this did not take effect until 2014, which is outside the study period and thus unlikely to account for the increasing proportion of Medicaid coverage observed here. It is possible that individuals with private insurance have been preferentially seeking care in a primary care setting while those with public coverage have been more frequently using the ED, thus accounting for the relative decline in private insurance and rise in Medicaid and Medicare. Such a theory has been suggested by others but remains nonetheless speculative22,23.
Looking at particular causes of eye injury, studies have shown that rates of certain causes, such as motor vehicle collisions (MVCs), has been decreasing over the study period, although in one study an injury to the eyeball was coded in less than 1% of MVC-related ED visits18,19. While the evidence is not consistent, injuries from fireworks also seem to have decreased over the study period.24,25 However, the reduction in eye trauma observed in the present study was not more pronounced in July, which is when most ocular firework injuries occur26. It is also possible that the observed reduction in eye trauma is simply a result of the general aging of the American population, since eye trauma is more common among younger people.
Prevention programs have had success in reducing work-related ocular trauma through the introduction of ocular protection3,4, although the uptake of such programs can be difficult. Particularly in agricultural settings, which account for a large proportion of work-related penetrating eye injury13,27, the uptake of safety goggle use even with the aid of community health workers only approaches roughly 30%28. The results from the present study suggest that for maximum public health impact, prevention programs would be wise to target the early spring months for messages about eye trauma and the importance of eye protection when performing potentially risky activities. Furthermore, specific targeting of any public health campaign would likely be most effective for the high risk groups: men and those under the age of 60.
The major strength of this study is its use of a large nationally representative population-based sample of ED visits. Although this is also a limitation, in that administrative datasets can be prone to misclassification, eye trauma is fairly specific and may not be as affected by this problem as some other diagnoses. A major limitation is that the NEDS does not include any non-ED visits, and therefore any eye trauma presenting directly to an outpatient setting or urgent care clinic was not included. Although this study design necessarily underestimates the national incidence of eye trauma, it should not introduce bias into the analyses unless individuals with eye trauma systematically visited outpatient clinics during certain seasons or years and EDs during other seasons or years. We do not find such a pattern likely, especially given that overall visits in outpatient clinics and ED do not seem to exhibit seasonal variation29.
In summary, we found a significant reduction in the incidence of ED-diagnosed eye trauma in the United States from 2006 to 2013, as well a seasonal pattern of eye trauma that peaked in the summer months. The observation of seasonality is important for ED planning purposes, especially at academic centers, since the peak of eye trauma coincides with the start of the academic year. Both ED and ophthalmology residency programs would do well to emphasize the diagnosis and management of eye trauma in early July. Moreover, these results suggest that eye trauma prevention programs may have the most impact by focusing their interventions in the spring and summer.
Supplementary Material
Supplemental Figure 1: Seasonal variation in eye trauma visits when normalized by all ED visits.
Each shaded vertical panel displays a calendar month (January to December), with each point representing the monthly incidence due to eye trauma during that month at each of the 8 years of the study period. The grey line is a loess curve depicting trends within a given month over the study period, and the black horizontal line shows the mean number of visits over the study period. The six parts of the figure each represent a different insurance payer, which is labeled at the top right.
Acknowledgments
None
Funding/Support: This work was supported by the National Institutes of Health (NIH)– National Eye Institute, grants EY002162 (Core Grant for Vision Research) and R01EY024608 (Drs. Lietman and Porco); the NIH–National Institute of General Medical Sciences Models of Infectious Disease Agent Study Program, grant U01-GM087728 (Dr. Porco); the NIH-National Institute on Minority Health and Health Disparities, grant R25MD006832 (Mr. Ramirez); and Research to Prevent Blindness.
Footnotes
Publisher's Disclaimer: This is a PDF file of an unedited manuscript that has been accepted for publication. As a service to our customers we are providing this early version of the manuscript. The manuscript will undergo copyediting, typesetting, and review of the resulting proof before it is published in its final citable form. Please note that during the production process errors may be discovered which could affect the content, and all legal disclaimers that apply to the journal pertain.
Supplemental Material at AJO.com (Supplemental Figure 1, Supplemental Figure 2)
Financial Disclosures: The authors report no financial disclosures.
References
- 1.Channa R, Zafar SN, Canner JK, Haring RS, Schneider EB, Friedman DS. Epidemiology of Eye-Related Emergency Department Visits. JAMA Ophthalmol. 2016;134(3):312–319. doi: 10.1001/jamaophthalmol.2015.5778. [DOI] [PubMed] [Google Scholar]
- 2.Kuhn F, Morris R, Witherspoon CD, Mann L. Epidemiology of blinding trauma in the United States Eye Injury Registry. Ophthalmic Epidemiol. 2006;13(3):209–216. doi: 10.1080/09286580600665886. [DOI] [PubMed] [Google Scholar]
- 3.Bull N. Mandatory use of eye protection prevents eye injuries in the metal industry. Occup Med Oxf Engl. 2007;57(8):605–606. doi: 10.1093/occmed/kqm083. [DOI] [PubMed] [Google Scholar]
- 4.Thomas R, McManus JG, Johnson A, Mayer P, Wade C, Holcomb JB. Ocular injury reduction from ocular protection use in current combat operations. J Trauma. 2009;66(4 Suppl):S99–S103. doi: 10.1097/TA.0b013e31819d8695. [DOI] [PubMed] [Google Scholar]
- 5.Haring RS, Canner JK, Haider AH, Schneider EB. Ocular injury in the United States: Emergency department visits from 2006–2011. Injury. 2016;47(1):104–108. doi: 10.1016/j.injury.2015.07.020. [DOI] [PubMed] [Google Scholar]
- 6.Nash EA, Margo CE. Patterns of emergency department visits for disorders of the eye and ocular adnexa. Arch Ophthalmol Chic Ill 1960. 1998;116(9):1222–1226. doi: 10.1001/archopht.116.9.1222. [DOI] [PubMed] [Google Scholar]
- 7.Agency for Healthcare Research and Quality. Introduction to the HCUP Nationwide Emergency Department Sample (NEDS) 2014 https://www.hcup-us.ahrq.gov/db/nation/neds/NEDS2014Introduction.pdf. Accessed December 15, 2016.
- 8.United States Census Bureau. American FactFinder. https://factfinder.census.gov. Accessed December 27, 2016.
- 9.Edwards JH. The recognition and estimation of cyclic trends. Ann Hum Genet. 1961;25:83–87. doi: 10.1111/j.1469-1809.1961.tb01501.x. [DOI] [PubMed] [Google Scholar]
- 10.Gorski M, Genis A, Yushvayev S, Awwad A, Lazzaro DR. Seasonal Variation in the Presentation of Infectious Keratitis. Eye Contact Lens Sci Clin Pract. 2016;42(5):295–297. doi: 10.1097/ICL.0000000000000213. [DOI] [PubMed] [Google Scholar]
- 11.Gopinathan U, Garg P, Fernandes M, Sharma S, Athmanathan S, Rao GN. The epidemiological features and laboratory results of fungal keratitis: a 10-year review at a referral eye care center in South India. Cornea. 2002;21(6):555–559. doi: 10.1097/00003226-200208000-00004. [DOI] [PubMed] [Google Scholar]
- 12.Wilhelmus KR. Climatology of dematiaceous fungal keratitis. Am J Ophthalmol. 2005;140(6):1156–1157. doi: 10.1016/j.ajo.2005.07.032. [DOI] [PubMed] [Google Scholar]
- 13.Lin CC, Lalitha P, Srinivasan M, et al. Seasonal trends of microbial keratitis in South India. Cornea. 2012;31(10):1123–1127. doi: 10.1097/ICO.0b013e31825694d3. [DOI] [PMC free article] [PubMed] [Google Scholar]
- 14.Yoder JS, Verani J, Heidman N, et al. Acanthamoeba keratitis: the persistence of cases following a multistate outbreak. Ophthalmic Epidemiol. 2012;19(4):221–225. doi: 10.3109/09286586.2012.681336. [DOI] [PubMed] [Google Scholar]
- 15.Srinivasan M, Gonzales CA, George C, et al. Epidemiology and aetiological diagnosis of corneal ulceration in Madurai, south India. Br J Ophthalmol. 1997;81(11):965–971. doi: 10.1136/bjo.81.11.965. [DOI] [PMC free article] [PubMed] [Google Scholar]
- 16.Ali AM, Willett K. What is the effect of the weather on trauma workload? A systematic review of the literature. Injury. 2015;46(6):945–953. doi: 10.1016/j.injury.2015.03.016. [DOI] [PubMed] [Google Scholar]
- 17.Lauritsen JL, White N. Seasonal Patterns in Criminal Victimization Trends. U.S. Department of Justice, Office of Justice Programs, Bureau of Justice Statistics; 2014. https://www.bjs.gov/content/pub/pdf/spcvt.pdf. Accessed March 27, 2017. [Google Scholar]
- 18.Sise RG, Calvo RY, Spain DA, Weiser TG, Staudenmayer KL. The epidemiology of trauma-related mortality in the United States from 2002 to 2010. J Trauma Acute Care Surg. 2014;76(4):913–919. doi: 10.1097/TA.0000000000000169. discussion 920. [DOI] [PubMed] [Google Scholar]
- 19.Armstrong GW, Chen AJ, Linakis JG, Mello MJ, Greenberg PB. Motor Vehicle Crash-Associated Eye Injuries Presenting to U.S. Emergency Departments. West J Emerg Med. 2014;15(6):693–700. doi: 10.5811/westjem.2014.5.20623. [DOI] [PMC free article] [PubMed] [Google Scholar]
- 20.Coronado VG, Haileyesus T, Cheng TA, et al. Trends in Sports- and Recreation-Related Traumatic Brain Injuries Treated in US Emergency Departments: The National Electronic Injury Surveillance System-All Injury Program (NEISS-AIP) 2001-2012. J Head Trauma Rehabil. 2015;30(3):185–197. doi: 10.1097/HTR.0000000000000156. [DOI] [PMC free article] [PubMed] [Google Scholar]
- 21.Cohen Robin A, Ward Brian W, Schiller Jeannine S. Health Insurance Coverage: Early Release of Estimates From the National Health Interview Survey, 2010. Division of Health Interview Statistics, National Center for Health Statistics; 2011. http://www.cdc.gov/nchs/nhis.htm. [Google Scholar]
- 22.Hsia RY, Brownell J, Wilson S, Gordon N, Baker LC. Trends in Adult Emergency Department Visits in California by Insurance Status, 2005-2010. JAMA. 2013;310(11):1181–1183. doi: 10.1001/jama.2013.228331. [DOI] [PMC free article] [PubMed] [Google Scholar]
- 23.Tang N, Stein J, Hsia RY, Maselli JH, Gonzales R. Trends and Characteristics of US Emergency Department Visits, 1997-2007. JAMA. 2010;304(6):664–670. doi: 10.1001/jama.2010.1112. [DOI] [PMC free article] [PubMed] [Google Scholar]
- 24.Canner JK, Haider AH, Selvarajah S, et al. US emergency department visits for fireworks injuries, 2006-2010. J Surg Res. 2014;190(1):305–311. doi: 10.1016/j.jss.2014.03.066. [DOI] [PubMed] [Google Scholar]
- 25.Moore JX, McGwin G, Griffin RL. The epidemiology of firework-related injuries in the United States: 2000-2010. Injury. 2014;45(11):1704–1709. doi: 10.1016/j.injury.2014.06.024. [DOI] [PubMed] [Google Scholar]
- 26.Chang IT, Prendes MA, Tarbet KJ, Amadi AJ, Chang S-H, Shaftel SS. Ocular injuries from fireworks: the 11-year experience of a US level I trauma center. Eye Lond Engl. 2016;30(10):1324–1330. doi: 10.1038/eye.2016.104. [DOI] [PMC free article] [PubMed] [Google Scholar]
- 27.Srinivasan M, Gonzales CA, George C, et al. Epidemiology and aetiological diagnosis of corneal ulceration in Madurai, south India. Br J Ophthalmol. 1997;81(11):965–971. doi: 10.1136/bjo.81.11.965. [DOI] [PMC free article] [PubMed] [Google Scholar]
- 28.Monaghan PF, Forst LS, Tovar-Aguilar JA, et al. Preventing eye injuries among citrus harvesters: the community health worker model. Am J Public Health. 2011;101(12):2269–2274. doi: 10.2105/AJPH.2011.300316. [DOI] [PMC free article] [PubMed] [Google Scholar]
- 29.Pace WD, Dickinson LM, Staton EW. Seasonal Variation in Diagnoses and Visits to Family Physicians. Ann Fam Med. 2004;2(5):411–417. doi: 10.1370/afm.73. [DOI] [PMC free article] [PubMed] [Google Scholar]
Associated Data
This section collects any data citations, data availability statements, or supplementary materials included in this article.
Supplementary Materials
Supplemental Figure 1: Seasonal variation in eye trauma visits when normalized by all ED visits.
Each shaded vertical panel displays a calendar month (January to December), with each point representing the monthly incidence due to eye trauma during that month at each of the 8 years of the study period. The grey line is a loess curve depicting trends within a given month over the study period, and the black horizontal line shows the mean number of visits over the study period. The six parts of the figure each represent a different insurance payer, which is labeled at the top right.


