Abstract
Objective
Multiple factors contribute to the rising rates of obesity and to difficulties in weight reduction that exist in the worldwide population. Caloric intake via sugar-sweetened beverages may be influential. In this study, we tested the hypothesis that liquid sucrose intake promotes obesity by increasing serum insulin levels and tissue lipid accumulation.
Methods
C57BL/6J mice were given 30% sucrose in liquid form. Changes in weight gain, body composition, energy expenditure, and tissue lipid content were measured.
Results
Mice drinking sucrose gained more total body mass (TBM), had greater fat mass, and displayed impaired glucose tolerance relative to control mice. These metabolic changes occurred without alterations in circulating insulin levels and despite increases in whole body energy expenditure. Lipid accrued in liver, but not skeletal muscle, of sucrose consuming mice. Oxygen consumption (VO2) correlated with fat-free mass, moderately with TBM, but not with fat mass. Analysis of covariance (ANCOVA) for treatment effects on EE with TBM, VO2, LBM, and FFM taken as potential covariates for EE revealed VO2 as the most significant correlation.
Conclusions
Weight gain induced by intake of liquid sucrose in mice is associated with lipid accrual in liver, but not skeletal muscle, and occurred without an increase in circulating insulin.
Keywords: adipose tissue, carbohydrate metabolism, obesity, sucrose, weight gain
Introduction
Obesity is a continually increasing major public health problem worldwide (1) and is a major co-morbidity for other disorders, including cancer, diabetes, heart disease, and hypertension (2). Higher BMI values disproportionally contribute to rising healthcare costs (3). Multiple factors influence conditions of overweight and obesity, including genetic predisposition, sedentary lifestyles, reduced levels of physical activity, and food choices (4).
Sugar-sweetened beverages (SSBs) have historically been controversial as risk factors for, or direct contributors to, the development of obesity due to arguments over study design and other experimental issues [see refs. (5, 6) and references therein]. Critical compilation of data from more recent studies have concluded that SSBs influence or exaggerate the effect of the principal factors leading to conditions of overweight and obesity (7, 8). Mono- and disaccharides constitute the major sweeteners in foods and beverages that, when ingested in either liquid or solid form, influence weight gain and metabolic disease onset (5, 9, 10). Sucrose is a disaccharide that supplies glucose and fructose in equimolar amounts once digested. Glucose metabolism is subject to regulation through glycolytic pathways, including allosteric regulation by the enzyme 6-phosphofructo-2 kinase isoform 1 (PFK1), while fructose is phosphorylated by fructokinase and cleaved into trioses (e.g., by aldolase B), thus bypassing this regulation (11).
Sucrose is a very rewarding stimulus to many organisms and therefore is often preferentially sought out (12). Consistent with this idea, the intake of beverages containing sucrose or other related sweeteners has increased dramatically over the last 50 years (7). However, within ten weeks, sucrose intake worsens the metabolic profile of human subjects that are overweight (13). In addition, obesigenic diets promote hyperinsulinemia, which could be a contributor to insulin resistance, obesity, or both (14, 15).
Because most animal models of obesity exhibit hyperinsulinemia (16), elevations in circulating insulin could be either a driver or a consequence of obesity. Genetic reduction of insulin genes in mice have revealed that abundant quantities of insulin are indeed required to support weight gain and increased adiposity during high-fat feeding (17, 18). However, obesity associated with high-fat diet could be distinct from obesity driven by overconsumption of other macronutrients (e.g., sucrose); thus, macronutrient imbalance may be sensed by specific endocrine mechanisms. Fibroblast growth factor 21(FGF21) is a protein hormone with wide effects on metabolic outcomes and is thus poised to participate in nutrient sensing (19). Indeed, there is precedence for elevations in FGF21 during consumption of a low protein diet, consistent with a role for macronutrient sensing (20). Because the Fgf21 gene is also activated in response to elevations in dietary carbohydrate (21), fasting (22), or glucocorticoids (23), it is reasonable to postulate that a variety of homeostatic mechanisms are activated by dietary alterations. Our studies herein reveal that C57BL/6J mice consuming liquid sucrose gain weight without an increase in circulating insulin and display many commons features with human subjects that are overweight or have obesity.
Materials and Methods
Animals and Reagents
Sixteen male C57BL6/J (stock #: 000664) mice were obtained from the Jackson Laboratory (Bar Harbor, Maine) at eight weeks of age and allowed free access to Lab Diet 5015 standard non-purified diet (catalog # 0001328). For comparison with a separate model of obesity, sixteen male db/db mice (stock #: 000697) were acquired from the Jackson Laboratory at eight weeks of age and housed until 14 weeks of age. All mice were allowed to acclimate to the photoperiod (12 h light/12 h dark) and temperature conditions (22°C ± 1°C) for at least seven days to provide time for normalization of physiological parameters due to transport (24). Mice offered a 30% sucrose solution show a strong preference to this liquid over water (25). Blood glucose was determined by weekly tail vein sampling using a 25 gauge needle. Body weight and body composition (by time-domain NMR) were also measured weekly. Food and liquid intake were measured daily by weighing the amount provided and subtracting the mass of the amount consumed over a 24 h period. Measurements were taken at the same time each day for two weeks. Following a four hour fast, animals were sedated by CO2 exposure, then euthanized by cervical dislocation. For measurements of energy expenditure, activity, and sleep time, mice were eleven weeks of age when acclimated to the training cages for one week. Thus, they were twelve weeks of age during the actual measurements. In the metabolic cage, corn cob bedding is included and there is an intake manifold (a small metal tube that runs along the perimeter of the cage to pull air). The training cage is exactly the same (bedding, dimensions, etc.) as the testing cage minus the manifold on the perimeter of the cage. Mice were single housed in the training cages and also in the metabolic cages during measurements. Animals were allowed continued free access to either standard drinking water (control group) or 30% sucrose (sucrose group) during metabolic cage time. All procedures were approved by the University of Tennessee (protocol 2171-0216) and PBRC Institutional Animal Care and Use Committee (protocol 972).
Glucose Tolerance Tests
Glucose tolerance measurements were taken at three and six weeks into the twelve week study. Animals in the 30% sucrose group were switched to standard drinking water overnight prior to glucose tolerance testing and the next morning both groups were placed in clean cages and fasted for four hours before beginning the GTT protocol. A 20% glucose solution was administered at a concentration of 2.5g/kg body weight via intraperitoneal (i.p.) injection. Blood glucose was read prior to injection using Breeze2 Glucometer (Bayer) using tail vein blood (time 0 min) and again at 20, 40, 60, and 120 mins after i.p. glucose injection.
RT-PCR, cDNA Synthesis, and mRNA Analysis
Total RNA was isolated from tissues using the guanidinium thiocyanate method (26), cDNA synthesized from total RNA, mRNA integrity analyzed, with mRNA transcripts measured using the Carbohydrate Metabolism and Regulation of Lipid Metabolism PrimePCR plates (M384) from Bio-Rad. This strategy allows for objective screening of key genes encoding enzymes linked with control of intermediary metabolism. All other primers used were designed using Primer3Plus software and are available in Supplementary Table 1. Normalization procedures to housekeeping control gene Rs9 has been described (27). Expression was deemed not detectable and given the label ‘N.D.’ if no expression over baseline was detected by forty cycles. Kits and reagents used, and protocols for procedures, have been previously described (28).
Glycogen and Acyl Glycerol assays
Total Acyl Glycerol was measured in rectus abdominis, mixed gastrocnemius, and liver. Glycogen levels were assessed in liver and rectus abdominis tissues. Reagents and protocols for both procedures are described in detail elsewhere (15, 28).
Serum Factors
The following kits were used to measure serum hormones: Mouse/Rat Leptin (Cat # MOB00) and Mouse/Rat FGF21 Quantikine (Cat # MF2100) ELISA kits from R&D Systems (Minneapolis, MN), and the Mouse Insulin ELISA kit (Cat # 10-1247-01) from Mercodia (Uppsala, Sweden) according to the manufacturers’ suggested protocols.
Pancreatic Islet Histology
After tissue collection in neutral-buffered formalin, pancreata were embedded in paraffin. Five μm sections were cut and placed onto positively charged slides. Insulin positive area (determined in square microns) was measured by immunohistochemistry. A complete description of the methods, equipment, and reagents used for detection of insulin and quantification of insulin positive area are given in ref. (29).
Statistical Analysis
One-way analysis of variance (ANOVA) was used when comparing three or more groups, repeated measures ANOVA for comparing continuous variables, Pearson correlations were calculated to assess linear associations between two variables, and t-tests were performed to compare two groups with respect to their outcome means. These measures were conducted using GraphPad Prism software v6.0. GraphPad Prism was used to calculate area under curve (AUC) for the glucose tolerance tests. Prism computes AUC using the trapezoid rule (30). Corresponding P and r values for the respective experiments are given in figures or figure legends. Analysis of covariance (ANCOVA) was performed to assess the impact of oxygen consumption, total body mass, fat mass, and fat-free mass as covariates on energy expenditure. Correlation analyses assessed the magnitude of statistical associations among the covariates. Statistical models were employed to evaluate statistical significance of differences between sucrose and water with respect to EE VO2, TBM, FM, FFM and LM. The SAS statistical software package was used to perform the ANCOVA analytic calculations (SAS Institute Inc., Cary NC).
Results
Sucrose intake in liquid form alters body composition and glucose tolerance
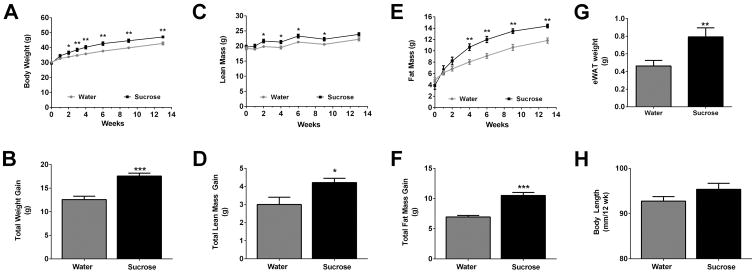
Free access to a liquid 30% sucrose solution leads to obesity in male C57BL/6J mice (Fig. 1). We found that mice, which were weight matched at the beginning of the study, begin to develop significantly increased body mass two weeks after ad libitum consumption of liquid sucrose (Fig. 1A). This increase in body mass was sustained over the course of the 12 week period (Fig. 1A) with mice consuming sucrose displaying 39.6% more total body mass over the control group (Fig. 1B). Mice drinking water ate similar amounts of solid food (3.51g/day) compared with mice drinking sucrose (3.35g/day). However, mice offered liquid sucrose consumed more liquid (10.26g/day) when compared with the water control group (6.11g/day), leading to greater caloric intake in the sucrose group (17.80 kcal/day) relative to the control group (12.97kcal/day).
Figure 1. Liquid sucrose consumption promotes weight gain and increases in both lean and fat mass in male C57BL/6J mice.
C57BL/6J male mice were administered either water (grey) or 30% sucrose (black) in their drinking water. Body weight (A), lean mass (C), and fat mass (E) were measured during the study period. Cumulative weight (B), lean mass (D), and fat mass (F) gained were calculated for both the water and 30% sucrose groups. Adipose tissue (eWAT ) weight after four weeks on sucrose (G) and body length at necropsy (H) were measured. Data are shown as means ± SEM. n = 8 per group. * P < 0.05, ** P < 0.01, *** P < 0.001 versus respective controls.
Lean mass was enhanced as early as two weeks (Fig. 1C) in the sucrose group, with a 40.3% gain over control by the end of the study (Fig. 1D). In addition, fat mass was elevated within two weeks after liquid sucrose consumption (Fig. 1E), with a 51% increase in total fat mass in the sucrose group relative to the control mice (Fig. 1F). The expansion of total fat mass is consistent with an increase in epididymal white adipose tissue weight after four weeks of continuous sucrose intake (Fig. 1G). We note that there was no significant change in body length (measured nose to anus) in response to sucrose consumption (Fig. 1H).
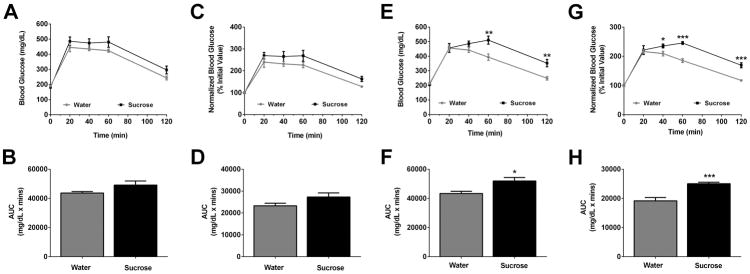
Three weeks after sucrose consumption, glucose tolerance was not significantly altered (Figs. 2A–D). However, by six weeks the mice consuming sucrose displayed clear alterations in glucose tolerance (Fig. 2E – raw data and Fig. 2F – normalized data). The area under the curve was significantly different for both raw (Fig. 2F; P < 0.05) and normalized values (Fig. 2H; P < 0.001).
Figure 2. Chronic consumption of sucrose impairs glucose tolerance in C57BL/6J mice.
GTTs were performed at 3 and 6 weeks into the study period (A–H). Data are represented as raw values (A and E), or normalized data where the initial time 0 value is set to 100% for both groups (C and G). AUC calculations for GTTs performed at 3 (B, D) and 6 weeks (F, H). Data are shown as means ± SEM. n = 8 per group. * P < 0.05, ** P < 0.01, *** P < 0.001 versus respective controls.
3.2 Elevations in leptin and FGF21, but no change in serum insulin, in response to liquid sucrose consumption
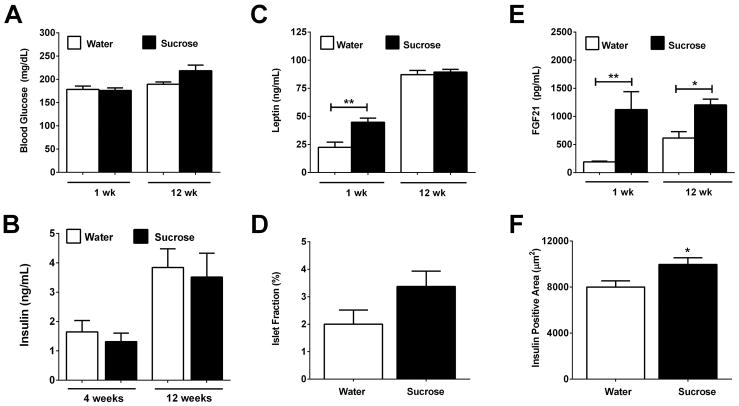
During the first week of sucrose drinking, there was no detectable difference in blood glucose between the mice (Fig. 3A). However, by the end of the study, the mice consuming sucrose displayed a trend towards increased blood glucose (Fig. 3A; 12wk water versus sucrose: P = 0.07). Serum levels of insulin also remained similar between groups (Fig. 3B). Leptin was elevated during the first week on sucrose (Fig. 3C), which is consistent with the early increase in fat mass (Figs. 1E, 1F, and 1G). However, by the end of the 12 week study, leptin levels were similar between the sucrose and control groups (Fig. 3C). There was a trend towards increased islet fraction (insulin positive area/pancreas area; Fig. 3D; P = 0.11), consistent with a modest increase in insulin positive area in response to sucrose (Fig. 3F). FGF21, a hormone known to be induced by carbohydrate in vitro (21), was elevated in vivo in response to sucrose intake (Fig. 3E).
Figure 3. Sucrose consumption increases circulating leptin and FGF21, but not insulin.
lood glucose (A), serum insulin (B), and serum leptin (C) were measured in male C57BL/6J mice after 1, 4, or 12 weeks in control (white bars) versus sucrose (black bars). Islet fraction (D), circulating levels of FGF21 (E), and insulin positive area (F) and were assessed. Data are represented as means ± SEM. n = 4 per group (1 week study) and n = 8 per group (12 week study). * P < 0.05, ** P < 0.01.
3.3 Sucrose ingestion increases RQ, energy expenditure, and caloric intake, but does not impact activity or sleep time
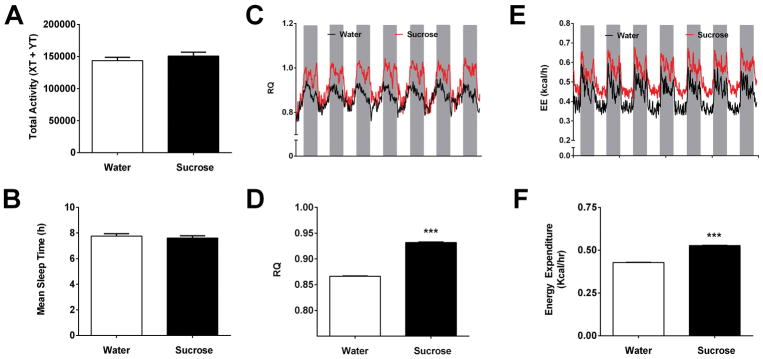
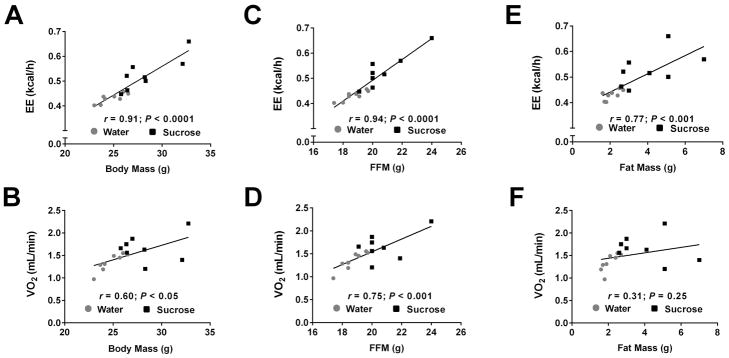
The increase in body mass observed in mice consuming sucrose (Fig. 1) was not due to a decrease in total activity measured during metabolic cage analyses (Fig. 4A). Additionally, average total sleep time was not different in mice drinking sucrose versus the control group during the study (Fig. 4B). As expected, the RQ was higher in mice consuming sucrose (Figs. 4C and 4D), reflecting an increase in carbohydrate usage. Despite no differences in physical activity, raw energy expenditure (average output per mouse) was increased by 22% in the group drinking sucrose relative to mice drinking water (Fig. 4E and 4F). Energy expenditure (EE) correlated with total body mass (TBM: r = 0.91, P <0.0001; Fig. 5A), fat-free mass (FFM: r = 0.94; P < 0.0001; Fig. 5C), and with fat mass (FM: r = 0.77; P < 0.001; Fig. 5E). By contrast, oxygen consumption (VO2) increased moderately as a function of TBM (r = 0.60; P < 0.05; Fig. 5B), strongly with FFM (r = 0.75; P < 0.001; Fig. 5D), but not with FM (r = 0.31; P = 0.25; Fig. 5F). Analysis of covariance (ANCOVA) for treatment effects on EE with TBM, VO2, and FFM taken as potential covariates for EE revealed that VO2 was the most influential single covariate (Supplementary Table 2). When the treatment means for EE were covariate adjusted for VO2, the EE mean for sucrose was significantly elevated (P < 0.025). When VO2 was held constant in four separate predictive models for EE that also included lean mass, TBM, FFM, and FM in turn as an additional covariate, each covariate was significantly correlated with EE. Using linear regression models, we determined that the proportionate amount of total variability in EE that could be attributed to each of the covariates was 0.827 (for TBM), 0.590 (FM) and 0.882 (FFM), respectively. However, when VO2 and TBM were simultaneously held constant, the other covariates being considered were not significant contributors to the prediction of EE (Supplementary Table 2).
Figure 4. Sucrose increases energy expenditure and RQ, but does alter activity or sleep time.
Mice were acclimated to drinking water or a 30% sucrose solution for one week prior to placement in metabolic cages. (A) Total activity and (B) mean sleep time during access to either water (white bars) or sucrose (black bars). (C) RQ at daily intervals showing light cycle (white) and dark cycle (grey). (D) Average RQ across all time points. (E) Energy expenditure (EE) at daily intervals showing the light and dark cycles. (F) Average EE over a 5 day period. n = 8 per group. ***, P < 0.001 versus water.
Figure 5. Increased oxygen consumption in response to sucrose intake correlates strongly with fat free mass.
Energy expenditure (EE) expressed as a function of total body mass (A), fat free mass (C), and fat mass (E) in mice consuming either water (grey circles) or sucrose (black squares). Oxygen consumption (VO2) shown in relationship to total body mass (B), fat free mass (D), and fat mass (F). FFM, fat free mass. n = 8 in each group.
3.4 Lipid, but not glycogen, storage increases in liver during sucrose consumption
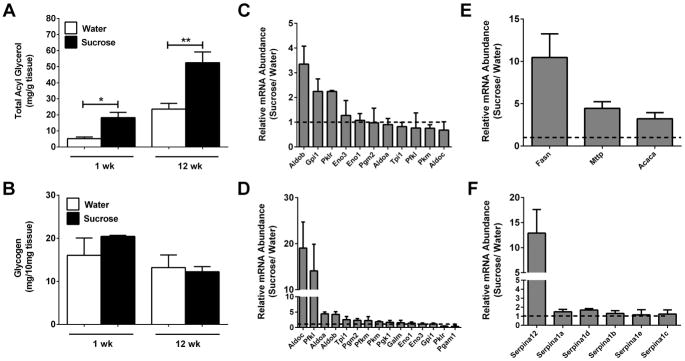
Total acyl glycerol accumulation was augmented in liver tissue starting one week after sucrose consumption (Fig. 6A) and remained elevated over control at 12 weeks (Fig. 6A). By contrast, liver glycogen storage was not impacted by either acute (1 week) or chronic (12 weeks) sucrose consumption (Fig. 6B). Several genes involved in carbohydrate processing were expressed more robustly at both acute and chronic time points (Figs. 6C and 6D). For example, aldolase B (AldoB) was elevated more than 3-fold in the sucrose group relative to the control group after one week (Fig. 6C). AldoB encodes the liver-form of the enzyme, which catalyzes the reversible cleavage of fructose 1,6-bisphosphate (FBP) into glyceraldehyde 3-phosphate and dihydroxyacetone phosphate (DHAP) as well as the bidirectional fragmentation of fructose 1-phosphate (F1P) into glyceraldehyde and dihydroxyacetone phosphate. The AldoB gene remains highly expressed at 12 weeks post-sucrose (>4-fold; Fig. 6D). In addition, Aldolase C (AldoC), which is normally expressed in the CNS, was upregulated approximately 19-fold by 12 weeks (Fig. 6D), which likely reflects the need to process the abundance of carbohydrates being ingested.
Figure 6. Liver lipid, but not glycogen, content is increased by liquid sucrose consumption.
Total acyl glycerol (A) and glycogen (B) content were measured using liver tissue from male C57BL/6J mice consuming either water or sucrose. Expression of genes relating to carbohydrate metabolism was quantified using RNA isolated from liver in the 1-week (C) and 12- week (D) studies. Total mRNA abundance of lipogenic (E) and serpin (F) genes were determined in liver tissue. Data in panels C, D, and F are represented as a ratio of expression in 30% sucrose group versus water group. Data are shown as means ± SEM. n = 8 per group (A, B, and E) or n = 3 per group (C, D, and F). * P < 0.05, ** P < 0.01, *** P < 0.001 versus respective controls.
Consistent with carbohydrate conversion to lipid as a storage form, the genes encoding acetyl CoA carboxylase (Acaca), fatty acid synthase (Fasn), and microsomal triglyceride transfer protein (Mttp) were all elevated in mice consuming sucrose relative to controls (Fig. 6E). Genes in the serpin class encode protease inhibitors that regulate a variety of biological processes, including inflammation. We found that the Serpin Family A Member 12 (SerpinA12 aka vaspin) gene was selectively expressed more than 12-fold in the livers of mice consuming sucrose (Fig. 6F).
3.5 Sucrose enhances the expression of genes associated with lipid metabolism in epididymal white adipose tissue, but does not promote lipid or glycogen storage in skeletal muscle
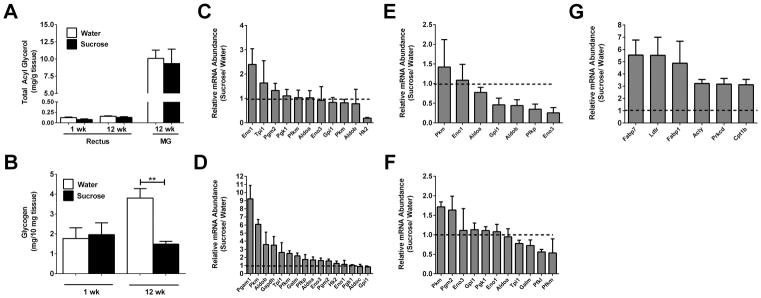
Because of the increase in lean mass observed in response to sucrose consumption (Fig. 1C), we examined both lipid and glycogen content in skeletal muscle. Using rectus abdominis (RA) and mixed gastrocnemius (MG), we found that while MG contains more total acyl glycerols when compared with RA, neither RA nor MG displayed elevated TGs in response to sucrose intake (Fig. 7A). While glycogen content increased with age in RA muscle of control mice (compare 1wk with 12wk; white bars), the group drinking sucrose did not accumulate glycogen over time (Fig. 7B). While surprising at first glance, these results in mice are similar to those observed in humans, where muscle glycogen is reduced in subjects with obesity and T2D (31). We also observed that there were minimal changes in expression of glycolytic enzyme genes in RA muscle after one week on sucrose (Fig. 7C). However, by 12 weeks there was a marked increase in genes encoding glycolytic enzymes, including upregulation of Pgam1, Pkm, and Gapdh (Fig. 7D).
Figure 7. Sucrose increases expression of genes linked with carbohydrate metabolism in skeletal muscle and expression of genes controlling lipid metabolism in epididymal white adipose tissue.
Total acyl glycerol (A) and glycogen (B) content were measured in the rectus abdominis and mixed gastrocnemius (MG) muscle depots from male C57BL/6J mice. Expression of genes involved in carbohydrate metabolism was determined in rectus muscle (C and D) and epididymal white adipose tissue (E and F). Data in panels C–F are represented as a ratio of expression of the 30% sucrose group versus water group (dashed line indicates expression of water control group). (G) Total mRNA abundance of genes regulating lipid metabolism were studied in the eWAT from mice on an oral 30% sucrose regimen. Data are shown as means ± SEM. n = 8 per group (A, B, and G) or n = 3 per group (C–F). * P < 0.05, ** P < 0.01 versus respective controls. eWAT, epididymal white adipose tissue.
When examining the eWAT from mice consuming sucrose versus controls, most genes encoding glycolytic enzymes were either unchanged or trending towards decreased expression (Fig. 7E and 7F). By contrast, several genes that regulate lipid metabolism were distinctly upregulated. For example, expression of carnitine palmitoyltransferase-1b (Cpt1b), which encodes an enzyme involved in fatty acid oxidation, is increased 3-fold in eWAT in response to sucrose (Fig. 7G). However, fabp7 and fabp1 were selectively expressed at higher levels (≥5-fold) in mice ingesting sucrose relative to controls (Fig. 7G).
3.6 Differential pattern of gene expression in inguinal white adipose tissue (iWAT) from mice consuming sucrose when compared with iWAT from genetically obese db/db mice
We next compared expression of the Cidea and Ucp-1genes, which often indicate browning of white adipose tissue, using the iWAT depots from two different models of obesity: mice consuming sucrose for 12 weeks in liquid form versus db/db mice, a genetic model of obesity produced by a defect in leptin receptor signaling. We found that the expression of Ucp1 and Cidea genes were elevated 28- and 15-fold, respectively, in response to sucrose consumption (Fig. 8A). By contrast, expression of Ucp1 was undetectable in iWAT from db/db mice (Fig. 8B). While Cidea is clearly increased in mice drinking sucrose, expression of this gene decreases in db/db mice relative to the lean controls (Fig. 8B). Next, we observed that expression of Nod1 is reduced by 89% in mice consuming sucrose (Fig. 8C). This is interesting because NOD1 restricts adipocyte differentiation (32); thus, a decrease in its expression would be expected to allow the expansion of adipose tissue, consistent with what is observed during sucrose intake (Fig. 1). We observed that neither db/db mice nor the lean control mice (db/+) express appreciable amounts of Nod1 transcripts in iWAT (Fig. 8D).
Figure 8. Distinct differences in gene expression profiles in inguinal white adipose tissue from obese db/db mice compared with C57BL/6J mice made obese by liquid sucrose intake.
Relative mRNA abundance of genes expressed in inguinal white adipose tissue from either C57BL/6J mice drinking either 30% sucrose or water (panels A,C, E, G, and I) versus 14 week old db/+ and db/db mice (panels B, D, F, H, and J). Data are plotted as means ± SEM. n = 8 per group. * P < 0.05, ** P < 0.01, **** P < 0.0001 versus respective controls. N.D. = not detectable.
Expression of adipoq, encoding the hormone adiponectin, was decreased in both the sucrose model of obesity and in db/db mice (Figs. 8C and 8D). In addition, Saa3 is expressed at lower levels in sucrose consuming mice (Fig. 8E), but is strikingly increased in expression in db/db mice (Fig. 8F). In addition, the macrophage marker Cd68 is expressed at lower levels in obesity driven by sucrose (Fig. 8E), but is unchanged in db/db mice relative to control (Fig. 8F).
Adipose tissue expression of vascular endothelial growth factors (VEGFs) modulates insulin resistance during high-fat feeding (33). Indeed, the metabolic benefits of intermittent fasting require VEGF, which may be in part through effects on macrophage polarization (34). Weight gain induced by sucrose intake was associated with a 93% decrease in expression of Vegfa and an 88% reduction in Vegfb mRNA levels (Fig. 8G). In adipose tissue of db/db mice (relative to the lean controls), the expression of Vegfa increased by 2.3-fold, while Vegfb transcripts declined by 56% (Fig. 8H).
Diacylglycerol acyltransferases, encoded by the dgat1 and dgat2 genes, catalyze the final step in triglyceride synthesis. We found that expression of dgat1 and dgat2 are reduced by 92% and 97%, respectively, in the iWAT from mice drinking sucrose (Fig. 8I). However, the expression of these genes was unchanged between lean db/+ and obese db/db mice (Fig. 8J).
Discussion
Caloric overload in its various forms (e.g., high-fat diet, SSBs, etc.), coupled with sedentary lifestyle, are major contributors to the rising rates of obesity. Indeed, nutrient excess from SSBs has increased substantially over the past 50+ years (7), likely contributing to the rising prevalence of metabolic disease (8). In the present study, we provided male C57BL/6J mice with free access to a 30% sucrose solution to investigate the specific metabolic consequences that occur in response to liquid sugar intake. Because all mice had access to the same solid chow diet, major metabolic differences between groups were able to be directly compared. One of the key findings herein is that changes in body composition precede changes in glucose tolerance.
Humans with a high 24-hour respiratory quotient (RQ) are more likely to show weight gain than those with a low RQ (35). Consistent with these results, we found that C57BL/6J mice consuming liquid sucrose consistently had higher RQ values (Figs. 4C and 4D) and that these mice gained more weight (Fig. 1). However, elevated levels of insulin are clearly not required to achieve this enhanced body mass in response to liquid sucrose consumption (Fig. 3B). These data provide an intriguing difference between obesity induced by high-fat diet, where insulin levels rise (15, 36), and adiposity driven by liquid sucrose. Thus, whether insulin is simply permissive for weight gain, or a direct contributor to weight gain, may be dependent on dietary context (i.e., precise macronutrient intake).
When adiposity decreases, there are corresponding reductions in circulating insulin (37). Interestingly, mice with genetic deletion of multiple copies of the insulin gene resist weight gain on a high-fat diet (17), indicating that a threshold level of insulin may be required to support adiposity and elevations in total body mass in response to excess dietary lipid. Because elevations in circulating insulin are not required to promote weight gain or deposition of adipose tissue during ad libitum access to liquid sucrose, we interpret this data to indicate that excess carbohydrate intake is a particularly potent factor supporting weight gain. Thus, under certain conditions (e.g., free consumption of SSBs), the amount of basal insulin present in circulation is likely sufficient to route the excess substrate into lipid storage and/or to adequately suppress fatty acid oxidation in favor of carbohydrate oxidation, resulting in higher RQ values and subsequent weight gain. A separate, but not mutually exclusive possibility, is that calories consumed in liquid versus solid form may elicit distinct endocrine responses in mice, consistent with observations in humans (38).
Intriguingly, glycogen content of liver (Fig. 6B) and muscle (Fig. 7B) is not elevated by sucrose consumption, while liver lipid content was increased (Fig.6A). Expression of the SerpinA12 gene, which is linked with obesity and T2D (39), is upregulated in livers of mice consuming sucrose (Fig. 6F). Although insulin positive area was modestly enhanced by sucrose consumption (Fig. 3F), islet fraction was unaltered (Fig. 3D). By contrast, excess lipid in the diet promotes enlarged pancreatic β-cell mass, generally resulting from enhanced β-cell proliferation within the islets (40).
Perhaps greater circulating FGF21 levels serve as an insulin “sensitizing” signal or as a feedback loop to prevent excess weight gain by increasing energy expenditure (Fig. 4E). Indeed, augmented FGF21 in circulation promotes browning of white adipose tissue (see ref. (41) and Fig. 8A), which often correlates with enhanced energy expenditure [see Figs. 4E, 4F, and ref. (42)]. Importantly, our results using C57BL/6J mice consuming sucrose are analogous to human studies showing that energy expenditure increased specifically in subjects ingesting a sucrose rich diet (43). However, two limitations of our study are that we did not use clamp techniques to determine whether the lipid accumulation in liver prevents the normal suppression of hepatic glucose production by insulin and we did not study obesity driven by sucrose in female mice. These are important considerations for future studies.
In summary, sucrose intake promotes weight gain and adiposity with distinct metabolic differences when compared with the db/db mouse model of obesity. From a translational perspective, the data in this study agrees with human studies in several aspects. First, sucrose intake rapidly promotes greater weight gain and increased fat mass in mice (Fig. 1) and humans (13). Second, energy expenditure is greater in mice (Fig. 4E) and humans consuming sucrose (43). Third, elevations in RQ are associated with weight gain in mice (Fig. 4C) and humans (35). Fourth, sucrose promotes lipid accumulation in liver of mice (Fig. 6A), rats (44), and humans (45). In summary, we conclude that male C57BL/6J mice consuming liquid sucrose provide a model of obesity and glucose intolerance with key physiologic features that are relevant to human metabolic disease.
Supplementary Material
What is already known about this subject?
Liquid sucrose consumption promotes weight gain in rodents and humans.
Weight gain in general has typically been associated with elevations in circulating insulin.
Deletion of multiple copies of the insulin genes in rodents prevents weight gain on high-fat diets.
What is already known about this subject?
Liquid sucrose consumption promotes weight gain and glucose intolerance without increasing circulating insulin levels.
Liquid sucrose consumption promotes increases in energy expenditure, which is the opposite effect observed with high-fat diet consumption.
Lipid accumulation occurs preferentially in liver, but not skeletal muscle, and there are no observed increases in glycogen accumulation in either tissue.
Acknowledgments
Funding Support: This work was supported by the following National Institutes of Health grants: P20 GM103528 and R01 DK103860. This project also used core facilities supported by NORC Center Grant P30 DK072476, COBRE Center Grant P30 GM118430, Shared Instrumentation Grant S10 OD023703, and the Louisiana Clinical and Translational Science Center grant U54 GM104940.
The authors thank Dr. Chris Morrison for useful discussions.
Abbreviations
- ANCOVA
analysis of covariance
- EE
energy expenditure
- eWAT
epididymal white adipose tissue
- FGF21
fibroblast growth factor-21
- FFM
fat-free mass
- GTT
glucose tolerance test
- iWAT
inguinal white adipose tissue
- LBM
lean body mass
- MG
mixed gastrocnemius
- SSB
sugar-sweetened beverages
- TBM
total body mass
Footnotes
All authors declare no conflicts of interest.
Supplementary Tables 1 and 2 are present as part of this study.
References
- 1.Collaboration NCDRF. Trends in adult body-mass index in 200 countries from 1975 to 2014: a pooled analysis of 1698 population-based measurement studies with 19. 2 million participants. Lancet. 2016;387:1377–1396. doi: 10.1016/S0140-6736(16)30054-X. [DOI] [PMC free article] [PubMed] [Google Scholar]
- 2.Bray GA. Medical consequences of obesity. J Clin Endocrinol Metab. 2004;89:2583–2589. doi: 10.1210/jc.2004-0535. [DOI] [PubMed] [Google Scholar]
- 3.Laxy M, Stark R, Peters A, Hauner H, Holle R, Teuner CM. The Non-Linear Relationship between BMI and Health Care Costs and the Resulting Cost Fraction Attributable to Obesity. Int J Environ Res Public Health. 2017;14 doi: 10.3390/ijerph14090984. [DOI] [PMC free article] [PubMed] [Google Scholar]
- 4.Doria A, Patti ME, Kahn CR. The emerging genetic architecture of type 2 diabetes. Cell Metab. 2008;8:186–200. doi: 10.1016/j.cmet.2008.08.006. [DOI] [PMC free article] [PubMed] [Google Scholar]
- 5.Stanhope KL. Sugar consumption, metabolic disease and obesity: The state of the controversy. Crit Rev Clin Lab Sci. 2016;53:52–67. doi: 10.3109/10408363.2015.1084990. [DOI] [PMC free article] [PubMed] [Google Scholar]
- 6.Rippe JM, Angelopoulos TJ. Relationship between Added Sugars Consumption and Chronic Disease Risk Factors: Current Understanding. Nutrients. 2016;8 doi: 10.3390/nu8110697. [DOI] [PMC free article] [PubMed] [Google Scholar]
- 7.Bray GA. Energy and fructose from beverages sweetened with sugar or high-fructose corn syrup pose a health risk for some people. Advances in nutrition. 2013;4:220–225. doi: 10.3945/an.112.002816. [DOI] [PMC free article] [PubMed] [Google Scholar]
- 8.Malik VS, Popkin BM, Bray GA, Despres JP, Willett WC, Hu FB. Sugar-sweetened beverages and risk of metabolic syndrome and type 2 diabetes: a meta-analysis. Diabetes Care. 2010;33:2477–2483. doi: 10.2337/dc10-1079. [DOI] [PMC free article] [PubMed] [Google Scholar]
- 9.Stanhope KL, Medici V, Bremer AA, Lee V, Lam HD, Nunez MV, et al. A dose-response study of consuming high-fructose corn syrup-sweetened beverages on lipid/lipoprotein risk factors for cardiovascular disease in young adults. Am J Clin Nutr. 2015;101:1144–1154. doi: 10.3945/ajcn.114.100461. [DOI] [PMC free article] [PubMed] [Google Scholar]
- 10.Ludwig DS, Peterson KE, Gortmaker SL. Relation between consumption of sugar-sweetened drinks and childhood obesity: a prospective, observational analysis. Lancet. 2001;357:505–508. doi: 10.1016/S0140-6736(00)04041-1. [DOI] [PubMed] [Google Scholar]
- 11.Mayes PA. Intermediary metabolism of fructose. Am J Clin Nutr. 1993;58:754S–765S. doi: 10.1093/ajcn/58.5.754S. [DOI] [PubMed] [Google Scholar]
- 12.Domingos AI, Vaynshteyn J, Voss HU, Ren X, Gradinaru V, Zang F, et al. Leptin regulates the reward value of nutrient. Nature neuroscience. 2011;14:1562–1568. doi: 10.1038/nn.2977. [DOI] [PMC free article] [PubMed] [Google Scholar]
- 13.Raben A, Vasilaras TH, Moller AC, Astrup A. Sucrose compared with artificial sweeteners: different effects on ad libitum food intake and body weight after 10 wk of supplementation in overweight subjects. Am J Clin Nutr. 2002;76:721–729. doi: 10.1093/ajcn/76.4.721. [DOI] [PubMed] [Google Scholar]
- 14.Shanik MH, Xu Y, Skrha J, Dankner R, Zick Y, Roth J. Insulin resistance and hyperinsulinemia: is hyperinsulinemia the cart or the horse? Diabetes Care. 2008;31(Suppl 2):S262–268. doi: 10.2337/dc08-s264. [DOI] [PubMed] [Google Scholar]
- 15.Burke SJ, Batdorf HM, Burk DH, Noland RC, Eder AE, Boulos MS, et al. db/db Mice Exhibit Features of Human Type 2 Diabetes That Are Not Present in Weight-Matched C57BL/6J Mice Fed a Western Diet. Journal of diabetes research. 2017;2017:8503754. doi: 10.1155/2017/8503754. [DOI] [PMC free article] [PubMed] [Google Scholar]
- 16.Jeanrenaud B. Hyperinsulinemia in obesity syndromes: its metabolic consequences and possible etiology. Metabolism. 1978;27:1881–1892. doi: 10.1016/s0026-0495(78)80006-7. [DOI] [PubMed] [Google Scholar]
- 17.Mehran AE, Templeman NM, Brigidi GS, Lim GE, Chu KY, Hu X, et al. Hyperinsulinemia drives diet-induced obesity independently of brain insulin production. Cell Metab. 2012;16:723–737. doi: 10.1016/j.cmet.2012.10.019. [DOI] [PubMed] [Google Scholar]
- 18.D'Souza AM, Johnson JD, Clee SM, Kieffer TJ. Suppressing hyperinsulinemia prevents obesity but causes rapid onset of diabetes in leptin-deficient Lepob/ob mice. Molecular metabolism. 2016;5:1103–1112. doi: 10.1016/j.molmet.2016.09.007. [DOI] [PMC free article] [PubMed] [Google Scholar]
- 19.Kliewer SA, Mangelsdorf DJ. Fibroblast growth factor 21: from pharmacology to physiology. Am J Clin Nutr. 2010;91:254S–257S. doi: 10.3945/ajcn.2009.28449B. [DOI] [PMC free article] [PubMed] [Google Scholar]
- 20.Laeger T, Henagan TM, Albarado DC, Redman LM, Bray GA, Noland RC, et al. FGF21 is an endocrine signal of protein restriction. J Clin Invest. 2014;124:3913–3922. doi: 10.1172/JCI74915. [DOI] [PMC free article] [PubMed] [Google Scholar]
- 21.Iizuka K, Takeda J, Horikawa Y. Glucose induces FGF21 mRNA expression through ChREBP activation in rat hepatocytes. FEBS Lett. 2009;583:2882–2886. doi: 10.1016/j.febslet.2009.07.053. [DOI] [PubMed] [Google Scholar]
- 22.Galman C, Lundasen T, Kharitonenkov A, Bina HA, Eriksson M, Hafstrom I, et al. The circulating metabolic regulator FGF21 is induced by prolonged fasting and PPARalpha activation in man. Cell Metab. 2008;8:169–174. doi: 10.1016/j.cmet.2008.06.014. [DOI] [PubMed] [Google Scholar]
- 23.Patel R, Bookout AL, Magomedova L, Owen BM, Consiglio GP, Shimizu M, et al. Glucocorticoids regulate the metabolic hormone FGF21 in a feed-forward loop. Mol Endocrinol. 2015;29:213–223. doi: 10.1210/me.2014-1259. [DOI] [PMC free article] [PubMed] [Google Scholar]
- 24.Obernier JA, Baldwin RL. Establishing an appropriate period of acclimatization following transportation of laboratory animals. ILAR J. 2006;47:364–369. doi: 10.1093/ilar.47.4.364. [DOI] [PubMed] [Google Scholar]
- 25.Alsio J, Nordenankar K, Arvidsson E, Birgner C, Mahmoudi S, Halbout B, et al. Enhanced sucrose and cocaine self-administration and cue-induced drug seeking after loss of VGLUT2 in midbrain dopamine neurons in mice. J Neurosci. 2011;31:12593–12603. doi: 10.1523/JNEUROSCI.2397-11.2011. [DOI] [PMC free article] [PubMed] [Google Scholar]
- 26.Chomczynski P, Sacchi N. The single-step method of RNA isolation by acid guanidinium thiocyanate-phenol-chloroform extraction: twenty-something years on. Nat Protoc. 2006;1:581–585. doi: 10.1038/nprot.2006.83. [DOI] [PubMed] [Google Scholar]
- 27.Scott DK, Collier JJ, Doan TT, Bunnell AS, Daniels MC, Eckert DT, et al. A modest glucokinase overexpression in the liver promotes fed expression levels of glycolytic and lipogenic enzyme genes in the fasted state without altering SREBP-1c expression. Mol Cell Biochem. 2003;254:327–337. doi: 10.1023/a:1027306122336. [DOI] [PubMed] [Google Scholar]
- 28.Burke SJ, Batdorf HM, Eder AE, Karlstad MD, Burk DH, Noland RC, et al. Oral Corticosterone Administration Reduces Insulitis but Promotes Insulin Resistance and Hyperglycemia in Male Nonobese Diabetic Mice. Am J Pathol. 2017;187:614–626. doi: 10.1016/j.ajpath.2016.11.009. [DOI] [PMC free article] [PubMed] [Google Scholar]
- 29.Burke SJ, Karlstad MD, Eder AE, Regal KM, Lu D, Burk DH, et al. Pancreatic beta-Cell production of CXCR3 ligands precedes diabetes onset. BioFactors. 2016;42:703–715. doi: 10.1002/biof.1304. [DOI] [PMC free article] [PubMed] [Google Scholar]
- 30.Jaki TW, MJ A Theoretical Framework for Estimation of AUCs in Complete and Incomplete Sampling Designs. Statistics in Biopharmaceutical Research. 2009;1:176–184. [Google Scholar]
- 31.He J, Kelley DE. Muscle glycogen content in type 2 diabetes mellitus. Am J Physiol Endocrinol Metab. 2004;287:E1002–1007. doi: 10.1152/ajpendo.00015.2004. [DOI] [PubMed] [Google Scholar]
- 32.Purohit J, Hu P, Burke SJ, Collier JJ, Chen J, Zhao L. The effects of NOD activation on adipocyte differentiation. Obesity (Silver Spring) 2013;21:737–747. doi: 10.1002/oby.20275. [DOI] [PubMed] [Google Scholar]
- 33.Elias I, Franckhauser S, Ferre T, Vila L, Tafuro S, Munoz S, et al. Adipose tissue overexpression of vascular endothelial growth factor protects against diet-induced obesity and insulin resistance. Diabetes. 2012;61:1801–1813. doi: 10.2337/db11-0832. [DOI] [PMC free article] [PubMed] [Google Scholar]
- 34.Kim KH, Kim YH, Son JE, Lee JH, Kim S, Choe MS, et al. Intermittent fasting promotes adipose thermogenesis and metabolic homeostasis via VEGF-mediated alternative activation of macrophage. Cell Res. 2017;27:1309–1326. doi: 10.1038/cr.2017.126. [DOI] [PMC free article] [PubMed] [Google Scholar]
- 35.Ravussin E. Metabolic differences and the development of obesity. Metabolism. 1995;44:12–14. doi: 10.1016/0026-0495(95)90312-7. [DOI] [PubMed] [Google Scholar]
- 36.Surwit RS, Kuhn CM, Cochrane C, McCubbin JA, Feinglos MN. Diet-induced type II diabetes in C57BL/6J mice. Diabetes. 1988;37:1163–1167. doi: 10.2337/diab.37.9.1163. [DOI] [PubMed] [Google Scholar]
- 37.Parekh PI, Petro AE, Tiller JM, Feinglos MN, Surwit RS. Reversal of diet-induced obesity and diabetes in C57BL/6J mice. Metabolism. 1998;47:1089–1096. doi: 10.1016/s0026-0495(98)90283-9. [DOI] [PubMed] [Google Scholar]
- 38.DiMeglio DP, Mattes RD. Liquid versus solid carbohydrate: effects on food intake and body weight. Int J Obes Relat Metab Disord. 2000;24:794–800. doi: 10.1038/sj.ijo.0801229. [DOI] [PubMed] [Google Scholar]
- 39.Youn BS, Kloting N, Kratzsch J, Lee N, Park JW, Song ES, et al. Serum vaspin concentrations in human obesity and type 2 diabetes. Diabetes. 2008;57:372–377. doi: 10.2337/db07-1045. [DOI] [PubMed] [Google Scholar]
- 40.Stamateris RE, Sharma RB, Hollern DA, Alonso LC. Adaptive beta-cell proliferation increases early in high-fat feeding in mice, concurrent with metabolic changes, with induction of islet cyclin D2 expression. Am J Physiol Endocrinol Metab. 2013;305:E149–159. doi: 10.1152/ajpendo.00040.2013. [DOI] [PMC free article] [PubMed] [Google Scholar]
- 41.Fisher FM, Kleiner S, Douris N, Fox EC, Mepani RJ, Verdeguer F, et al. FGF21 regulates PGC-1alpha and browning of white adipose tissues in adaptive thermogenesis. Genes Dev. 2012;26:271–281. doi: 10.1101/gad.177857.111. [DOI] [PMC free article] [PubMed] [Google Scholar]
- 42.Laeger T, Albarado DC, Burke SJ, Trosclair L, Hedgepeth JW, Berthoud HR, et al. Metabolic Responses to Dietary Protein Restriction Require an Increase in FGF21 that Is Delayed by the Absence of GCN2. Cell reports. 2016;16:707–716. doi: 10.1016/j.celrep.2016.06.044. [DOI] [PMC free article] [PubMed] [Google Scholar]
- 43.Raben A, Macdonald I, Astrup A. Replacement of dietary fat by sucrose or starch: effects on 14 d ad libitum energy intake, energy expenditure and body weight in formerly obese and never-obese subjects. Int J Obes Relat Metab Disord. 1997;21:846–859. doi: 10.1038/sj.ijo.0800494. [DOI] [PubMed] [Google Scholar]
- 44.Roncal-Jimenez CA, Lanaspa MA, Rivard CJ, Nakagawa T, Sanchez-Lozada LG, Jalal D, et al. Sucrose induces fatty liver and pancreatic inflammation in male breeder rats independent of excess energy intake. Metabolism. 2011;60:1259–1270. doi: 10.1016/j.metabol.2011.01.008. [DOI] [PMC free article] [PubMed] [Google Scholar]
- 45.Maersk M, Belza A, Stodkilde-Jorgensen H, Ringgaard S, Chabanova E, Thomsen H, et al. Sucrose-sweetened beverages increase fat storage in the liver, muscle, and visceral fat depot: a 6-mo randomized intervention study. Am J Clin Nutr. 2012;95:283–289. doi: 10.3945/ajcn.111.022533. [DOI] [PubMed] [Google Scholar]
Associated Data
This section collects any data citations, data availability statements, or supplementary materials included in this article.


