Abstract
This study explores the effect of carbon sphere preparation conditions on the morphology of the carbon spheres and the micropore development by fast potassium hydroxide activation via microwave heating. Enzymatic hydrolysis lignin is used as the precursor for carbon sphere preparation via environmentally friendly hydrothermal carbonization. The effects of various carbonization temperatures, carbonization times and reaction concentrations on the physical morphology of the carbon sphere surfaces are investigated. The Brunauer-Emmett-Teller surface area, yield and scanning electron microscopic images are used to characterize the carbon spheres. High carbonization temperatures and times result in large particle sizes, high sphericity, uniform size, and high dispersity of the carbon spheres. The best carbon spheres are obtained at 270 °C for 7 hours with a reaction concentration of 0.06 g ml−1 and a particle size of 3–6 μm. After activation, the Brunauer-Emmett-Teller surface area of the activated carbon spheres increases from 248 m2 g−1 to 1278 m2 g−1. Carbon spheres activated by treatment with fast potassium hydroxide and microwave heating can develop micropores that enhance the adsorptive capacity for small molecules, such as gases. Enzymatic hydrolysis lignin-derived carbon spheres formed via hydrothermal carbonization should be potentially sustainable materials applicable in energy and environmental fields.
Introduction
Carbon spheres (CSs) have garnered significant interest among researchers because of their potential applications, e.g., in gas separation and as molecular sieves1,2, photonic band gap crystals3,4, catalyst supports5,6 and electrode materials for lithium ion batteries7,8. CSs serve as supporting substrates owing to their high surface area and high structural stability, among other properties. Compared with coal, petroleum, or their derived products, CSs derived from sustainable, inexpensive and environmentally benign biomass for energy storage have become particularly fascinating9–14.
Lignin is the most abundant aromatic polymer on earth and must be removed before natural biomass is converted to prepared biofuel15. However, in the preparation of biofuel ethanol using lignocellulosic materials, large quantities of enzymatic hydrolysis residues, whose main components are lignin, are produced. Research shows that 6–7 tons of cornstalk can produce 1 ton of fuel ethanol. That mass of cornstalk can also produce 1 ton of residue at the same time, which contains a large amount of (approximately 40~50%) enzymatic hydrolysis lignin (EHL), in addition to a small amount of non-hydrolyzed cornstalk and other impurities15–17. With the development of the lignocellulosic ethanol industry, EHL will inevitably become an abundant renewable resource. The value-added utilization of EHL can significantly reduce the production cost of lignocellulosic ethanol and effectively enhance the economic viability of the lignocellulosic ethanol industry. Unlike lignin made from traditional sulfite or alkaline pulping, EHL does not undergo alkaline or sulfite cooking and therefore better retains active groups containing more lignin, such as phenol hydroxyl and alcoholic hydroxyl. In addition, EHL exhibits small dispersivity and a low relative molecular weight relative to traditional industrial lignin and thereby enjoys broad application prospects. As the molecular chain of lignin contains a large number of phenyl rings, with a carbon content of over 50%, lignin is considered a suitable raw material for carbon materials18,19. However, EHL has not been further developed and utilized. In reported studies, EHL is only burned off as fuel and has a low added value, causing a serious waste of resources20.
Carbon materials can be prepared or manufactured from various types of raw materials whose innate characteristics can affect the properties and qualities of the resulting carbon21. Among the available techniques22, so-called hydrothermal carbonization (HTC) affords carbon spheres with superior and promising properties for various applications23. The HTC process is more environmentally friendly than other methods because it proceeds under a closed system and at low temperatures24. Mi et al. used a hydrothermal route in a stainless-steel autoclave with optimal reaction conditions of 500 °C and 12 h to successfully synthesize carbon microspheres with a regular shape and a diameter of 1 to 2 μm25. Simsir et al. investigated the hydrothermal carbonization of glucose, cellulose, chitin, chitosan and wood chips at 200 °C at processing times between 6 and 48 h. The average sizes of carbon spheres using glucose and chitosan were found to be 560 and 42 nm, respectively26. In 2009, Sevilla and Fuertes used glucose, sucrose and starch as raw materials to study the effect of hydrothermal carbonization on the structure and properties of carbon microspheres27. The researchers ultimately synthesized uniform spherical microparticles with a diameter of 0.4–6 μm and found that the microspheres exhibited a core-shell structure composed of a highly aromatic nucleus (hydrophobic) and a hydrophilic shell. The structures contained a high concentration of reactive oxygen functional groups (i.e., hydroxyl/phenolic, carbonyl, or carboxylic) and a large number of surface hydroxyl, carbonyl, keto, carboxyl groups. In addition, the results showed that the main factors affecting the size of the carbon microspheres were the concentration of the saccharide solution, reaction time and temperature. Finally, the size distribution of carbon microspheres formed at a high reaction temperature are highly uniform27. Despite the aforementioned efforts, to date, systematic investigations of the effects of various factors on the preparation of uniform and separate carbon spheres derived from EHL have not been widely reported. Thus, the development of a synthesis method using enzymatic hydrolysis lignin is well suited for this application. As commonly observed for HTC products, hydrothermal carbon spheres have no relevant porosity, which hinders their potential application for gas adsorption and energy storage27,28.
As discussed above, the use of EHL for preparing functional carbon materials via the HTC method is relatively simple. However, the processes and reactions involved in the HTC are highly complex. The surface of the CSs thus obtained consisted of abundant oxygen-containing functional groups, and the size and dispersion of the CSs could be modified by adjusting the reaction conditions. To gain separate, stable and uniform carbon spheres, this study used the EHL as the raw material and the HTC method to synthesize carbon spheres. The influence of reaction conditions on the morphology of carbon spheres was examined. The research involved the following: (1) use of the HTC method to investigate the effects of the EHL concentration, reaction temperatures and reaction times on the characterization of the microstructure and surface functional groups of the spheres via scanning electron microscopy (SEM) and Fourier transform infrared spectroscopy (FTIR) and (2) systematic examination of the effects of KOH and microwave heating on the porous structure and surface chemistry of carbon spheres. The derived CSs can be widely applied in hydrogen storage, capacitors and other applications. CSs have promising application prospects and offer many challenges for future study. Enzymatic hydrolysis lignin-derived carbon spheres activated by microwave heating and KOH should be potentially sustainable materials for application in environmental gas adsorption.
Results and Discussion
The effects of HTC conditions
Effect of reaction temperature on the morphology of CSs
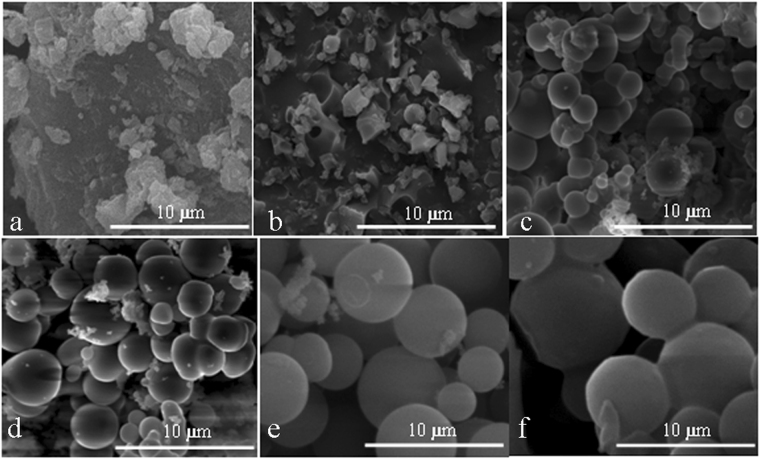
Figure 1 shows SEM images of EHL-derived carbon spheres synthesized by HTC at different reaction temperatures. The figure shows that EHL was used as a raw material to synthesize CSs, and the carbonization time and concentration were 7 h and 0.06 g ml−1, respectively. CSs synthesized at different reaction temperatures showed variations in morphology, particle size and dispersion. At 220 °C, the prepared solid product (Fig. 1b) is quite similar to the original EHL in morphology (Fig. 1a), and no spherical structure appears. At reaction temperatures above 230 °C, CSs with a particle size of approximately 2 μm appears. Under these conditions, the surface of the CS was rather smooth. However, the size of the particles was not sufficiently uniform.
Figure 1.
SEM images of extracted EHL (a) and carbon spheres formed at 220 °C (b), 230 °C (c), 250 °C (d), 270 °C (e), and 290 °C (f) (the carbonization time and concentration were 7 hours and 0.06 g ml-1, respectively).
With the increase in the HTC reaction temperature (230–270 °C), the particle size of the derived CSs increased from approximately 2 to 3 μm (Fig. 1c,d), and the dispersion became slightly better. This finding indicates that increasing the reaction temperature is conducive to the hydrolysis of EHL and plays a decisive role in the formation of CSs. Moreover, the increase affects the particle size of CSs29. However, when the reaction temperature was increased from 270 to 290 °C (Fig. 1), aggregation and cross-linking of the CSs began to occur. Therefore, 270 °C is the optimal reaction temperature for CS synthesis.
Effect of reaction time on the morphology of CSs
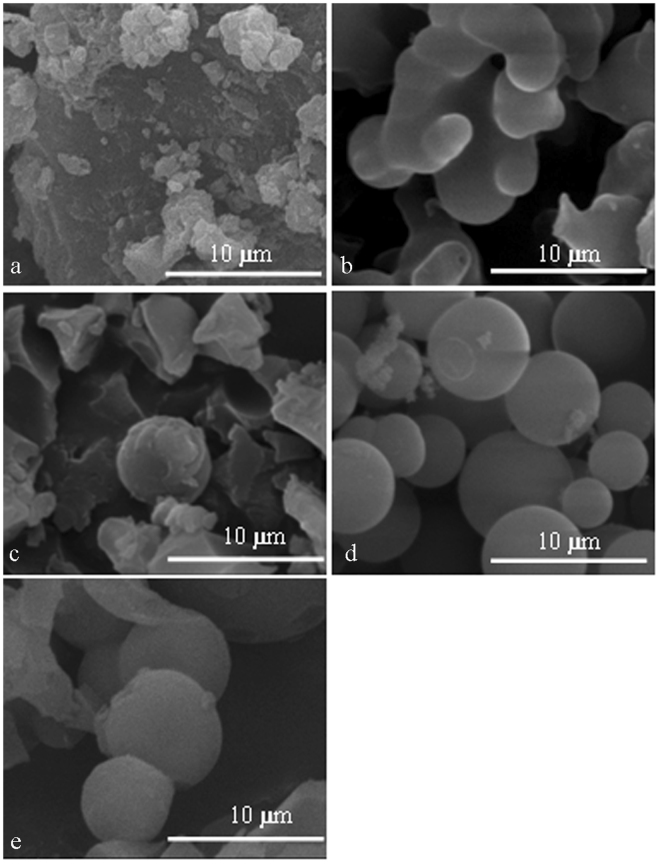
Figure 2 shows the effect of different reaction times on the morphology of CSs at a carbonization temperature of 270 °C and a reaction concentration of 0.06 g ml−1. Figure 2 shows that when the reaction time was 3 h, no distinct spherical shape is formed. Instead, irregularly shaped clusters formed. It can be inferred that hydrolysis may have just begun for EHL; therefore, more complete CSs have not yet been formed.
Figure 2.
SEM images of extracted EHL (a) and carbon spheres formed at carbonization times of 3 h (b), 5 h (c), 7 h (d) and 9 h (e) (the carbonization temperature and concentration were 270 °C and 0.06 g ml−1, respectively).
Effect of reaction concentration on the morphology of CSs
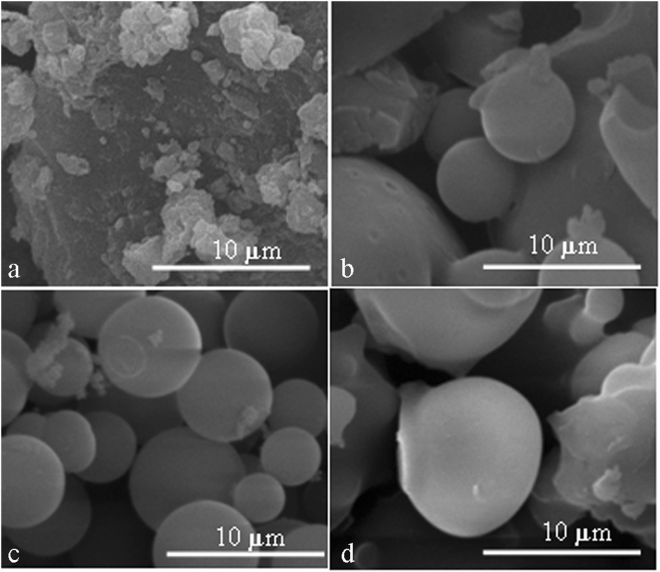
The concentration of the EHL solution affects the formation of monodisperse carbon spheres, as the CSs are attracted to each other by van der Waals forces, leading to agglomerated collections of CSs30. Figure 3 depicts the SEM images of extracted EHL and carbon spheres formed at concentrations of 0.04 g ml−1, 0.06 g ml−1 and 0.08 g ml−1. The carbonization temperature and time were 270 °C and 7 h, respectively. With an increase in the solution concentration from 0.04 g ml−1 to 0.06 g ml−1, spherical particles gradually formed, ultimately forming separate particles with uniform dimensions/shapes. However, when the concentration was raised from 0.06 g ml−1 to 0.08 g ml−1, a cluster of agglomerated spheres formed. Therefore, the concentration of 0.06 g ml−1 is the best concentration for synthesis under the carbonization conditions applied in this study.
Figure 3.
SEM images of extracted EHL (a) and carbon spheres at EHL concentrations of 0.04 g ml−1 (b), 0.06 g ml−1 (c) and 0.08 g ml−1 (d) (the carbonization temperature and time were 270 °C and 7 h, respectively).
The effects of microwave heating on CSs
Yield and proximate analysis
Hydrothermal carbonization on EHL resulted in carbon sphere and activated carbon sphere yields of 65.2% and 57.5%, respectively (Table 1). The CS yield was lower than the hydrothermal carbonization carbon yield. Heating enabled KOH to react more intensely with carbon, releasing more of its volatile content and hence lowering the carbon yield31.
Table 1.
Yield and elementary analysis of EHL, carbon spheres (CSs) and activated carbon spheres (ACSs).
| Samples | Yield (%) | C (%) | O (%) | N (%) | H (%) |
|---|---|---|---|---|---|
| EHL-raw | — | 77.5 | 20.6 | 0.25 | 1.65 |
| Hydrothermal Carbonization (CSs) | 65.2 | 88.1 | 10.4 | 0.2 | 1.5 |
| After microwave heating (ACSs) | 57.5 | 95.2 | 3.5 | 0.1 | 1.2 |
The proportionate weight changes of four elements (C, N, H, and O) were measured after the activation process. The results showed that the concentrations of all four elements were drastically reduced. These results indicated that activation effectively removed impurities and improved the relative carbon proportion in the solid phase.
BET surface area and pore size distribution
It is important to characterize the pore structure of carbon sphere materials. This characterization is most frequently conducted at cryogenic temperatures, namely, by the adsorption of an inert gas, such as N2 at its boiling point of 77 K under one atmosphere of pressure. Figure 4 displays the typical N2 adsorption/desorption isotherms at 77 K of the carbon spheres (carbonization temperature of 270 °C, carbonization time of 7 h, and concentration of 0.06 g ml−1) and KOH activated carbon spheres via microwave heating. A short duration of microwave heating of the KOH/CS mixture had a positive effect on the nitrogen adsorption capacity, which increased from 28 to 59 cc g−1, indicating that activation by KOH develops extensive porosity within the carbon spheres. These observations are confirmed by the pore structure parameters in Table 2. The values for BET specific surface area, mesopore surface area, micropore pore volume, and total pore volume were 1240 m2 g−1, 0.503 cc g−1 and 0.621 cc g−1, respectively. Both isotherm curves initially rose rapidly at very low relative pressures and then suddenly stopped rising; this behavior is attributed to the closing of adjacent pore walls such that multilayers of the activated carbon spheres could not be produced. The three isotherms were observed to be type I according to the Brunauer, Deming, Deming and Teller (BDDT) classification32.
Figure 4.
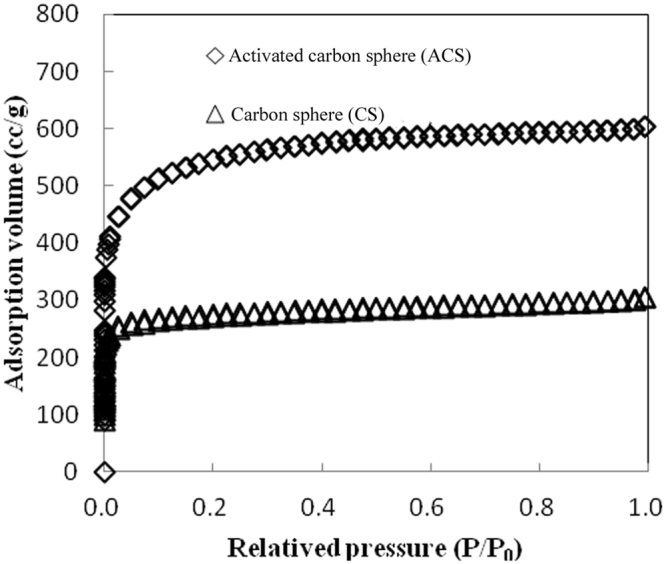
N2 adsorption isotherms at 77 K for CSs and KOH ACSs formed via microwave heating.
Table 2.
Characterization of carbon spheres and activated carbon spheres formed at a carbonization temperature of 270 °C, a carbonization time of 7 h, and a concentration of 0.06 g/ml.
| Index | Carbon spheres | Activated carbon spheres |
|---|---|---|
| Surface area (m2/g) | 384 | 1240 |
| Micropore surface area (m2/g) | 332 | 988 |
| Micropore volume (cc/g) | 0.066 | 0.503 |
| Total pore volume (cc/g) | 0.091 | 0.621 |
Figure 5 illustrates the pore size distributions of CSs and KOH activated carbon spheres (ACSs) formed via microwave heating. The sharpest peak in the distributions occurred at pore diameters of 5 Å to 10 Å, which indicates that the majority of the pores fell within the micropore range. Carbon spheres activated by treatment with KOH and microwave heating may develop micropores (pore size < 2 nm) that enhance the adsorptive capacity for small molecules such as those of gases, according to the theory of the volume filling of micropores32.
Figure 5.
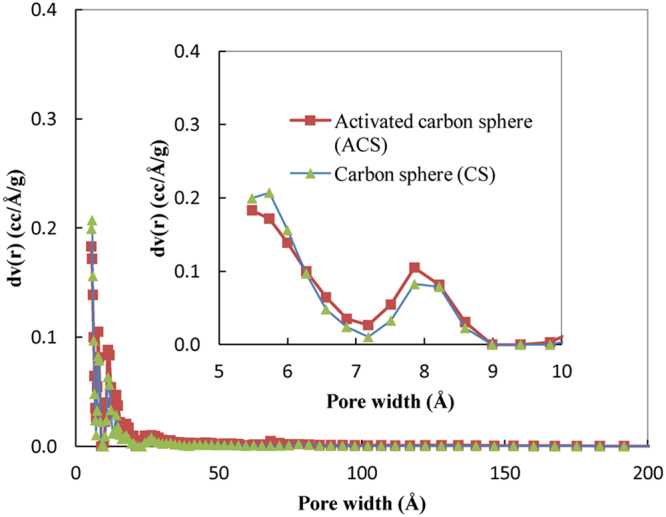
Pore size distribution of CSs and KOH ACSs formed via microwave heating.
The porosity and specific surface area of carbon spheres was characterized by N2 adsorption and desorption measurements at −196 °C. Table 3 summarizes the results obtained for carbon spheres formed at a carbonization temperature of 270 °C, a carbonization time of 7 h, and a concentration of 0.06 g ml−1. As expected, the HTC product showed a very low N2 adsorption capacity and a small BET surface area of 384 m2 g−1 as a result of pyrolysis at 270 °C. This BET surface area is comparable to that of carbon spheres derived from hemp stem hemicellulose at 600 °C (248 m2 g−1)33. After microwave heating, the BET surface area of ACSs increased from 248 m2 g−1 to 1278 m2 g−1, which occurred more efficiently (10 min) than the increase to 1276 m2 g−1 for hemicellulose-based ACSs with a KOH/ratio of 1.0 at 800 °C for 3.5 h34.
Table 3.
Characteristic peaks of EHL and their assignments.
| Wave number/cm−1 | Characteristic peaks of functional groups and their assignments |
|---|---|
| 1700 | Non-conjugated carbonyl |
| 1650–1655 | Conjugated carbonyl |
| 1600–1605, 1505–1515 | Vibration of aromatic skeleton |
| 1460–1470 | C-H deformation vibration of methyl or methylene |
| 1424 | C-H plane deformation vibration on aromatic nucleus |
| 1328 | Syringyl |
| 1266–1270 | Guaiaretic nuclear methoxy C-O vibration |
| 1220–1230 | C-O vibration of the aromatic nucleus related to syringyl |
| 1167 | C-O-C stretching vibration in ester bond |
| 1125–1130 | Aromatic nucleus C-H vibration |
| 1120 | In-plane bending vibration of syringyl ring C-H |
| 1030–1036 | In-plane deformation vibration of aromatic C-H |
| 833–835 | Out-of-plane bending vibration of aromatic nucleus C-H |
FTIR analysis results
Figure 6 is an infrared spectrogram of the HTC products extracted from EHL at 270 °C for a reaction time of 7 h at a concentration of 0.06 g ml−1. In Fig. 6, Curve A corresponds to EHL before carbonization and Curve B corresponds to the product of HTC. Curve A shows a wide and strong peak at 3147 cm−1, which is the stretching vibration peak of the O-H bond, and the peak at 2925 cm−1 is the stretching vibration peak of C-H. The characteristic absorption of functional groups of EHL is mainly concentrated in the 800–1800 cm−1 range, where the peak at 1662 cm−1 is the deformation vibration peak of C6H5-C=O and that at 1606 cm−1 is the stretching vibration of the phenyl ring skeleton C=C; a strong stretching vibration peak of C=O occurs at 1450 cm−1, and the peak at 1000–1440 cm−1 corresponds to the stretching vibration peak of C-O bonds from the saccharide rings25,35.
Figure 6.
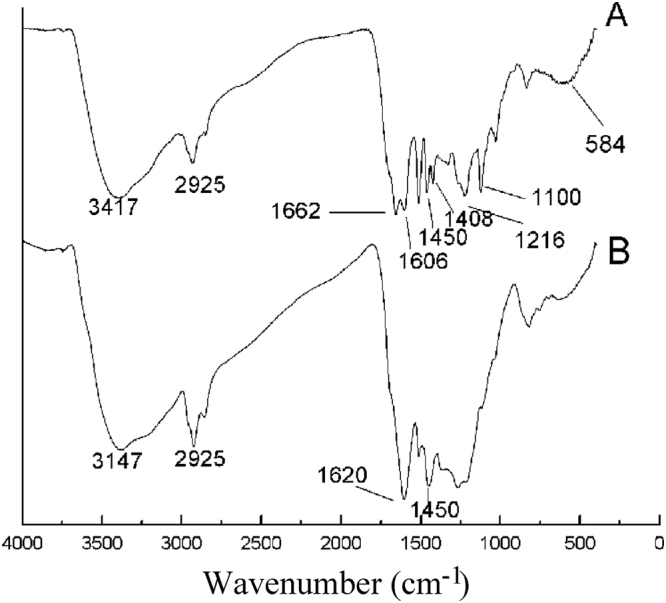
Infrared spectra of carbon spheres prepared by hydrothermal carbonization at a carbonization temperature of 270 °C, (a) carbonization time of 7 h, and a concentration of 0.06 g ml−1 (A is the infrared spectrogram of EHL; B is the infrared spectrogram of CS).
Curve B suggests the presents of a large number of oxygen-containing functional groups (C=O and O-H) on the surface of the CSs. The peaks at 1620 cm−1 and 875–750 cm−1 correspond to the mixed stretching vibrations of C=O in conjugation with a C=C network in carbonaceous materials and out-of-plane C-H vibrations, respectively, which indicate the presence of aromatic nuclei on the CSs36. This result is coincident with a previous work by Smith and Chugtai36. Moreover, the presences of an aliphatic structure can be deduced from the stretching vibration peak of C-H at 2925 cm−1. Compared with Curve A for the raw material, in Curve B, the peak intensities at 1100 cm−1 and 3000–3700 cm−1 decrease, indicating the dehydration of EHL. Therefore, a comparison of Curves A and B shows that dehydration and aromatization occurred during the HTC of EHL, and many oxygen-containing functional groups such as C=O and C-O were present on the surface of the synthesized CSs37,38.
Conclusion
The results of this study show that enzymatic hydrolysis lignins are potential precursors for the HTC preparation of high-quality activated carbon spheres. Microwave heating and KOH impregnation introduced pores into the activated carbon materials after a short heating period.
The prepared samples and materials were characterized according to different properties of the synthesized CSs, and the main conclusions are as follows: The results showed that when the reaction temperature was below 230 °C, spherical structures did not appear. When the temperature was above 230 °C, with the increase in temperature, the spherical structures became more uniform and showed better dispersion. Therefore, the reaction temperature mainly affects the morphology and dispersion of CSs. Within a certain range, a longer reaction time resulted in larger particle size of the CSs. At a reaction time was 7 h, the CSs reached their maximum particle size, i.e., 3–6 μm. Therefore, the reaction time is significantly affects the morphology and size of CSs. Hence, the optimized carbonization conditions are a temperature of 270 °C, a reaction time of 7 h and a concentration of 0.06 g ml−1. In addition, under the condition it can form the separate and uniform dimensions/shapes (3–6 μm). KOH activation and microwave heating were able to yield activated carbon spheres with favorable microporosity and adsorption properties with a BET surface area of 1278 m2 g−1. The surface area, micropore volume, mesopore volume, and surface oxygen content all increased after activation. Hemicellulose-derived carbon spheres exhibit excellent adsorption performance due to their abundant micropores and oxygen functionalities.
Materials and Methods
Materials
Raw EHL was obtained from Nanjing Chemical Reagent Co., Ltd. A 3% sodium hydroxide solution was obtained by mixing sodium hydroxide powder (Nanjing Chemical Reagent Co., Ltd) and distilled water according to the mass ratio, and a 2% dilute sulfuric acid solution (Nanjing Chemical Reagent Co., Ltd) was obtained by mixing 98% sulfuric acid (Nanjing Chemical Reagent Co., Ltd) and distilled water according to the volume ratio. All measurement instruments in this experiment were used at room temperature, with the temperature of the magnetic heated stirrer held at approximately 80 °C, and the temperature of the constant-temperature drying oven held at 60 °C to prevent the formation of mildew caused by the water content in the purified EHL; moreover, the temperature of the high-temperature box-type electric furnace was set to range from 190 to 270 °C.
Extraction of EHL
In this study, EHL was extracted by the alkaline aqueous solution extraction method in which 100 g of unpurified EHL powder was weighed, placed in a 3 L conical flask, and combined with 1 kg of a 3% sodium hydroxide solution (sodium hydroxide powder mixed with distilled water according to the mass ratio). Then, a glass rod was used to stir the mixture and ensure that the powder was fully dissolved. The sample was left on a magnetic heated stirrer to react for 1 h at 65 °C. Then, the impurities were removed by vacuum filtration while the solution was still warm. The filtrate was poured into a beaker, and a 2% dilute sulfuric acid solution (98% sulfuric acid mixed with distilled water according to the volume ratio) was added. The filtrate was stirred while the dilute sulfuric acid solution was being added to adjust the pH value to 3. The solution was kept in a water bath for heat insulation and agglutination at 70 °C for 30 min. When granular lignin floated to the top of the solution, the lignin was sunk by stirring, and the solution was left to stand overnight. The upper clear layer of the solution was removed; the lower layer containing the target substance was separated using a centrifuge and then washed 4 times. The obtained EHL was placed in a constant-temperature drying oven at 60 °C. After the water content had largely evaporated, the sample was again transferred into the vacuum drying oven to fully evaporate the water.
Synthesis, yield and elemental analysis of EHL-based carbon spheres
Two grams of the extracted EHL was weighed for use as a raw material, and it was placed in 50 ml of deionized water. Then, the solution was placed on a magnetic heated stirrer and stirred for 30 min to evenly disperse the EHL. The sample was then transferred to a 20 ml hydrothermal reactor lined with polytetrafluoroethylene at a filling rate of 50%. The sealed hydrothermal reactor was placed in a muffle furnace, and the temperature was set to 220, 230, 250, 270 or 280 °C for reaction times of 3, 5, or 7 h. The solution was naturally cooled to room temperature in the muffle furnace. The substances in the lower layer of the hydrothermal reactor were separated into a centrifuge tube, and a suitable amount of anhydrous ethanol was added. Then, the centrifuge tube was placed in a centrifuge and spun for 5 min before being removed. The carbonized product was dried and deemed ready for use.
The yields of the recovered solid products, referred to as CSs, were calculated using the following equation:
| 1 |
where CS is the yield of carbon spheres (wt%); W2 is the weight of the initial amount of the extracted EHL (g); and W1 is the amount of solid recovered.
| 2 |
Here, CS is the yield of carbon spheres (wt%); W2 is the weight of the initial amount of the extracted EHL (g); and W1 is the amount of ACSs.
The bulk composition of the raw and activated carbon materials was analyzed for carbon, hydrogen, nitrogen and sulfur using a CHNS Elemental Analyzer (Elementar Analysensysteme, Vario MICRO).
Microwave activation of the carbon spheres
KOH chemical activation was employed to develop micropores in the EHL-derived carbon spheres. The carbon spheres produced were impregnated with KOH at a KOH/char ratio of 1.0. The mixtures were stirred for 2 h, dried at 110 ± 5 °C overnight and stored in a desiccator.
For microwave activation, 30 g of KOH-impregnated char was added to a ceramic crucible in a cylindrical quartz reactor. The crucible was then placed in a 2450 MHz microwave applicator (Goldstar Co., Ltd.) with a nominal power output of 700 W and irradiated for 10 min under a 0.5 L/min flow of N2 humidified by bubbling through water28.
Characterization of the carbon spheres
The samples were observed in a high-vacuum environment using a Model Quanta 200 scanning electron microscope manufactured by the U.S.-based FEI Company. Carbon spheres were dispersed in an anhydrous ethanol solution to prevent aggregation or crosslinking of the CSs in the solution. After ultrasonic oscillation for 15 min, the upper turbid anhydrous ethanol solution containing the sample was siphoned, dripped onto a clean glass slide and dried naturally. Care was taken to prevent dust from interfering with the drying process. To avoid interference with the electron beam caused by repulsive forces due to charge accumulation on the sample surface, the sample surface was sprayed with metal using an ion-sputtering apparatus before observation. During observation, an electron spectrometer was used to characterize the chemical elements contained in the sample.
The Brunauer-Emmett-Teller (BET) surface areas of the activated carbon samples were measured using N2 adsorption isotherms at 77 K with an automated gas sorption analyzer (Autosorb iQ2 MP, Quantachrome Instruments). The multipoint BET equations were used to calculate the BET surface areas using adsorption data recorded over the relative pressure range of 0.01 to 0.07. The total pore volume was derived from the amount of N2 adsorbed at a relative pressure of 0.9939, assuming that all of the pores were filled with liquid N2. Micropore volumes and surface areas were determined using the t-plot method.
The infrared spectral analyzer used in this study was a VERTEX-80v Fourier Transform Infrared Spectrometer. After the test sample was pressed into a KBr pellet, the infrared spectrum of the CSs was measured. The scanning range was 500–4000 cm−1.
Acknowledgements
This work was funded by the Natural Science Foundation of China (31500483). The authors acknowledge the support of the China Postdoctoral Science Foundation (2017M611826), the China Scholarship Council (201608320141), the Jiangsu Province Postdoctoral Science Foundation (1701016B), the Jiangsu Province Innovative and Entrepreneurial Talent Program (2017), the Jiangsu Province Science Foundation for Youths (BK20150876) and the Priority Academic Program Development of Jiangsu Higher Education Institutions.
Author Contributions
All authors contributed to the current work. M.H.Y. and Z.X.Y. conceived and designed the experiments; C.X.W. and H.R.Z. performed the experiments; C.M.Z., Y.R. and L.P. analyzed the data; Z.M.J., Z.F. and Y.Y. contributed the reagents/materials/analysis tools; and M.H.Y. wrote the paper.
Competing Interests
The authors declare no competing interests.
Footnotes
Publisher's note: Springer Nature remains neutral with regard to jurisdictional claims in published maps and institutional affiliations.
Contributor Information
Haiyan Mao, Email: maohaiyan@njfu.edu.cn.
Xiaoyan Zhou, Email: zhouxiaoyan2628@163.com.
References
- 1.Steel KM, Koros WJ. Investigation of porosity of carbon materials and related effects on gas separation properties. Carbon. 2003;41:253–266. doi: 10.1016/S0008-6223(02)00309-3. [DOI] [Google Scholar]
- 2.Wang HT, Holmberg BA, Yan YS. Synthesis of template-free zeolite nanocrystals by using in situ thermoreversible polymer Hydrogels. J. Am. Chem. Soc. 2003;125:9928–9929. doi: 10.1021/ja036071q. [DOI] [PubMed] [Google Scholar]
- 3.Xia YN, Gates B, Yin YD, Lu Y. Monodispersed colloidal spheres: Old materials with new applications. Adv. Mater. 2000;12:693–713. doi: 10.1002/(SICI)1521-4095(200005)12:10<693::AID-ADMA693>3.0.CO;2-J. [DOI] [Google Scholar]
- 4.Caruso F. Hollow inorganic capsules via colloid-templated layer-by-layer electrostatic assembly. Top. Curr. Chem. 2003;227:145–168. doi: 10.1007/3-540-36412-9_6. [DOI] [Google Scholar]
- 5.Stevens MG, Chen D, Foley HC. Oxidized caesium/nanoporous carbon materials: solid-base catalysts with highly-dispersed active sites. Chem. Commun. 1999;0:275–276. doi: 10.1039/a808249i. [DOI] [Google Scholar]
- 6.Rajagopalan R, et al. Molecular sieving platinum nanoparticle catalysts kinetically frozen in nanoporous carbon. Chem. Commun. 2004;21:2498–2499. doi: 10.1039/b407854c. [DOI] [PubMed] [Google Scholar]
- 7.Endo M, Kim C, Nishimura K, Fujimo T, Miyashita K. Recent development of carbon materials for Li ion batteries. Carbon. 2000;38:183–197. doi: 10.1016/S0008-6223(99)00141-4. [DOI] [Google Scholar]
- 8.Wang Q, Li H, Chen LQ, Huang XJ. Novel spherical microporous carbon as anode material for Li-ion batteries. Solid State Ionics. 2002;152:43–50. doi: 10.1016/S0167-2738(02)00687-2. [DOI] [Google Scholar]
- 9.Chen C, et al. Three-dimensional scaffolding framework of porous carbon nanosheets derived from plant wastes for high-performance supercapacitors. Nano. Energy. 2016;27:377–389. doi: 10.1016/j.nanoen.2016.07.020. [DOI] [Google Scholar]
- 10.Li Z, et al. Carbonized Chicken Eggshell Membranes with 3D Architectures as High-Performance Electrode Materials for Supercapacitors. Adv. Energy Mater. 2012;2:431–437. doi: 10.1002/aenm.201100548. [DOI] [Google Scholar]
- 11.Gao X, et al. Superior capacitive performance of active carbons derived from Enteromorpha prolifera. Electrochim. Acta. 2014;133:459–466. doi: 10.1016/j.electacta.2014.04.101. [DOI] [Google Scholar]
- 12.Li Z, et al. Mesoporous nitrogen-rich carbons derived from protein for ultra-high capacity battery anodes and supercapacitors. Energy Environ. Sci. 2013;6:871–878. doi: 10.1039/c2ee23599d. [DOI] [Google Scholar]
- 13.Rybarczyk MK, et al. Porous carbon derived from rice husks as sustainable bioresources: insights into the role of micro-/mesoporous hierarchy in hosting active species for lithium–sulphur batteries. Green Chem. 2016;18:5169–5179. doi: 10.1039/C6GC00612D. [DOI] [Google Scholar]
- 14.Liu WJ, Jiang H, Yu HQ. Porous carbon derived from rice husks as sustainable bioresources: insights into the role of micro-/mesoporous hierarchy in hosting active species for lithium–sulphur batteries. Green Chem. 2015;17:4888–4907. doi: 10.1039/C5GC01054C. [DOI] [Google Scholar]
- 15.Sen S, Patil S, Argyropoulos DS. Thermal properties of lignin in copolymers, blends, and composites: a review. Green Chem. 2015;17:4862–4887. doi: 10.1039/C5GC01066G. [DOI] [Google Scholar]
- 16.Navarro-Suárez AM, et al. Nanoporous carbons from natural lignin: study of structural–textural properties and application to organic-based supercapacitors. RSC Adv. 2014;4:48336–48343. doi: 10.1039/C4RA08218D. [DOI] [Google Scholar]
- 17.Zhang W, et al. 3D Hierarchical Porous Carbon for Supercapacitors Prepared from Lignin through a Facile Template-Free Method. Chem. Sus. Chem. 2015;8:2114–2122. doi: 10.1002/cssc.201403486. [DOI] [PubMed] [Google Scholar]
- 18.Saha D, et al. Studies on supercapacitor electrode material from activated lignin-derived mesoporous carbon. Langmuir. 2014;30:900–910. doi: 10.1021/la404112m. [DOI] [PubMed] [Google Scholar]
- 19.Hu S, Hsieh YL. Ultrafine microporous and mesoporous activated carbon fibers from alkali lignin. Mater. Chem. A. 2013;1:11279–11288. doi: 10.1039/c3ta12538f. [DOI] [Google Scholar]
- 20.Hu S, Zhang S, Pan N, Hsieh YL. High energy density supercapacitors from lignin derived submicron activated carbon fibers in aqueous electrolytes. J. Power Sources. 2014;270:106–112. doi: 10.1016/j.jpowsour.2014.07.063. [DOI] [Google Scholar]
- 21.Mikova MN, Chesnokov V, Kuznetsov BN. Study of high porous carbon prepared by the alkaline actvation of anthacites. Journal of Siberian Federal University Chemistry I. 2009;2009:3–9. [Google Scholar]
- 22.Hu B, Yu SH, Wang K, Liu L, Xu XW. Functional carbonaceous materials from hydrothermal carbonization of biomass: an effective chemical process. Dalton Trans. 2008;2008:5414–5423. doi: 10.1039/b804644c. [DOI] [PubMed] [Google Scholar]
- 23.Orikasa H, Karoji J, Matsui K, Kyotani T. Crystal formation and growth during the hydrothermal synthesis of β-Ni(OH)2 in one-dimensional nano space. Dalton Trans. 2007;2007:3757–3762. doi: 10.1039/b707966d. [DOI] [PubMed] [Google Scholar]
- 24.Sevilla M, Fuertes A. The production of carbon materials by hydrothermal carbonization of cellulose. Carbon. 2009;49:2281–2289. doi: 10.1016/j.carbon.2009.04.026. [DOI] [Google Scholar]
- 25.Mi YZ, Hu WB, Dan YM, Liu YL. Synthesis of carbon micro-spheres by a glucose hydrothermal method. Mater. Lett. 2008;62:1194–1196. doi: 10.1016/j.matlet.2007.08.011. [DOI] [Google Scholar]
- 26.Simsir H, Eltugral N, Karagoz S. Hydrothermal carbonization for the preparation of hydrochars from glucose, cellulose, chitin, chitosan and wood chips via low-temperature and their characterization. Bioresour. Technol. 2017;246:82–87. doi: 10.1016/j.biortech.2017.07.018. [DOI] [PubMed] [Google Scholar]
- 27.Sevilla M, Fuertes AB. Chemical and structural properties of carbonaceous products obtained by hydrothermal carbonization of saccharides. Chem. Eur. J. 2009;15:4195–4203. doi: 10.1002/chem.200802097. [DOI] [PubMed] [Google Scholar]
- 28.Mao HY, et al. Adsorption of toluene and acetone vapors on microwave-prepared activated carbon from agricultural residues: isotherms, kinetics, and thermodynamics studies. Research on Chemical Intermediates. 2016;42:3359–3371. doi: 10.1007/s11164-015-2217-9. [DOI] [Google Scholar]
- 29.Zhao, Y. Preparation and structure control of nano-microsize carbon spheres via catalytic hydrothermal carbonization from cellulose. PhD thesis, Northeast Forestry University, 2013.
- 30.Deshmukh AA, Mhlanga SD, Coville NJ. Carbon spheres. Materials Science and Engineering R. 2010;70:1–28. doi: 10.1016/j.mser.2010.06.017. [DOI] [Google Scholar]
- 31.Mao HY, et al. Constant Power and Constant Temperature Microwave Regeneration of Toluene and Acetone loaded on Microporous Activated Carbon from Agricultural Residue. Journal of Industrial and Engineering Chemistry. 2015;21:516–525. doi: 10.1016/j.jiec.2014.03.014. [DOI] [Google Scholar]
- 32.Mao HY, et al. Microporous activated carbon from pinewood and wheat straw by microwave-assisted KOH treatment for toluene and acetone vapors adsorption. RSC Adv. 2015;5:36051–36058. doi: 10.1039/C5RA01320H. [DOI] [Google Scholar]
- 33.Wang Y, Yang R, Li M, Zhao ZJ. Hydrothermal preparation of highly porous carbon spheres from hemp (Cannabis sativa L.) stem hemicellulose for use in energy-related applications. Industrial Crops and Products. 2015;25:216–226. doi: 10.1016/j.indcrop.2014.12.008. [DOI] [Google Scholar]
- 34.Wei J, Chu Y, Jiang GM, Yang JZ, Sun DP. Preparation of carbon microspheres via hydrothermal carbonization. Functional Materials. 2014;45:133–134. [Google Scholar]
- 35.Shen Y, Lin Y, Li M, Nan CW. High dielectric performance of polymer composite films induced by a percolating interparticle barrier layer. Adv. Mater. 2007;19:1418–1422. doi: 10.1002/adma.200602097. [DOI] [Google Scholar]
- 36.Smith DM, Chughtai AR. The surface structure and reactivity of black carbon. Colloids and Surfaces A: Physicochemical and Engineering Aspects. 1995;105:47–77. doi: 10.1016/0927-7757(95)03337-1. [DOI] [Google Scholar]
- 37.Makowski P, Cakan RD, Antonieitti M, Goettmann F, Titirici MM. Selective partial hydrogenation of hydroxy aromatic derivatives with palladium nanoparticles supported on hydrophilic carbon. Chem. Commun. 2008;8:999–1001. doi: 10.1039/b717928f. [DOI] [PubMed] [Google Scholar]
- 38.Yang R, et al. Effect of hydrophobic modification on mechanical properties of Chinese fir wood. BioRes. 2018;13:2035–2048. [Google Scholar]
- 39.Gregg, S. J. & Sing, S. K. W. Adsorption, surface area and porosity; Publisher: Academic Press (New York, 1982).


