

Abstract
Background
Type 2 diabetes mellitus is a major risk factor for cardiovascular disease; however, outcomes in individual patients vary. Soluble urokinase plasminogen activator receptor (suPAR) is a bone marrow–derived signaling molecule associated with adverse cardiovascular and renal outcomes in many populations. We characterized the determinants of suPAR in African Americans with type 2 diabetes mellitus and assessed whether levels were useful for predicting mortality beyond clinical characteristics, coronary artery calcium (CAC), and high‐sensitivity C‐reactive protein (hs‐CRP).
Methods and Results
We measured plasma suPAR levels in 500 African Americans with type 2 diabetes mellitus enrolled in the African American‐Diabetes Heart Study. We used Kaplan‐Meier curves and Cox proportional hazards models adjusting for clinical characteristics, CAC, and hs‐CRP to examine the association between suPAR and all‐cause mortality. Last, we report the change in C‐statistics comparing the additive values of suPAR, hs‐CRP, and CAC to clinical models for prediction of mortality. The suPAR levels were independently associated with female sex, smoking, insulin use, decreased kidney function, albuminuria, and CAC. After a median 6.8‐year follow‐up, a total of 68 deaths (13.6%) were recorded. In a model incorporating suPAR, CAC, and hs‐CRP, only suPAR was significantly associated with mortality (hazard ratio 2.66, 95% confidence interval 1.63‐4.34). Addition of suPAR to a baseline clinical model significantly improved the C‐statistic for all‐cause death (Δ0.05, 95% confidence interval 0.01‐0.10), whereas addition of CAC or hs‐CRP did not.
Conclusions
In African Americans with type 2 diabetes mellitus, suPAR was strongly associated with mortality and improved risk discrimination metrics beyond traditional risk factors, CAC and hs‐CRP. Studies addressing the clinical usefulness of measuring suPAR concentrations are warranted.
Keywords: biomarker, calcium score, soluble urokinase plasminogen activator receptor, urokinase
Subject Categories: Biomarkers, Inflammation
Clinical Perspective
What Is New?
This study compared soluble urokinase plasminogen activator receptor (suPAR) to C‐reactive protein and coronary artery calcium in predicting death in African Americans with type 2 diabetes mellitus.
Patients with type 2 diabetes mellitus on insulin therapy had significantly higher suPAR levels compared to those not using insulin.
SuPAR levels were strongly associated with all‐cause death above and beyond traditional risk factors as well as C‐reactive protein and coronary artery calcium.
What Are the Clinical Implications?
SuPAR levels may be a surrogate marker for the underlying inflammatory state associated with insulin resistance.
As a biomarker of risk for kidney disease and all‐cause death, suPAR levels may be useful in patients with type 2 diabetes mellitus for risk stratification, initiation of preventive therapy such as statins, renin‐angiotensin inhibitors, or treatment decisions such as in coronary artery bypass grafting versus percutaneous coronary intervention in patients with multivessel disease.
Introduction
Type 2 diabetes mellitus (T2D) is a major risk factor for cardiovascular and kidney disease. It is estimated to affect more than 350 million adults worldwide, and its incidence continues to increase.1 Guidelines for the assessment and management of cardiovascular risk consider a diagnosis of T2D equivalent to coronary artery disease (CAD).2, 3 However, outcomes are heterogeneous, with several recent studies suggesting that the risk of CAD in T2D is less than that in patients with preexisting CAD and that the overall incidence of CAD in patients with diabetes mellitus may be lower than previously reported.4, 5 Both high‐sensitivity C‐reactive protein (hs‐CRP) and cardiac imaging, specifically coronary artery calcium (CAC), have been proposed as tools to improve risk stratification in patients with T2D, perhaps allowing for the identification of a subgroup for which statin therapy could be deferred; however, their prognostic and clinical utility have been questioned.6, 7, 8
Soluble urokinase plasminogen activator receptor (suPAR) is a marker of immune activation thought to be involved in the pathogenesis of kidney disease; suPAR concentrations have also been associated with mortality and cardiovascular disease in the general population (without comorbidities), in critically ill patients, patients with cerebrovascular disease, HIV infection, and kidney disease.9, 10, 11, 12, 13, 14, 15, 16, 17, 18, 19, 20, 21 In contrast to hs‐CRP, elevated suPAR is reportedly associated with the presence of CAC as well as peripheral arterial disease.22, 23 Whether suPAR levels provide further benefit in risk stratification in African Americans (AA) with T2D has not been studied. We sought to characterize determinants of suPAR levels in patients with T2D and to ascertain whether suPAR is a predictor of CAC and whether its levels are useful for predicting mortality beyond conventional clinical characteristics, CAC, and hs‐CRP.
Methods
Study Design and Population
We measured plasma suPAR levels in 500 self‐reported adult AAs with T2D from the AA‐DHS (African American‐Diabetes Heart Study). As reported, recruitment came from medical clinics and community advertising.24, 25 Participants underwent physical examinations and were interviewed to collect demographic characteristics, medical history, medication use, and behavioral habits in the Wake Forest School of Medicine Clinical Research Unit.25 Fasting blood and urine samples were collected at enrollment. Participants with a known serum creatinine concentration ≥2 mg/dL or physician‐diagnosed kidney disease were excluded. T2D was defined as a diagnosis after the age of 30 years and receiving blood sugar–lowering medications in the absence of diabetic ketoacidosis or insulin‐only treatment since diagnosis.
The Chronic Kidney Disease Epidemiology Collaboration equation was used to compute estimated glomerular filtration rate (eGFR).26 All‐cause death was determined by querying the National Death Index, which is an annually updated database maintained by the Centers for Disease Control's National Center for Health Statistics that contains demographic and vital status data for deaths occurring after 1978.27 The study was approved by the Wake Forest School of Medicine Institutional Review Board (Winston‐Salem, NC). All subjects provided written informed consent at the time of enrollment. The data, analytic methods, and study materials can be made available to other researchers for purposes of reproducing the results or replicating the procedure on request.
Sample Collection and Measurement of suPAR and hs‐CRP
Fasting venous blood was collected and stored at −80°C (never thawed) for a mean duration of 4.9 years before assay. Plasma levels of suPAR were measured using human uPAR Quantikine ELISA kits (R&D Systems, Minneapolis, MN) according to the manufacturer's instruction. The minimum detectable suPAR concentration is 33 pg/mL. The intra‐assay coefficients of variation for low (mean 836 pg/mL), medium (1593 pg/mL), and high (2412 pg/mL) suPAR levels were 2.1%, 4.1%, and 7.5%, respectively. Human serum hs‐CRP was measured by the Hypertension Core Lab, Wake Forest University Health Sciences, using high‐sensitivity Enzyme Immuno Assay (ALPCo, Salem, NH), a sandwich assay for determination of CRP in serum, plasma, and urine.
Arterial Calcium Scoring
As reported, participants were placed in the supine position on the computed tomography couch over a calibration phantom with verified concentrations of calcium hydroxyl apatite (Image Analysis, Inc, Columbia, KY) for scans of the thorax and abdomen.28 Coronary imaging was performed without intravenous contrast and with electrocardiographic gating in late diastole (75% of the RR interval). Series through the neck for the carotid bifurcation and abdomen for the aortoiliac arteries were performed without electrocardiographic gating using helical scan mode. Computed tomography scans of the coronary, carotid, and aortoiliac vascular territories were analyzed on a GE Advantage Windows Workstation with the SmartScores software package (GE Healthcare, Waukesha, WI) using a modified Agatston scoring method that adjusts for slice thickness and uses the conventional threshold of 130 Hounsfield units as well as a calcium mass score using a 90 Hounsfield unit threshold. The calcium mass score was employed to have a more stable measure of calcified plaque across the 3 vascular beds. The coronary calcium mass score was the sum of calcium plaque score in epicardial coronary arteries (left main, anterior descending, circumflex, right, and posterior descending). The carotid calcium plaque mass score was the sum of plaque in the common and internal carotid arteries. The aortoiliac calcium plaque mass was the sum of calcium plaque present in the abdominal aorta below the renal arteries and in the right and left common iliac arteries. Arterial segments identified as having stents were defined as artifacts and excluded from quantification, as was CAC in participants who had undergone coronary artery bypass grafting and carotid artery calcium in those who underwent carotid endarterectomy.
Statistical Analysis
We reported subject characteristics as descriptive statistics with means, medians, standard deviations, and ranges. Between‐group differences were assessed using the t test for continuous variables, and chi‐squared or Fischer exact tests for categorical variables where appropriate. For nonnormally distributed variables such as suPAR, hs‐CRP, and CAC levels, the Mann‐Whitney U test was used to compare groups in unadjusted analyses. We correlated baseline suPAR levels with enrollment CAC levels (n=500) and a subset of 271 patients with 5‐year follow‐up using the Spearman‐Rank test.
We used principal component analysis to derive an estimate of the total burden of calcified atherosclerotic plaque using a linear combination of coronary, carotid, and aortic calcium plaque scores. Each calcium plaque score was standardized by subtracting its median and dividing the observed difference by the square of the interquartile range. The correlation matrix used in the principal component analysis was computed using the standardized scores to account for the differences in measurement scales among the 3 variables. The first principal component explained 83% of the total variation observed in the aforementioned 3 vascular beds and was computed as principal component1=0.19×aorta+0.95×carotid+0.25×CAC.
We used multivariable linear regression adjusting for age, sex, body mass index, smoking history, hypertension, eGFR, urine albumin‐creatinine ratio, statin use, high‐ and low‐density lipoprotein levels, hemoglobin A1C, insulin treatment, duration of T2D, hs‐CRP levels, and CAC to identify measures and characteristics independently associated with suPAR levels expressed as per 100% increase in suPAR after base‐2 log‐transformation. We examined the association between suPAR and all‐cause mortality using Cox regression analyses adjusting for the aforementioned variables in a stepwise fashion, with model 1 incorporating clinical characteristics and hs‐CRP, followed by model 2 in which suPAR was added, and, last, model 3 incorporating CAC. Interaction and subgroup analyses were performed to explore whether the association between suPAR and outcomes differed according to the presence or absence of CAC and whether patients were on insulin therapy. Finally, we examined the incremental value of adding suPAR, CAC, or hs‐CRP levels to clinical models for predicting all‐cause mortality. C‐statistics, continuous net reclassification improvement, and integrated discrimination improvement were calculated to evaluate the improvement in predictive ability of the models with and without biomarkers, using the R packages survC1 and survIDINRI.29, 30
Two‐tailed P≤0.05 was considered statistically significant. Analyses were performed using IBM SPSS Statistics Version 24 (Armonk, NY), SAS 9.4 (SAS Institute, Cary, NC), and R 3.2.2 (R Core Team, Vienna, Austria).
Results
The suPAR and Clinical Characteristics in African Americans With T2D
Table 1 displays characteristics of the 500 AA‐DHS participants stratified by suPAR tertiles. Participants with higher suPAR levels were more likely to be female, smokers, have hypertension, history of CAD, lower eGFR, and elevated urine albumin‐creatinine ratio. Although mean hemoglobin A1c, fasting glucose levels, and age at diabetes diagnosis were similar among groups, participants in the highest suPAR tertile were significantly more likely to be on insulin therapy (52% versus 31% for the lowest tertile). Notably, suPAR levels were higher in participants on insulin therapy regardless of glycemic control (Figure 1) and did not correlate with hemoglobin A1c, fasting glucose, or duration of diagnosis of T2D. In multivariable analyses suPAR levels were independently associated with female sex, current smoking, insulin use, lower eGFR, higher urine albumin‐creatinine ratio and higher CAC (Table 2). The percentage of variance in suPAR levels explained by the multivariable model is 21.3%.
Table 1.
Demographic and Clinical Characteristics of the AA‐DHS Cohort, Stratified by suPAR Tertiles
| Variable | Full Sample (n=500) | suPAR Tertiles | |||
|---|---|---|---|---|---|
| suPAR ≤2150 (n=168) | suPAR 2151 to 2866 (n=165) | suPAR >2866 (n=167) | P Valuea | ||
| Age, y | 56 (10) | 54 (9) | 56 (10) | 57 (10) | 0.012 |
| Male, n (%) | 220 (44%) | 91 (54%) | 69 (42%) | 60 (36%) | 0.003 |
| Body mass index, kg/m2 | 36 (9) | 34 (8) | 36 (9) | 36 (9) | 0.085 |
| Current smoker, n (%) | 117 (23%) | 34 (20%) | 33 (20%) | 50 (30%) | 0.050 |
| Hypertension, n (%) | 421 (84%) | 128 (76%) | 146 (88%) | 147 (88%) | 0.002 |
| History of coronary artery disease, n (%) | 156 (31%) | 48 (29%) | 41 (25%) | 67 (40%) | 0.007 |
| Prior stroke, n (%) | 40 (8%) | 9 (5%) | 15 (9%) | 16 (10%) | 0.297 |
| High‐density lipoprotein, mg/dL | 48 (14) | 47 (14) | 49 (13) | 48 (15) | 0.560 |
| Low‐density lipoprotein, mg/dL | 107 (38) | 105 (38) | 108 (35) | 109 (41) | 0.557 |
| Statin therapy, n (%) | 254 (51%) | 83 (49%) | 84 (51%) | 87 (52%) | 0.885 |
| Estimated glomerular filtration rate, mL/min per 1.73 m2 | 91 (22) | 97 (19) | 93 (21) | 83 (24) | <0.001 |
| Urine albumin‐creatinine ratio, mg/g | 145 (537) | 46 (109) | 115 (403) | 275 (816) | <0.001 |
| Hemoglobin A1c, % | 8.1 (2.0) | 7.9 (1.7) | 8.2 (2.0) | 8.3 (2.2) | 0.147 |
| Fasting glucose, mg/dL | 151 (67) | 147 (68) | 150 (58) | 156 (7) | 0.417 |
| Insulin treatment, n (%) | 201 (40%) | 52 (31%) | 62 (38%) | 87 (52%) | <0.001 |
| Age at diabetes mellitus diagnosis, years | 46 (10) | 45 (9) | 47 (10) | 45 (10) | 0.061 |
| Coronary artery calcium score (CAC) | 53 [2, 690] | 19 [0, 255] | 60 [3, 505] | 157 [3, 1656] | <0.001 |
| CAC of 0, n (%) | 109 (22%) | 51 (30%) | 28 (17%) | 30 (18%) | 0.003b |
| CAC of 1 to 100, n (%) | 170 (34%) | 54 (32%) | 65 (39%) | 51 (31%) | |
| CAC of 101 to 300, n (%) | 59 (12%) | 22 (13%) | 21 (13%) | 16 (10%) | |
| CAC of >300, n (%) | 162 (32%) | 41 (24%) | 51 (31%) | 70 (42%) | |
| Aortic calcium score | 997 [27, 6350] | 347 [5, 2502] | 1501 [18, 5817] | 2391 [181, 10 857] | <0.001 |
| Carotid artery calcium score | 4 [0, 96] | 0 [0, 43] | 7 [0, 136] | 10 [0, 174] | 0.001 |
| Principal component for aorta, carotid, and coronary calcium scores | −1.89 [−2.15, −0.49] | −2.07 [−2.16, −1.34] | −1.81 [−2.13, −0.29] | −1.62 [−2.12, 1.11] | <0.001 |
| hs‐CRP, mg/dL | 0.5 [0.2, 1.09] | 0.41 [0.18, 0.99] | 0.49 [0.18, 1.27] | 0.64 [0.25, 1.12] | 0.089 |
| suPAR, pg/mL | 2506 [2014, 3195] | 1821 [1604, 2015] | 2506 [2322, 2657] | 3495 [3194, 4118] | <0.001 |
Values are mean (SD), or n (%) as noted. Coronary artery calcium score (CAC), soluble urokinase plasminogen activator receptor (suPAR), and C‐reactive protein (hs‐CRP) are reported as median [25th, 75th percentile]. AA‐DHS indicates African American‐Diabetes Heart Study.
P‐values are derived from ANOVA for normally distributed variables and the Mann‐Whitney U test for nonnormally distributed variable.
P‐value was derived from the Pearson chi‐square test.
Figure 1.
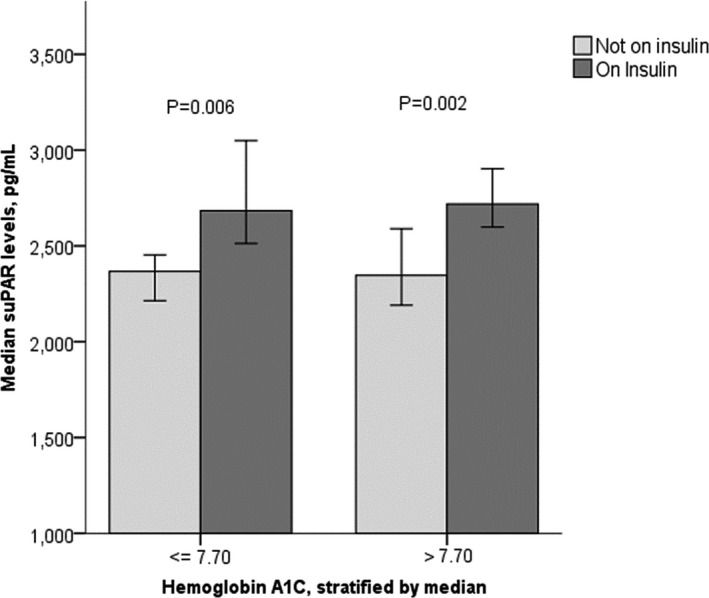
Median soluble urokinase‐type plasminogen activator receptor (suPAR) levels stratified by hemoglobin A1c and insulin treatment. Error bars represent 95% confidence intervals.
Table 2.
Characteristics Associated With suPAR Levels in African Americans With T2D
| Variables | suPAR, Per 100% Increase | |
|---|---|---|
| β, P Value | 95% CI | |
| Age, per 10 years | −0.023, 0.460 | −0.086, 0.039 |
| Male | −0.146, 0.005a | −0.246, −0.045a |
| Body mass index, per 5 kg/m2 | 0.012, 0.414 | −0.017, 0.041 |
| Hypertension | 0.102, 0.123 | −0.028, 0.231 |
| Current smoking | 0.211, <0.001a | 0.099, 0.323a |
| History of coronary artery disease | −0.018, 0.743 | −0.124, 0.089 |
| Statin therapy | −0.123, 0.016a | −0.224, −0.023a |
| HDL, per mg/dL | 0.001, 0.520 | −0.002, 0.005 |
| LDL, per mg/dL | 0.000, 0.731 | −0.002, 0.001 |
| Hemoglobin A1c, per % | −0.003, 0.838 | −0.030, 0.024 |
| Insulin treatment | 0.178, 0.001a | 0.072, 0.285a |
| Duration since diagnosis of T2D, per 1 year | 0.003, 0.358 | −0.004, 0.010 |
| Estimated glomerular filtration rate, per 10 mL/min per 1.73 m2 | −0.068, <0.001a | −0.091, −0.045a |
| Urine albumin‐creatinine ratio, per 10 mg/g | 0.001, 0.024a | 0.000, 0.002a |
| hs‐CRP, per 100% increase (log2) | 0.018, 0.603 | −0.049, 0.085 |
| CAC, per 100 | 0.004, 0.003a | 0.001, 0.007a |
The percentage of variance in suPAR (soluble urokinase plasminogen activator receptor) levels explained by the multivariable model is 21.3%. CAC indicates coronary artery calcium score; CI, confidence interval; HDL, high‐density lipoprotein; LDL, low‐density lipoprotein; T2D, type 2 diabetes mellitus.
Statistically significant.
SuPAR and Calcified Atherosclerotic Plaque
Participants with higher suPAR levels had higher median coronary artery, carotid artery, and infrarenal aorta calcium scores (Table 1). The correlation between suPAR and calcium plaque mass was modest, with correlation with the overall calcified plaque burden (r=0.20, P<0.001), aortic calcification (r=0.22, P<0.001), CAC (r=0.18, P<0.001), and carotid calcification (r=0.15, P=0.001). After adjusting for clinical characteristics including eGFR, urine albumin‐creatinine ratio, and hs‐CRP, suPAR levels remained significantly associated with overall calcified plaque burden (β=0.010, P<0.001), CAC (β=0.004, P=0.006), aortic calcium plaque (β=0.001, P<0.001), but not carotid calcification (β=0.009, P=0.087). When examining the areas under the curve for predicting the presence of arterial calcification (calcium score >0), only age, eGFR, suPAR levels, and current smoking (in order of decreasing areas under the curve) were significantly associated (Table 3). Using the Youden index to identify optimal cutoffs for suPAR yielded a suPAR level of 2595 pg/mL with a sensitivity of 69% and specificity of 61% for CAC >1000, and a sensitivity of 61% and specificity of 52% for CAC <100.
Table 3.
Area Under the Curve for suPAR and Clinical Characteristics Predicting Presence of Arterial Calcification
| Variable | Total Calcium Plaque Score >0 | |
|---|---|---|
| AUC, P Value | 95% CI | |
| Age | 0.747, <0.001 | 0.667, 0.827 |
| Estimated glomerular filtration rate | 0.657, 0.003 | 0.575, 0.739 |
| suPAR | 0.621, 0.021 | 0.523, 0.719 |
| Current smoking | 0.611, 0.034 | 0.527, 0.696 |
| hs‐CRP | 0.584, 0.110 | 0.491, 0.676 |
| Male sex | 0.567, 0.201 | 0.478, 0.655 |
| Body mass index | 0.561, 0.241 | 0.462, 0.661 |
| Insulin therapy | 0.559, 0.257 | 0.46, 0.658 |
| Hypertension | 0.530, 0.565 | 0.424, 0.636 |
| Urine albumin‐creatinine ratio | 0.518, 0.736 | 0.421, 0.614 |
| Hemoglobin A1c | 0.466, 0.511 | 0.359, 0.573 |
| LDL | 0.462, 0.468 | 0.369, 0.555 |
| Body mass index | 0.460, 0.450 | 0.339, 0.582 |
CI indicates confidence interval; hs‐CRP, high‐sensitivity C‐reactive protein; LDL, low‐density lipoprotein; suPAR, soluble urokinase plasminogen activator receptor.
Finally, in the subset of 273 AA‐DHS participants who returned for follow‐up exams and a repeat computed tomography scan after ≈5 years, the median increase in total calcified plaque was 1832 [interquartile range 417‐4930]. Enrollment suPAR levels were significantly correlated with the change in total calcified plaque (r=0.206, P=0.001). Adjusting for age, sex, body mass index, eGFR, smoking, and statin use, baseline suPAR levels remained significantly associated (odds ratio 1.82, 95% confidence interval (CI) [1.08‐3.35]) with an increase in total calcified plaque score >1832 (median) at 5 years.
SuPAR, Coronary Arterial Calcification, and Outcomes in T2D
After a median follow‐up of 6.8 years (range 0.1‐8.3), a total of 68 deaths were recorded: 13 with baseline suPAR ≤2150 pg/mL (first tertile), 20 in the second tertile (2150‐2866 pg/mL), and 35 in the third tertile (>2866 pg/mL). In univariable analysis, participants in the higher tertiles of suPAR had a higher mortality rate (Figure 2). Similarly, when stratifying participants by CAC tertiles, increasing CAC was associated with shorter survival (Figure 2). After adjusting for demographics, clinical characteristics including kidney function, hs‐CRP, and insulin use, suPAR levels (per 100% increase) remained significantly associated with a 2.65‐fold increase in risk of all‐cause mortality (Table 4). This association remained statistically significant even after adjusting for CAC, which was not an independent predictor of outcomes. Duration of T2D since diagnosis did not attenuate the association between suPAR and all‐cause death. Of note, eGFR was no longer a significant predictor of death after adjusting for suPAR levels. In sensitivity analyses we found no significant interaction among suPAR, the presence of coronary calcified plaque, or treatment with insulin therapy in association with all‐cause mortality.
Figure 2.
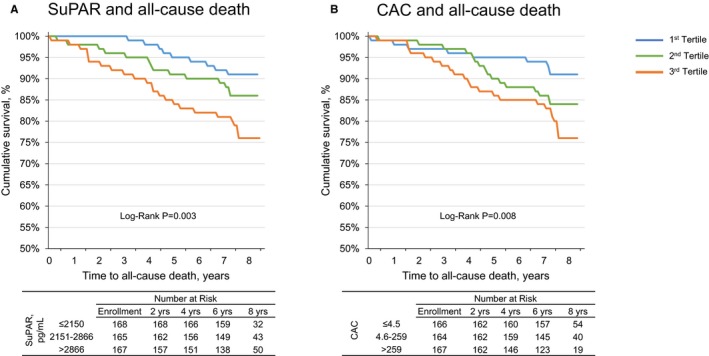
The suPAR concentration, coronary artery calcium score, and all‐cause mortality. Kaplan‐Meier survival curves for (A) soluble urokinase‐type plasminogen activator receptor (suPAR), and (B) coronary artery calcium (CAC), stratified by tertiles.
Table 4.
suPAR and All‐Cause Death in African Americans With T2D
| Variable | All‐Cause Death | |
|---|---|---|
| HR, P Value | 95% CI | |
| Model 0: suPAR (unadjusted) | ||
| suPAR, per 100% increase (log2) | 2.98, <0.001a | 2.00, 4.43a |
| Model 1: clinical characteristics+hs‐CRP | ||
| Age, per 10 years | 1.39, 0.066 | 0.98, 1.97 |
| Male | 2.16, 0.010a | 1.20, 3.87a |
| Body mass index, per 5 kg/m2 | 1.03, 0.775 | 0.87, 1.21 |
| Hypertension | 1.21, 0.642 | 0.54, 2.71 |
| Current smoking | 2.05, 0.009a | 1.20, 3.53a |
| History of coronary artery disease | 1.57, 0.105 | 0.91, 2.69 |
| Statin therapy | 0.46, 0.007a | 0.26, 0.81a |
| HDL, per mg/dL | 1.01, 0.347 | 0.99, 1.03 |
| LDL, per mg/dL | 0.99, 0.005a | 0.98, 1.00a |
| Hemoglobin A1c, per % | 1.04, 0.654 | 0.88, 1.22 |
| Insulin treatment | 2.52, 0.002a | 1.40, 4.51a |
| Duration since diagnosis of T2D, per 1 year | 0.98, 0.230 | 0.94, 1.02 |
| Estimated glomerular filtration rate, per 10 mL/min per 1.73 m2 | 0.91, 0.171 | 0.79, 1.04 |
| Urine albumin‐creatinine ratio, per 10 mg/g | 1.00, 0.818 | 1.00, 1.01 |
| hs‐CRP, per 100% increase (log2) | 0.98, 0.911 | 0.68, 1.42 |
| Model 2: clinical characteristics+hs‐CRP+suPAR | ||
| suPAR, per 100% increase (log2) | 2.65, <0.001a | 1.63, 4.29a |
| Model 3: clinical characteristics+hs‐CRP+suPAR+CAC | ||
| suPAR, per 100% increase (log2) | 2.65, <0.001a | 1.62, 4.35a |
| CAC, per 100% increase (log2) | 1.01, 0.77 | 0.94, 1.09 |
| Interaction and subgroup analyses | ||
| suPAR×CAC >0 | 1.10, 0.87 | 0.36, 3.37 |
| suPAR×insulin treatment | 0.92, 0.84 | 0.39, 2.18 |
Models 2 and 3, and the interaction analyses include the clinical characteristics in model 1 in addition to the listed variables. CAC indicates coronary artery calcium scores; CI, confidence interval; HDL, high‐density lipoprotein; HR, hazard ratio; hs‐CRP, high‐sensitivity C‐reactive protein; LDL, low‐density lipoprotein; suPAR, soluble urokinase plasminogen activator receptor; T2D, type 2 diabetes mellitus.
Statistically significant at P<0.05.
The incremental value of adding suPAR to a model containing traditional risk factors and clinical characteristics in prediction of all‐cause mortality was assessed. Addition of suPAR to a baseline clinical model significantly improved the C‐statistic for all‐cause death (Δ0.050, 95% CI [0.001, 0.100]), whereas addition of CAC (Δ0.005, 95% CI [−0.016, 0.027]) or hs‐CRP (Δ−0.001, 95% CI [−0.009, 0.007]) did not (Table 5). The net reclassification improvement with addition of suPAR was significant (48%, 95% CI [33%, 56%]), whereas the net reclassification improvement with CAC was not (61%, 95% CI [−47%, 72%]). The integrated discrimination improvements for suPAR or CAC were not statistically significant.
Table 5.
Risk Discrimination for All‐Cause Mortality in African Americans With Type 2 Diabetes Mellitus
| Model | All‐Cause Mortality | |
|---|---|---|
| C‐Statistic (95% CI) | ∆C‐Statistic (95% CI) | |
| Model 1: risk factors only | 0.689 (0.592, 0.784) | ··· |
| Model 2: RF and hs‐CRP | 0.678 (0.579, 0.780) | −0.001 (−0.009, 0.007) |
| Model 3: RF and CAC | 0.694 (0.595, 0.793) | 0.005 (−0.016, 0.027) |
| Model 4: RF and suPAR | 0.739 (0.647, 0.831) | 0.050 (0.004, 0.100) |
| Model 5: RF, suPAR, hs‐CRP and CAC | 0.740 (0.643, 0.838) | 0.052 (0.002, 0.102) |
Models 1 through 4 include age, sex, body mass index, smoking history, hypertension, baseline estimated glomerular filtration rate, low‐density and high‐density lipoprotein levels (risk factors [RF]). Models 2 to 4 include aforementioned risk factors in addition to hs‐CRP (high‐sensitivity C‐reactive protein), CAC (coronary artery calcium score), and suPAR (soluble urokinase plasminogen activator receptor) levels, respectively. Model 5 includes RF, suPAR, hs‐CRP, and CAC levels. The reported change in C‐statistic is relative to the RF‐only model. CI indicates confidence interval.
Discussion
In this prospective study of African Americans with T2D, we found suPAR to be a significant predictor of mortality, more strongly associated with all‐causes of death than established biomarkers such as hs‐CRP and CAC. SuPAR significantly improved risk stratification beyond traditional cardiovascular disease risk factors, and concentrations exhibited modest correlations with CAC. Elevated levels were associated with increasing arterial calcification after 5‐year follow‐up. Finally, we found insulin treatment to be a major determinant of suPAR levels in patients with T2D, independent from hemoglobin A1c or age at diagnosis.
This is the first study of which we are aware comparing suPAR with CAC for association with all‐cause mortality. We and others have previously reported that suPAR levels are predictive of outcomes independent from traditional risk factors and add incremental benefit to models adjusted for biomarkers including hs‐CRP, raising the C‐statistic by 0.050.11, 12, 13, 17, 31 Conversely, addition of hs‐CRP to fully‐adjusted models led to a change in C‐statistic in the range of 0.004.32 In the present AA‐DHS analysis, neither hs‐CRP or CAC were independent predictors of all‐cause mortality or improved risk discrimination after adjusting for known clinical characteristics such as smoking, insulin use, and kidney function, findings that contrast with previously reported associations.33, 34 This likely relates to the relatively small sample and low number of events in this subset of the AA‐DHS. Given these limitations, our findings do not contradict the well‐established association between CAC and adverse outcomes but, rather, highlight the strong association between suPAR and all‐cause mortality.
The pathophysiologic mechanisms underlying association between suPAR and adverse cardiovascular outcomes and mortality are unknown. Its membrane‐bound form, uPAR, is present in multiple cell types, including immunologically active cells and endothelial cells, and encompasses physiologic roles impacting the coagulation cascade through the plasminogen activating pathway, cell signaling through integrins, and cell motility.35, 36 Although it may reflect immune activation, suPAR levels remain stable during episodes of sudden stress such as acute myocardial infarction or surgery; thus, suPAR differs from other inflammatory biomarkers such as hs‐CRP and interleukin‐6, which are acute‐phase reactants.37, 38 SuPAR has been shown to scavenge vitronectin, a glycoprotein involved in coronary atherosclerosis.35 Asymmetric dimethylarginine, a marker of oxidative stress, has also been shown to correlate with suPAR levels39; suPAR levels correlate with CAD risk factors and subclinical vascular dysfunction and can be modified by smoking cessation.13, 40, 41 In this study baseline suPAR levels were associated with increased CAC at follow‐up, consistent with a presumed role in atherosclerosis.35 Several studies identified an association between suPAR and incident T2D.42, 43 In this study, individuals receiving insulin therapy had significantly higher suPAR concentrations, likely reflecting chronic inflammation and/or insulin resistance.
There is a consistent association between suPAR levels and adverse outcomes in the general population, critically ill patients, and those with CAD, HIV infection, malignancy, and chronic kidney disease; these effects are not dampened in multivariable analyses. Moreover, the multivariable models identifying determinants of suPAR levels that incorporate risk factors and clinical characteristics relevant to cardiovascular outcomes only explain a low percentage of the variance in suPAR levels. Thus, it appears likely that suPAR levels reflect cardiac and extracardiac pathophysiologic processes that are unaccounted for by known clinical characteristics, and therefore, may provide significant improvement to current risk stratification models.9, 10, 11, 12, 13, 14, 15, 16, 41, 44, 45 While we await additional studies to elucidate the pathogenic role of suPAR or the pathways its levels represent, we envision the potential for use of suPAR concentrations in risk stratification to personalize care and optimize resource allocation.
Strengths and Limitations
The strengths of this report include its community‐based African American study sample, a cohort with access to healthcare based on high rates of treatment for hypertension, hyperlipidemia, and hyperglycemia. The AA‐DHS is also among the most extensively phenotyped cohorts of individuals with T2D, including measures of albuminuria, hs‐CRP, and CAC; repeat measures were available in a subset. Participants had generally preserved kidney function, reducing effects of chronic kidney disease on mortality. The major limitations are the relatively small sample size with low numbers of deaths and the inability to distinguish death from cardiovascular and noncardiovascular causes. These precluded performance of further subgroup and sensitivity analyses. In addition, information on structural heart disease such as ejection fraction was not available. Although this cohort is focused on the understudied African American population, associations between suPAR and outcomes, specifically both all‐cause and cardiovascular mortality, have been described in multiple ethnic groups worldwide.9, 10, 11, 12, 13, 14, 15, 16, 17 Nonetheless, the present findings warrant replication in a larger, multiethnic cohort before justifying risk stratification based on suPAR in the clinic.
Conclusions and Clinical Implications
SuPAR levels are strong predictors of all‐cause mortality in African Americans with T2D and add incremental value to risk stratification beyond CAC and hs‐CRP. Whether measuring suPAR will alter management in patients with T2D warrants additional study.
Sources of Funding
Reiser is supported by NIH/NIDDK 5R01DK101350‐03; Freedman is supported by NIH/NIDDK R01 DK071891, NIH R01 NS075107; and Bowden is supported by NIH/NHLBI R01 HL67348.
Disclosures
Reiser is cofounder of TRISAQ, a biotechnology company that develops suPAR products. The remaining authors have no disclosures to report.
Acknowledgments
The authors wish to acknowledge AA‐DHS study participants and research personnel at the Wake Forest School of Medicine.
(J Am Heart Assoc. 2018;7:e008194 DOI: 10.1161/JAHA.117.008194.)29716888
References
- 1. Benjamin EJ, Blaha MJ, Chiuve SE, Cushman M, Das SR, Deo R, de Ferranti SD, Floyd J, Fornage M, Gillespie C, Isasi CR, Jimenez MC, Jordan LC, Judd SE, Lackland D, Lichtman JH, Lisabeth L, Liu S, Longenecker CT, Mackey RH, Matsushita K, Mozaffarian D, Mussolino ME, Nasir K, Neumar RW, Palaniappan L, Pandey DK, Thiagarajan RR, Reeves MJ, Ritchey M, Rodriguez CJ, Roth GA, Rosamond WD, Sasson C, Towfighi A, Tsao CW, Turner MB, Virani SS, Voeks JH, Willey JZ, Wilkins JT, Wu JH, Alger HM, Wong SS, Muntner P; American Heart Association Statistics Committee and Stroke Statistics Subcommittee . Heart disease and stroke statistics—2017 update: a report from the American Heart Association. Circulation. 2017;135:e146–e603. [DOI] [PMC free article] [PubMed] [Google Scholar]
- 2. Goff DC Jr, Lloyd‐Jones DM, Bennett G, Coady S, D'Agostino RB, Gibbons R, Greenland P, Lackland DT, Levy D, O'Donnell CJ, Robinson JG, Schwartz JS, Shero ST, Smith SC Jr, Sorlie P, Stone NJ, Wilson PW, Jordan HS, Nevo L, Wnek J, Anderson JL, Halperin JL, Albert NM, Bozkurt B, Brindis RG, Curtis LH, DeMets D, Hochman JS, Kovacs RJ, Ohman EM, Pressler SJ, Sellke FW, Shen WK, Smith SC Jr, Tomaselli GF; American College of Cardiology/American Heart Association Task Force on Practice Guidelines . 2013 ACC/AHA guideline on the assessment of cardiovascular risk: a report of the American College of Cardiology/American Heart Association Task Force on Practice Guidelines. Circulation. 2014;129:S49–S73. [DOI] [PubMed] [Google Scholar]
- 3. Expert Panel on Detection Evaluation Treatment of High Blood Cholesterol in Adults . Executive summary of the Third Report of the National Cholesterol Education Program (NCEP) expert panel on detection, evaluation, and treatment of high blood cholesterol in adults (adult treatment panel III). JAMA. 2001;285:2486–2497. [DOI] [PubMed] [Google Scholar]
- 4. Rana JS, Liu JY, Moffet HH, Jaffe M, Karter AJ. Diabetes and prior coronary heart disease are not necessarily risk equivalent for future coronary heart disease events. J Gen Intern Med. 2016;31:387–393. [DOI] [PMC free article] [PubMed] [Google Scholar]
- 5. Malik S, Budoff MJ, Katz R, Blumenthal RS, Bertoni AG, Nasir K, Szklo M, Barr RG, Wong ND. Impact of subclinical atherosclerosis on cardiovascular disease events in individuals with metabolic syndrome and diabetes: the Multi‐Ethnic Study of Atherosclerosis. Diabetes Care. 2011;34:2285–2290. [DOI] [PMC free article] [PubMed] [Google Scholar]
- 6. Nasir K, Bittencourt MS, Blaha MJ, Blankstein R, Agatson AS, Rivera JJ, Miedema MD, Sibley CT, Shaw LJ, Blumenthal RS, Budoff MJ, Krumholz HM. Implications of coronary artery calcium testing among statin candidates according to American College of Cardiology/American Heart Association cholesterol management guidelines: MESA (Multi‐Ethnic Study of Atherosclerosis). J Am Coll Cardiol. 2015;66:1657–1668. [DOI] [PubMed] [Google Scholar]
- 7. Budoff MJ, Raggi P, Beller GA, Berman DS, Druz RS, Malik S, Rigolin VH, Weigold WG, Soman P; Imaging Council of the American College of Cardiology . Noninvasive cardiovascular risk assessment of the asymptomatic diabetic patient: the imaging council of the American College of Cardiology. JACC Cardiovasc Imaging. 2016;9:176–192. [DOI] [PMC free article] [PubMed] [Google Scholar]
- 8. Berezin AE. Cardiac biomarkers in diabetes mellitus: new dawn for risk stratification? Diabetes Metab Syndr. 2017;11(suppl 1):S201–S208. [DOI] [PubMed] [Google Scholar]
- 9. Botha S, Fourie CM, Schutte R, Eugen‐Olsen J, Pretorius R, Schutte AE. Soluble urokinase plasminogen activator receptor as a prognostic marker of all‐cause and cardiovascular mortality in a black population. Int J Cardiol. 2015;184:631–636. [DOI] [PubMed] [Google Scholar]
- 10. Cyrille NB, Villablanca PA, Ramakrishna H. Soluble urokinase plasminogen activation receptor—an emerging new biomarker of cardiovascular disease and critical illness. Ann Card Anaesth. 2016;19:214–216. [DOI] [PMC free article] [PubMed] [Google Scholar]
- 11. Eapen DJ, Manocha P, Ghasemzadeh N, Patel RS, Al Kassem H, Hammadah M, Veledar E, Le NA, Pielak T, Thorball CW, Velegraki A, Kremastinos DT, Lerakis S, Sperling L, Quyyumi AA. Soluble urokinase plasminogen activator receptor level is an independent predictor of the presence and severity of coronary artery disease and of future adverse events. J Am Heart Assoc. 2014;3:e001118 DOI: 10.1161/JAHA.114.001118. [DOI] [PMC free article] [PubMed] [Google Scholar]
- 12. Eugen‐Olsen J, Andersen O, Linneberg A, Ladelund S, Hansen TW, Langkilde A, Petersen J, Pielak T, Moller LN, Jeppesen J, Lyngbaek S, Fenger M, Olsen MH, Hildebrandt PR, Borch‐Johnsen K, Jorgensen T, Haugaard SB. Circulating soluble urokinase plasminogen activator receptor predicts cancer, cardiovascular disease, diabetes and mortality in the general population. J Intern Med. 2010;268:296–308. [DOI] [PubMed] [Google Scholar]
- 13. Lyngbaek S, Marott JL, Sehestedt T, Hansen TW, Olsen MH, Andersen O, Linneberg A, Haugaard SB, Eugen‐Olsen J, Hansen PR, Jeppesen J. Cardiovascular risk prediction in the general population with use of suPAR, CRP, and Framingham Risk Score. Int J Cardiol. 2013;167:2904–2911. [DOI] [PubMed] [Google Scholar]
- 14. Meijers B, Poesen R, Claes K, Dietrich R, Bammens B, Sprangers B, Naesens M, Storr M, Kuypers D, Evenepoel P. Soluble urokinase receptor is a biomarker of cardiovascular disease in chronic kidney disease. Kidney Int. 2015;87:210–216. [DOI] [PubMed] [Google Scholar]
- 15. Persson M, Engstrom G, Bjorkbacka H, Hedblad B. Soluble urokinase plasminogen activator receptor in plasma is associated with incidence of CVD. Results from the Malmo Diet and Cancer Study. Atherosclerosis. 2012;220:502–505. [DOI] [PubMed] [Google Scholar]
- 16. Donadello K, Scolletta S, Taccone FS, Covajes C, Santonocito C, Cortes DO, Grazulyte D, Gottin L, Vincent JL. Soluble urokinase‐type plasminogen activator receptor as a prognostic biomarker in critically ill patients. J Crit Care. 2014;29:144–149. [DOI] [PubMed] [Google Scholar]
- 17. Drechsler C, Hayek SS, Wei C, Sever S, Genser B, Krane V, Meinitzer A, Marz W, Wanner C, Reiser J. Soluble urokinase plasminogen activator receptor and outcomes in patients with diabetes on hemodialysis. Clin J Am Soc Nephrol. 2017;12:1265–1273. [DOI] [PMC free article] [PubMed] [Google Scholar]
- 18. Hahm E, Wei C, Fernandez I, Li J, Tardi NJ, Tracy M, Wadhwani S, Cao Y, Peev V, Zloza A, Lusciks J, Hayek SS, O'Connor C, Bitzer M, Gupta V, Sever S, Sykes DB, Scadden DT, Reiser J. Bone marrow‐derived immature myeloid cells are a main source of circulating suPAR contributing to proteinuric kidney disease. Nat Med. 2017;23:100–106. [DOI] [PMC free article] [PubMed] [Google Scholar]
- 19. Hayek SS, Ko YA, Awad M, Ahmed H, Gray B, Hosny KM, Aida H, Tracy MJ, Wei C, Sever S, Reiser J, Quyyumi AA. Cardiovascular disease biomarkers and suPAR in predicting decline in renal function: a prospective cohort study. Kidney Int Rep. 2017;2:425–432. [DOI] [PMC free article] [PubMed] [Google Scholar]
- 20. Hayek SS, Koh KH, Grams ME, Wei C, Ko YA, Li J, Samelko B, Lee H, Dande RR, Lee HW, Hahm E, Peev V, Tracy M, Tardi NJ, Gupta V, Altintas MM, Garborcauskas G, Stojanovic N, Winkler CA, Lipkowitz MS, Tin A, Inker LA, Levey AS, Zeier M, Freedman BI, Kopp JB, Skorecki K, Coresh J, Quyyumi AA, Sever S, Reiser J. A tripartite complex of suPAR, APOL1 risk variants and αvβ3 integrin on podocytes mediates chronic kidney disease. Nat Med. 2017;23:945–953. [DOI] [PMC free article] [PubMed] [Google Scholar]
- 21. Hayek SS, Sever S, Ko YA, Trachtman H, Awad M, Wadhwani S, Altintas MM, Wei C, Hotton AL, French AL, Sperling LS, Lerakis S, Quyyumi AA, Reiser J. Soluble urokinase receptor and chronic kidney disease. N Engl J Med. 2015;373:1916–1925. [DOI] [PMC free article] [PubMed] [Google Scholar]
- 22. Samman Tahhan A, Hayek SS, Sandesara P, Hajjari J, Hammadah M, O'Neal WT, Kelli HM, Alkhoder A, Ghasemzadeh N, Ko YA, Aida H, Gafeer MM, Abdelhadi N, Mohammed KH, Patel K, Arya S, Reiser J, Vaccarino V, Sperling L, Quyyumi A. Circulating soluble urokinase plasminogen activator receptor levels and peripheral arterial disease outcomes. Atherosclerosis. 2017;264:108–114. [DOI] [PMC free article] [PubMed] [Google Scholar]
- 23. Sorensen MH, Gerke O, Eugen‐Olsen J, Munkholm H, Lambrechtsen J, Sand NP, Mickley H, Rasmussen LM, Olsen MH, Diederichsen A. Soluble urokinase plasminogen activator receptor is in contrast to high‐sensitive C‐reactive‐protein associated with coronary artery calcifications in healthy middle‐aged subjects. Atherosclerosis. 2014;237:60–66. [DOI] [PubMed] [Google Scholar]
- 24. Divers J, Palmer ND, Lu L, Register TC, Carr JJ, Hicks PJ, Hightower RC, Smith SC, Xu J, Cox AJ, Hruska KA, Bowden DW, Lewis CE, Heiss G, Province MA, Borecki IB, Kerr KF, Chen YD, Palmas W, Rotter JI, Wassel CL, Bertoni AG, Herrington DM, Wagenknecht LE, Langefeld CD, Freedman BI. Admixture mapping of coronary artery calcified plaque in African Americans with type 2 diabetes mellitus. Circ Cardiovasc Genet. 2013;6:97–105. [DOI] [PMC free article] [PubMed] [Google Scholar]
- 25. Freedman BI, Divers J, Russell GB, Palmer ND, Bowden DW, Carr JJ, Wagenknecht LE, Hightower RC, Xu J, Smith SC, Langefeld CD, Hruska KA, Register TC. Plasma FGF23 and calcified atherosclerotic plaque in African Americans with type 2 diabetes mellitus. Am J Nephrol. 2015;42:391–401. [DOI] [PMC free article] [PubMed] [Google Scholar]
- 26. Stevens PE, Levin A; Kidney Disease: Improving Global Outcomes Chronic Kidney Disease Guideline Development Work Group Members . Evaluation and management of chronic kidney disease: synopsis of the kidney disease: improving global outcomes 2012 clinical practice guideline. Ann Intern Med. 2013;158:825–830. [DOI] [PubMed] [Google Scholar]
- 27. Wojcik NC, Huebner WW, Jorgensen G. Strategies for using the National Death Index and the Social Security Administration for death ascertainment in large occupational cohort mortality studies. Am J Epidemiol. 2010;172:469–477. [DOI] [PubMed] [Google Scholar]
- 28. Bowden DW, Lange LA, Langefeld CD, Brosnihan KB, Freedman BI, Carr JJ, Wagenknecht LE, Herrington DM. The relationship between C‐reactive protein and subclinical cardiovascular disease in the Diabetes Heart Study (DHS). Am Heart J. 2005;150:1032–1038. [DOI] [PubMed] [Google Scholar]
- 29. Uno H, Cai T, Pencina MJ, D'Agostino RB, Wei LJ. On the C‐statistics for evaluating overall adequacy of risk prediction procedures with censored survival data. Stat Med. 2011;30:1105–1117. [DOI] [PMC free article] [PubMed] [Google Scholar]
- 30. Uno H, Tian L, Cai T, Kohane IS, Wei LJ. A unified inference procedure for a class of measures to assess improvement in risk prediction systems with survival data. Stat Med. 2013;32:2430–2442. [DOI] [PMC free article] [PubMed] [Google Scholar]
- 31. Ghasemzedah N, Hayek SS, Ko YA, Eapen DJ, Patel RS, Manocha P, Al Kassem H, Khayata M, Veledar E, Kremastinos D, Thorball CW, Pielak T, Sikora S, Zafari AM, Lerakis S, Sperling L, Vaccarino V, Epstein SE, Quyyumi AA. Pathway‐specific aggregate biomarker risk score is associated with burden of coronary artery disease and predicts near‐term risk of myocardial infarction and death. Circ Cardiovasc Qual Outcomes. 2017;10:e001493. [DOI] [PMC free article] [PubMed] [Google Scholar]
- 32. Emerging Risk Factors Collaboration , Kaptoge S, Di Angelantonio E, Pennells L, Wood AM, White IR, Gao P, Walker M, Thompson A, Sarwar N, Caslake M, Butterworth AS, Amouyel P, Assmann G, Bakker SJ, Barr EL, Barrett‐Connor E, Benjamin EJ, Bjorkelund C, Brenner H, Brunner E, Clarke R, Cooper JA, Cremer P, Cushman M, Dagenais GR, D'Agostino RB Sr, Dankner R, Davey‐Smith G, Deeg D, Dekker JM, Engstrom G, Folsom AR, Fowkes FG, Gallacher J, Gaziano JM, Giampaoli S, Gillum RF, Hofman A, Howard BV, Ingelsson E, Iso H, Jorgensen T, Kiechl S, Kitamura A, Kiyohara Y, Koenig W, Kromhout D, Kuller LH, Lawlor DA, Meade TW, Nissinen A, Nordestgaard BG, Onat A, Panagiotakos DB, Psaty BM, Rodriguez B, Rosengren A, Salomaa V, Kauhanen J, Salonen JT, Shaffer JA, Shea S, Ford I, Stehouwer CD, Strandberg TE, Tipping RW, Tosetto A, Wassertheil‐Smoller S, Wennberg P, Westendorp RG, Whincup PH, Wilhelmsen L, Woodward M, Lowe GD, Wareham NJ, Khaw KT, Sattar N, Packard CJ, Gudnason V, Ridker PM, Pepys MB, Thompson SG, Danesh J. C‐reactive protein, fibrinogen, and cardiovascular disease prediction. N Engl J Med. 2012;367:1310–1320. [DOI] [PMC free article] [PubMed] [Google Scholar]
- 33. Yeboah J, McClelland RL, Polonsky TS, Burke GL, Sibley CT, O'Leary D, Carr JJ, Goff DC, Greenland P, Herrington DM. Comparison of novel risk markers for improvement in cardiovascular risk assessment in intermediate‐risk individuals. JAMA. 2012;308:788–795. [DOI] [PMC free article] [PubMed] [Google Scholar]
- 34. Kramer CK, Zinman B, Gross JL, Canani LH, Rodrigues TC, Azevedo MJ, Retnakaran R. Coronary artery calcium score prediction of all cause mortality and cardiovascular events in people with type 2 diabetes: systematic review and meta‐analysis. BMJ. 2013;346:f1654. [DOI] [PubMed] [Google Scholar]
- 35. Smith HW, Marshall CJ. Regulation of cell signalling by uPAR. Nat Rev Mol Cell Biol. 2010;11:23–36. [DOI] [PubMed] [Google Scholar]
- 36. Thuno M, Macho B, Eugen‐Olsen J. suPAR: the molecular crystal ball. Dis Markers. 2009;27:157–172. [DOI] [PMC free article] [PubMed] [Google Scholar]
- 37. Gozdzik W, Adamik B, Gozdzik A, Rachwalik M, Kustrzycki W, Kubler A. Unchanged plasma levels of the soluble urokinase plasminogen activator receptor in elective coronary artery bypass graft surgery patients and cardiopulmonary bypass use. PLoS One. 2014;9:e98923. [DOI] [PMC free article] [PubMed] [Google Scholar]
- 38. Lyngbaek S, Marott JL, Moller DV, Christiansen M, Iversen KK, Clemmensen PM, Eugen‐Olsen J, Jeppesen JL, Hansen PR. Usefulness of soluble urokinase plasminogen activator receptor to predict repeat myocardial infarction and mortality in patients with ST‐segment elevation myocardial infarction undergoing primary percutaneous intervention. Am J Cardiol. 2012;110:1756–1763. [DOI] [PubMed] [Google Scholar]
- 39. Koch A, Weiskirchen R, Kunze J, Duckers H, Bruensing J, Buendgens L, Matthes M, Luedde T, Trautwein C, Tacke F. Elevated asymmetric dimethylarginine levels predict short‐ and long‐term mortality risk in critically ill patients. J Crit Care. 2013;28:947–953. [DOI] [PubMed] [Google Scholar]
- 40. Eugen‐Olsen J, Ladelund S, Sorensen LT. Plasma suPAR is lowered by smoking cessation: a randomized controlled study. Eur J Clin Invest. 2016;46:305–311. [DOI] [PubMed] [Google Scholar]
- 41. Arbel Y, Strauss BH. suPAR: a cardiac biomarker with a future? Can J Cardiol. 2015;31:1223–1224. [DOI] [PubMed] [Google Scholar]
- 42. Heraclides A, Jensen T, Rasmussen S, Eugen‐Olsen J, Haugaard S, Borch‐Johnsen K, Sandbæk A, Lauritzen T, Witte DR. The pro‐inflammatory biomarker soluble urokinase plasminogen activator receptor (suPAR) is associated with incident type 2 diabetes among overweight but not obese individuals with impaired glucose regulation: effect modification by smoking and body weight status. Diabetologia. 2013;56:1542–1546. [DOI] [PubMed] [Google Scholar]
- 43. Haugaard S, Andersen O, Hansen T, Eugen‐Olsen J, Linneberg A, Madsbad S, Olsen M, Jørgensen T, Borch‐Johnsen K, Jeppesen J. The immune marker soluble urokinase plasminogen activator receptor is associated with new‐onset diabetes in non‐smoking women and men. Diabet Med. 2012;29:479–487. [DOI] [PubMed] [Google Scholar]
- 44. Haupt TH, Petersen J, Ellekilde G, Klausen HH, Thorball CW, Eugen‐Olsen J, Andersen O. Plasma suPAR levels are associated with mortality, admission time, and Charlson Comorbidity Index in the acutely admitted medical patient: a prospective observational study. Crit Care. 2012;16:R130. [DOI] [PMC free article] [PubMed] [Google Scholar]
- 45. Hayek SS, Neuman R, Ashraf K, Sher S, Newman JL, Karatela S, Roback JD, Quyyumi AA. Effect of storage‐aged red blood cell transfusions on endothelial function in healthy subjects. Transfusion. 2015;55:2768–2770. [DOI] [PMC free article] [PubMed] [Google Scholar]