

Abstract
Background
Although orthostatic hypotension (OH) is a well‐recognized manifestation of neuropathy and hypovolemia, its contribution to cardiovascular disease (CVD) risk is controversial.
Methods and Results
Participants with OH, defined as a decrease in blood pressure (systolic ≥20 mm Hg or diastolic ≥10 mm Hg) from the supine to standing position, were identified during the first visit of the ARIC (Atherosclerosis Risk in Communities) Study (1987–1989) within 2 minutes of standing. All participants were followed up for the development of myocardial infarction, heart failure, stroke, fatal coronary heart disease (CHD), any CHD (combination of silent, nonfatal, and fatal CHD or cardiac procedures), and all‐cause mortality. Participants were assessed for carotid intimal thickness and plaque during the first visit. Detectable high‐sensitivity troponin T (≥5 ng/L) and elevated NT‐proBNP (N‐terminal pro‐B‐type natriuretic peptide; ≥100 pg/mL) were determined in blood collected during the second visit (1990–1992). All associations were adjusted for known CVD risk factors. In 9139 participants (57% women; 23% black; mean age, 54±5.7 years), 3% had OH. During follow‐up (median, 26 years), OH was associated with myocardial infarction (hazard ratio [HR], 1.88; 95% confidence interval [CI], 1.44–2.46), congestive heart failure (HR, 1.65; 95% CI, 1.34–2.04), stroke (HR, 1.83; 95% CI, 1.35–2.48), fatal CHD (HR, 2.77; 95% CI, 1.93–3.98), any CHD (HR, 2.00; 95% CI, 1.64–2.44), and all‐cause mortality (HR, 1.68; 95% CI, 1.45–1.95). OH was also associated with carotid intimal thickness (β, 0.05 mm; 95% CI, 0.04–0.07 mm), carotid plaque (odds ratio, 1.51; 95% CI, 1.18–1.93), detectable high‐sensitivity troponin T (odds ratio, 1.49; 95% CI, 1.16–1.93), and elevated NT‐proBNP (odds ratio, 1.92; 95% CI, 1.48–2.49).
Conclusions
OH identified in community‐dwelling middle‐aged adults was associated with future CVD events and subclinical CVD. Further research is necessary to establish a causal role for OH in the pathogenesis of CVD.
Keywords: cardiovascular disease, heart failure, high‐sensitivity troponin, mortality, NT‐proBNP, orthostatic hypotension, stroke
Subject Categories: High Blood Pressure, Ischemic Stroke, Epidemiology, Heart Failure, Myocardial Infarction
Clinical Perspective
What Is New?
Postural change in blood pressure is associated with clinical cardiovascular disease (CVD) events independent of established cardiovascular risk factors and across a continuum that does not correspond with established definitions of orthostatic hypotension (OH).
OH is associated with concurrent subclinical markers of atherosclerosis as well as intermediate‐term elevations in biomarkers reflecting myocardial injury and strain, suggesting pathways relating OH and the pathogenesis of CVD events.
What Are the Clinical Implications?
Rather than consider OH as a diagnostic end point in clinical evaluations, the identification of OH in ambulatory middle‐aged adults should be considered a clinical sign that prompts further consideration as to underlying cause, including subclinical CVD.
Current OH definitions do not reflect thresholds in risk; thus, postural changes in blood pressure not meeting the consensus definition cannot be reliably used to exclude subclinical CVD.
Consideration of undiagnosed CVD is particularly important when considering interventions to treat OH (eg, sodium intake and deescalation of antihypertensive agents) because these could exacerbate underlying pathophysiological features.
Orthostatic hypotension (OH) is common in adults with hypertension1, 2, 3 and diabetes mellitus4 and is associated with several adverse health outcomes, including falls, syncope, and death.5 Although OH has been associated with change in heart structure over time, suggestive of a causal relationship,6 the association between OH and cardiovascular disease (CVD) in the literature is inconsistent. Several prospective studies reported no association between OH and coronary heart disease (CHD)7, 8, 9 or CVD mortality.10 Similarly, a recent secondary study of ACCORD (Action to Control Cardiovascular Risk in Diabetes Blood Pressure Trial), a trial of blood pressure (BP) reduction in a population with diabetes mellitus, found that although OH was associated with death and heart failure (HF), it was not associated with atherosclerotic events.11 In contrast, many studies have shown that OH is associated with CVD events12, 13, 14, 15, 16, 17 and CVD mortality.14, 18
The ARIC (Atherosclerosis Risk in Communities) Study was launched in 1987 to examine the cause and natural history of CVD. Substantial laboratory and physical examination measures were performed, including OH. In addition to extensive follow‐up with adjudicated events, the ARIC Study included rigorous evaluations of atherosclerotic risk factors as well as intermediate‐term biomarker measures of pathways related to CVD pathogenesis. Thus, this study affords a unique opportunity to examine subclinical correlates of OH, biomarker intermediaries of CVD, and, most important, clinical CVD outcomes.
In this study, we sought to comprehensively examine whether OH in community‐based middle‐aged adults without known coronary disease was associated with the following: (1) future CVD outcomes, particularly myocardial infarction (MI), HF, stroke, fatal CHD, any CHD (combination of silent, nonfatal, or fatal CHD and cardiac procedures), and death; (2) concurrent measures of subclinical atherosclerosis; and (3) intermediate‐term measures of subclinical myocardial damage and cardiac wall strain.
Methods
Requests for the data, analytic methods, and study materials used in this study for purposes of reproducing the results or replicating the procedure may be submitted to the ARIC Study publications committee.
Study Population
The ARIC Study is a prospective cohort, which enrolled 15 792 adults, aged 45 to 64 years, between 1987 and 1989 from 4 US communities. Participants have been followed for >2 decades.19, 20, 21 The original ARIC Study protocol included physical examinations, medical interviews, and laboratory tests. In this analysis, we excluded the following: (1) participants who did not have an OH assessment at baseline (1987–1989) because of late implementation of this protocol (N=2555); (2) participants who had a history of CHD (N=766), HF (N=752), or stroke (N=284); (3) participants who were missing relevant covariate data at baseline as well as underrepresented racial groups (N=3222); or (4) those who were missing measurement or follow‐up data for outcomes of interest (N=4094). This resulted in a study population of 9139 participants (some participants met multiple exclusion criteria). History of CHD was based on ECGs (silent MI), self‐report, or self‐reported history of previous coronary procedures. History of HF was defined as active use of medications to treat HF or self‐reported symptoms associated with HF on the basis of the Gothenburg criteria.22 History of stroke was based on self‐report. We excluded participants with self‐reported CHD, congestive heart failure, or stroke to study a population without known CVD to assess the association between OH with incident CVD events.
All participants were clinically stable at the time of their study assessment. All participants provided written informed consent. The study protocol was approved by institutional review boards at all study sites.
Exposure: Orthostatic Hypotension
OH was assessed during the baseline visit. Supine systolic BP (SBP) and diastolic BP (DBP) were measured with a Dinamap 1846 SX oscillometric device (automatic cuff) after participants had been lying down for 20 minutes.23, 24 Up to 5 measurements were recorded approximately every 20 to 30 seconds (range of 2–5 supine measurements with at least 4 measurements obtained for 90% of participants). Supine BP was based on the average of these measurements. Participants were then instructed to stand up quickly, safely, and in one smooth motion. Once a participant's feet were planted on the ground, the ARIC Study staff proceeded to initiate the automatic cuff, which was programmed to measure BP up to 5 times (range of 2–5 standing measurements with at least 4 measurements recorded for 91% of participants). The end and initiation of each BP measurement was separated by 2 to 3 seconds. All measurements occurred within the first 2 minutes of standing.
The average of up to 5 measures for either SBP or DBP were used to determine the standing BP. We did not exclude the first standing measure because it has been shown to be informative for long‐term events.5 Change in SBP or DBP from supine to standing was determined by taking the mean standing measure and subtracting the mean supine measure for either SBP or DBP. OH was defined using thresholds similar to the original consensus definition (ie, a decrease in either SBP or DBP of at least 20 or 10 mm Hg, respectively).25, 26 We also determined systolic OH (on the basis of a decrease in SBP of at least 20 mm Hg alone) and diastolic OH (on the basis of a decrease in DBP of at least 10 mm Hg alone) as well as a severe OH subgroup meeting both criteria (a decrease in SBP of at least 20 mm Hg and a decrease in DBP of at least 10 mm Hg). Finally, we examined postural change in SBP or DBP (per 10 mm Hg decrease in BP).
Clinical Outcomes: MI, HF, Stroke, Fatal CHD, Any CHD, and Death
Participants were followed up for CVD events and mortality through December 31, 2015. Details pertaining to the ascertainment and adjudication of these events have been detailed previously.21 In brief, these outcomes were ascertained through active surveillance of surrounding hospital records and annual telephone calls with participants or their proxies. Fatalities were also identified via state and national death indexes. Trained personnel abstracted hospital records related to possible CVD, which were reviewed and adjudicated by an expert panel.
Incident MI was defined as definite or probable MI on the basis of adjudicator review. Incident HF was based on the first hospitalization or death related to HF using International Classification of Diseases, Ninth Revision (ICD‐9) codes of 428.x or I50 (10th revision) in any position on the hospital discharge list or on a death certificate. All HF events were adjudicated after 2005. Incident stroke events were ascertained through a combination of active surveillance of hospitalizations, cohort follow‐up, and linkage with death registries. All events were adjudicated by committee review. We included definite or probable stroke events in this study. Fatal CHD was defined by death related to CHD. Any CHD was based on a composite definition of definite or probable MI, fatal CHD, cardiac procedure, or silent MI on the basis of ECG.
Concurrent Subclinical Measures: Carotid Intimal Thickness and Carotid Plaque
Carotid intimal thickness (CIMT) was assessed via a B‐mode carotid ultrasound (Biosound 2000 II SA; Biosound, Indianapolis, IN). Evaluations were completed on bilateral segments of the extracranial carotid arteries of all participants at visit 1. The arithmetic mean was determined using distances measured from up to 6 paired points (3 left and 3 right) along 1‐cm segments on the far wall, specifically the common carotid artery, the bifurcation, and the internal carotid arteries. Measurements were further adjusted to account for method drift over the visit and systematic differences between readers. Only 13% of the sample had a mean CIMT at all 6 sites. As a result, missing sites were imputed from sex‐ and race‐specific multivariate linear models.27 Mean CIMT was modeled as a function of age, body mass index, and arterial depth. An average of 2.3 sites were imputed per person. The means at the 6 sites were combined to produce an overall mean CIMT. Mean values for participants who did not undergo any portion of the assessment were not imputed.
The presence of plaque (yes or no) was determined by trained readers on the basis of having at least 2 of the following: (1) abnormal wall thickness (defined as CIMT >1.5 mm), (2) abnormal shape (protrusion into the lumen and loss of alignment, with adjacent arterial wall boundary), or (3) abnormal wall texture (brighter echoes than adjacent boundaries).27
Intermediate‐Term Cardiac Markers: High‐Sensitivity Troponin T and NT‐proBNP
High‐sensitivity troponin T (hs‐cTnT) and NT‐proBNP (N‐terminal pro‐B‐type natriuretic peptide) concentrations were measured in stored serum specimens from ARIC Study visit 2 (1990–1992) using a Roche Elecsys 2010 Analyzer (Roche Diagnostics Corp) at the University of Minnesota. The troponin assay has a measurement range of 3 to 100 000 ng/mL. Interassay coefficients of variation were 6.0% at a mean hs‐cTnT concentration of 25 ng/L and 3.7% at 1940 ng/L. A detectable hs‐cTNT was defined as a value ≥5 ng/L. For NT‐proBNP, the measurement range was 5 to 35 000 pg/mL, with coefficients of variation of 3.5% to 4.7%. We defined an elevated NT‐proBNP as ≥100 pg/mL. We used a detectable hs‐cTnT and elevated NT‐proBNP on the basis of prior literature, suggesting that detectable hs‐cTNT is associated with underlying cardiac damage, whereas elevated NT‐proBNP is associated with cardiac wall strain.28, 29, 30
Baseline Covariates of Interest
Trained study personnel collected data at baseline using standardized protocols with extensive quality control measures.19, 20, 21 Covariates were selected a priori to examine the independent association between OH and CVD.28, 29, 31 We specifically examined established cardiovascular risk factors on the basis of demographic information, self‐reported behaviors, body mass index, cholesterol, and comorbid conditions (diabetes mellitus, hypertension, and chronic kidney disease). Age, sex (male or female), race (white or black), self‐reported dizziness (yes or no), alcohol use (never, former, or current), education level (less than high school, high school degree or vocational school, or at least some college or professional school), and smoking status (never, former, or current) were self‐reported. Participants’ leisure time physical activity was assessed via the ARIC Study/Baecke Physical Activity questionnaire.32 Because some sites were predominantly a single racial group, race was jointly classified with clinic center, as done previously: Forsythe County, North Carolina (white participants); Forsythe County, North Carolina (black participants); Jackson, MS (black participants); suburbs of Minneapolis, MN (white participants); and Washington County, Maryland (white participants).
Diabetes mellitus status was defined on the basis of a fasting blood glucose ≥126 mg/dL, a nonfasting blood glucose ≥200 mg/dL, a self‐reported diagnosis of diabetes mellitus, or self‐reported diabetes mellitus medication use. Sitting SBP and DBP levels were estimated from a mean of the second and third of 3 measurements obtained after 5 minutes of seated rest with a random‐zero mercury sphygmomanometer, and hypertension was defined as an SBP ≥140 mm Hg or DBP ≥90 mm Hg (the definition of hypertension at the time of these assessments) or self‐report of use of an antihypertensive medication.21 Antihypertensive use during the preceding 2 weeks was self‐reported.
Body mass index was calculated using height and weight measurements. Resting heart rate was determined from a baseline ECG taken at rest. Lipids (total, high‐density lipoprotein cholesterol, and triglycerides) were measured in fasting serum; low‐density lipoprotein cholesterol was calculated using the Friedewald equation.30 Serum creatinine was measured by the modified kinetic Jaffé method. Estimated glomerular filtration rate was determined from serum creatinine using the Chronic Kidney Disease Epidemiology Collaboration equation.33
Statistical Analysis
Baseline analyses
Baseline characteristics were compared by OH status using means and proportions.
Incident CVD events
We determined the relationship between OH, systolic OH, diastolic OH, postural change in SBP, and postural change in DBP (a total of 5 OH metrics) and incident MI, incident HF, incident stroke, fatal CHD, any CHD, and all‐cause mortality. Incidence rate was quantified via Poisson regression, adjusted for demographic covariates (age, sex, and race‐center), whereas hazard ratio was determined via Cox proportional hazard models, adjusted for age, sex, race‐center, estimated glomerular filtration rate, body mass index, resting heart rate, high‐density lipoprotein cholesterol, low‐density lipoprotein cholesterol, triglycerides, total cholesterol, diabetes mellitus status, hypertension status, antihypertensive medication use in the past 2 weeks, self‐reported dizziness, alcohol consumption, education level, physical activity, and smoking status. Restricted cubic splines with 4 knots (location determined by Harrell's method34) were used to examine the continuous relationship between postural change in SBP or DBP.
Concurrent measures of subclinical atherosclerosis
We also examined the cross‐sectional association between all 5 OH metrics with CIMT using linear regression adjusted for the covariates previously described. Linear regression, with OH modeled as restricted cubic splines with 4 knots adjusted with the covariates previously described, was used to characterize the relationship between orthostatic change in SBP or DBP with CIMT. Logistic regression with the same covariates was used to examine the relationship between the 5 OH metrics previously described and the presence of carotid plaque. Similarly, restricted cubic splines with 4 knots, using logistic regression adjusted for the covariates previously described, were used to characterize the relationship between continuous change in SBP or DBP with the presence of carotid plaque.
Intermediate‐term cardiac markers
We examined the relationship between all 5 OH metrics and detectable hs‐cTnT or elevated NT‐proBNP via logistic regression adjusted for the covariates previously described. The continuous relationship between change in SBP or DBP with detectable hs‐cTnT or elevated NT‐proBNP was modeled via restricted cubic splines with 4 knots.
Sensitivity analyses
We performed several sensitivity analyses, including adjusting all models for resting SBP or DBP and adjusting outcome models for baseline carotid plaque (yes or no). Furthermore, we repeated analyses excluding the first standing SBP and DBP measurement, as had been the traditional approach in the ARIC Study. Finally, we examined a subgroup of severe OH, on the basis of meeting OH criteria by both systolic and diastolic standing measurements.
All analyses were conducted using Stata 14.0 (StataCorp LP, College Station, TX).
Results
The study population (N=9139) was 57% women and 23% black, with a mean age of 54 (SD, 5.7) years at baseline (Table 1). There were 298 participants with OH detected after standing on the basis of either SBP or DBP (3.3%), 257 participants with OH on the basis of SBP (2.8%), and 93 participants with OH on the basis of DBP (1.0%); 52 had severe OH on the basis of both SBP and DBP (0.6%). Age, sitting SBP, diabetes mellitus status, hypertension, low‐density lipoprotein cholesterol, and triglycerides were higher among those with OH at baseline.
Table 1.
Baseline Population Characteristics by OH
| Characteristics | Overall (N=9139) | No OH (n=8841) | OH (n=298) |
|---|---|---|---|
| Age, y | 54.2 (5.7) | 54.1 (5.7) | 58.1 (5.2) |
| Female sex, N (%) | 5243 (57.4) | 5067 (57.3) | 176 (59.1) |
| Race‐study center, N (%) | |||
| Washington County (white) | 2249 (24.6) | 2167 (24.5) | 82 (27.5) |
| Jackson (black) | 1863 (20.4) | 1797 (20.3) | 66 (22.1) |
| Minneapolis (white) | 2558 (28.0) | 2501 (28.3) | 57 (19.1) |
| Forsyth County (black) | 230 (2.5) | 215 (2.4) | 15 (5.0) |
| Forsyth County (white) | 2239 (24.5) | 2161 (24.4) | 78 (26.2) |
| Sitting systolic blood pressure, mm Hg | 119.8 (17.9) | 119.4 (17.7) | 129.6 (20.6) |
| Sitting diastolic blood pressure, mm Hg | 73.1 (10.8) | 73.0 (10.7) | 75.6 (12.2) |
| Sitting heart rate, beats per minute | 66.3 (9.8) | 66.2 (9.7) | 68.5 (12.1) |
| Estimated glomerular filtration rate, mL/min per 1.73 m2 | 102.6 (14.7) | 102.8 (14.5) | 97.4 (16.9) |
| Body mass index, kg/m2 | 27.2 (4.9) | 27.2 (4.9) | 27.4 (5.8) |
| Diabetes mellitus, N (%) | 800 (8.8) | 747 (8.4) | 53 (17.8) |
| Hypertension, N (%) | 2641 (28.9) | 2481 (28.1) | 160 (53.7) |
| Hypertensive medication use in past 2 wk, N (%) | 2145 (23.5) | 2011 (22.7) | 134 (45.0) |
| Antihypertensive class use, N (%) | |||
| β Blocker | 745 (8.2) | 699 (7.9) | 46 (15.4) |
| Calcium channel blocker | 168 (1.8) | 152 (1.7) | 16 (5.4) |
| ACEi or ARB | 253 (2.8) | 235 (2.7) | 18 (6.0) |
| Diuretic use | 1236 (13.5) | 1164 (13.2) | 72 (24.2) |
| HDL cholesterol, mg/dL | 52.9 (17.1) | 52.9 (17.1) | 51.9 (16.2) |
| LDL cholesterol, mg/dL | 136.1 (38.1) | 135.8 (38.1) | 145.6 (38.0) |
| Triglycerides, mg/dL | 121.4 (62.8) | 121.0 (62.6) | 132.8 (67.8) |
| Cholesterol‐lowering medication use, N (%) | 210 (2.3) | 206 (2.3) | 4 (1.3) |
| Leisure index, U | 2.4 (0.6) | 2.4 (0.6) | 2.3 (0.5) |
| Self‐reported dizziness, N (%) | 871 (9.5) | 841 (9.5) | 30 (10.1) |
| Alcohol use, N (%) | |||
| Never | 2248 (24.6) | 2162 (24.5) | 86 (28.9) |
| Former | 1510 (16.5) | 1450 (16.4) | 60 (20.1) |
| Current | 5381 (58.9) | 5229 (59.1) | 152 (51.0) |
| Education attainment, N (%) | |||
| Low | 1749 (19.1) | 1652 (18.7) | 97 (32.6) |
| Medium | 3876 (42.4) | 3772 (42.7) | 104 (34.9) |
| High | 3514 (38.5) | 3417 (38.6) | 97 (32.6) |
| Smoking status, N (%) | |||
| Never | 4045 (44.3) | 3921 (44.4) | 124 (41.6) |
| Former | 2945 (32.2) | 2857 (32.3) | 88 (29.5) |
| Current | 2149 (23.5) | 2063 (23.3) | 86 (28.9) |
Data are given as mean (SD) unless otherwise indicated. ACEi indicates angiotensin‐converting enzyme inhibitor; ARB, angiotensin II receptor blocker; HDL, high‐density lipoprotein; LDL, low‐density lipoprotein; OH, orthostatic hypotension.
Incident CVD Events
Participants were followed up for a median time of 26 years. OH versus no OH at baseline was associated with a higher incidence rate of MI (10.7 versus 4.0 per 1000 person‐years), HF (17.0 versus 6.6 per 1000 person‐years), stroke (8.0 versus 3.0 per 1000 person‐years), fatal CHD (5.4 versus 1.2 per 1000 person‐years), any CHD (20.2 versus 7.4 per 1000 person‐years), and mortality (31.9 versus 13.1 per 1000 person‐years). Nearly all OH metrics were associated with long‐term CVD outcomes, with the exception of diastolic OH (not significantly associated with MI or HF) (Table 2). All 5 OH metrics were most strongly associated with fatal CHD. Relationships between change in SBP or DBP and incident MI or HF were generally linear (Figure 1A through 1D). Meanwhile, stroke, fatal CHD, any CHD, or all‐cause mortality were nonlinear, with higher risk of these outcomes at greater decreases in SBP or DBP, but no association with increases in SBP or DBP on standing (Figure 1E through 1L).
Table 2.
Association of OH With Risk of MI, HF, Stroke, Fatal CHD, Any CHD, and All‐Cause Mortality
| Variable | Incident MI | Incident HF | Stroke | Fatal CHD | Incident CHD | All Mortality |
|---|---|---|---|---|---|---|
| OH (present vs absent) | 1.88 (1.44–2.46) | 1.65 (1.34–2.04) | 1.83 (1.35–2.48) | 2.77 (1.93–3.98) | 2.00 (1.64–2.44) | 1.68 (1.45–1.95) |
| Systolic OH (present vs absent) | 1.79 (1.34–2.40) | 1.65 (1.32–2.06) | 1.95 (1.42–2.67) | 2.67 (1.81–3.93) | 1.95 (1.57–2.41) | 1.67 (1.42–1.95) |
| Diastolic OH (present vs absent) | 1.28 (0.76–2.14) | 1.40 (0.96–2.05) | 1.91 (1.13–3.21) | 2.54 (1.41–4.59) | 1.73 (1.23–2.44) | 1.84 (1.45–2.35) |
| Postural change in systolic blood pressure (per −10 mm Hg) | 1.13 (1.06–1.20) | 1.14 (1.08–1.19) | 1.13 (1.05–1.21) | 1.21 (1.10–1.34) | 1.14 (1.08–1.19) | 1.11 (1.08–1.15) |
| Postural change in diastolic blood pressure (per −10 mm Hg) | 1.20 (1.06–1.36) | 1.25 (1.14–1.37) | 1.23 (1.07–1.42) | 1.29 (1.05–1.57) | 1.19 (1.08–1.30) | 1.19 (1.11–1.27) |
Values are given as hazard ratio (95% confidence interval). Adjusted for age, sex, race‐center, estimated glomerular filtration rate, body mass index, resting heart rate, high‐density lipoprotein cholesterol, low‐density lipoprotein cholesterol, triglycerides, total cholesterol, diabetes mellitus status, hypertension status, antihypertensive medication use in the past 2 weeks, self‐reported dizziness, alcohol consumption, education level, leisure index, and smoking status. Participants were followed up through December 31, 2015, for a median of 26 years of follow‐up. CHD indicates coronary heart disease; HF, heart failure; MI, myocardial infarction; OH, orthostatic hypotension.
Figure 1.
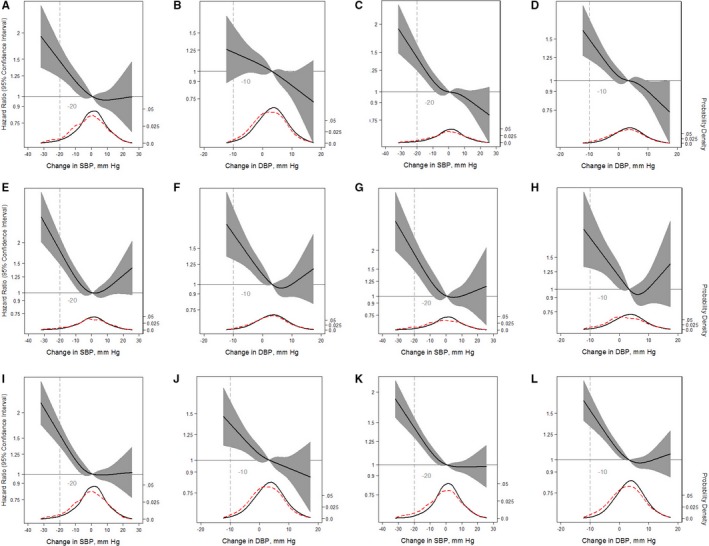
Adjusted restricted cubic splines of the relationship (solid line) between postural change in systolic blood pressure (SBP) or diastolic blood pressure (DBP; per mm Hg) with incident myocardial infarction (A and B), incident congestive heart failure (C and D), incident stroke (E and F), fatal coronary heart disease (G and H), any coronary heart disease (I and J), and mortality from any cause (K and L). Participants were followed up through December 31, 2015. The models were expressed relative to the 50th percentile of postural change in SBP or DBP (0.85 and 3.5 mm Hg, respectively), with 4 knots specified using Harrell's method. All models used Cox proportional hazards models to determine hazard ratios shown on natural log scale and were adjusted for age, sex, race‐center, estimated glomerular filtration rate, body mass index, resting heart rate, high‐density lipoprotein cholesterol, low‐density lipoprotein cholesterol, triglycerides, total cholesterol, diabetes mellitus status, hypertension status, antihypertensive medication use in the past 2 weeks, self‐reported dizziness, alcohol consumption, education level, physical activity, and smoking status. The plot was truncated at the 0.5th and 99.5th percentiles of postural change in SBP or DBP. In addition, overlaid are kernel density plots depicting the distribution of postural change in systolic or diastolic blood pressure by participants who had the outcome of interest (red dash) vs those who did not have the outcome of interest (solid).
Concurrent Subclinical Markers of Atherosclerosis
Mean CIMT was 0.8 mm among those with OH at baseline and 0.7 mm among those without OH at baseline. Similarly, after adjustment for covariates, OH, systolic OH, diastolic OH, postural change in SBP, and postural change in DBP were each significantly associated with higher CIMT (Table 3). The pattern of association was nonlinear, such that the association between postural change in SBP or DPB emerged with decreases greater than ≈0 mm Hg (Figure 2A and 2B).
Table 3.
Association of OH With Carotid Intimal Thickness or Carotid Plaque
| Variable | Carotid Intimal Thickness, mm | Carotid Plaque |
|---|---|---|
| β (95% CI) | OR (95% CI) | |
| OH (present vs absent) | 0.05 (0.04–0.07) | 1.51 (1.18–1.93) |
| Systolic OH (present vs absent) | 0.06 (0.04–0.07) | 1.63 (1.25–2.12) |
| Diastolic OH (present vs absent) | 0.07 (0.04–0.09) | 1.38 (0.89–2.14) |
| Postural change in systolic blood pressure (per −10 mm Hg) | 0.011 (0.008–0.014) | 1.12 (1.07–1.18) |
| Postural change in diastolic blood pressure (per −10 mm Hg) | 0.015 (0.010–0.021) | 1.20 (1.10–1.32) |
Adjusted for age, sex, race‐center, estimated glomerular filtration rate, body mass index, resting heart rate, high‐density lipoprotein cholesterol, low‐density lipoprotein cholesterol, triglycerides, total cholesterol, diabetes mellitus status, hypertension status, antihypertensive medication use in the past 2 weeks, self‐reported dizziness, alcohol consumption, education level, leisure index, and smoking status. CI indicates confidence interval; OH, orthostatic hypotension; OR, odds ratio.
Figure 2.
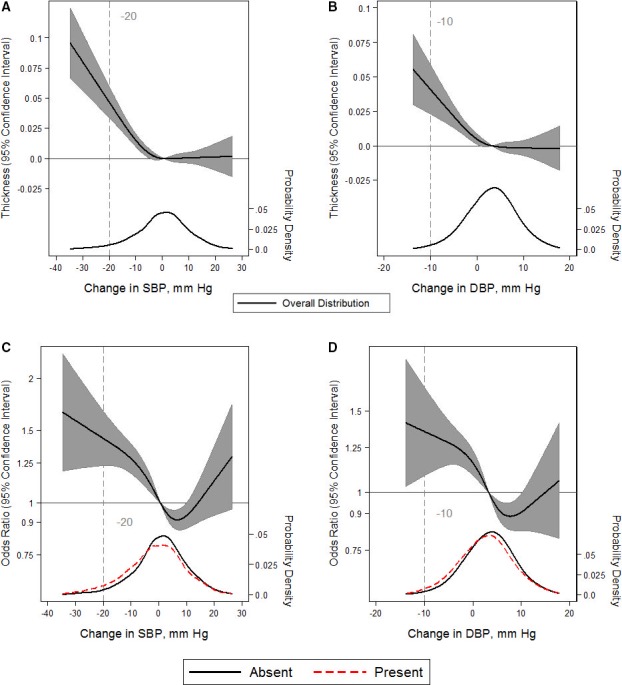
Adjusted restricted cubic splines of the relationship (solid line) between postural change in systolic blood pressure (SBP) or diastolic blood pressure (DBP; per mm Hg) with carotid intimal thickness (measured in mm; A and B) or the presence of carotid plaque (C and D). Gray shade represents 95% confidence intervals. The models were expressed relative to the 50th percentile of postural change in SBP or DBP (0.85 and 3.5 mm Hg, respectively), with 4 knots specified using Harrell's method. Linear regression was used for carotid intimal thickness. Logistic regression was used for the presence of carotid plaque (odds ratios shown on natural log scale). Linear or logistic regression models were adjusted for age, sex, race‐center, estimated glomerular filtration rate, body mass index, resting heart rate, high‐density lipoprotein cholesterol, low‐density lipoprotein cholesterol, triglycerides, total cholesterol, diabetes mellitus status, hypertension status, antihypertensive medication use in the past 2 weeks, self‐reported dizziness, alcohol consumption, education level, physical activity, and smoking status. The plot was truncated at the 0.5th and 99.5th percentiles of postural change in SBP or DBP. In addition, overlaid are kernel density plots depicting the distribution of postural change in SBP or DBP by participants with carotid plaque (red dash) vs those without carotid plaque (solid). Because carotid intimal thickness is a continuous outcome, the kernel density depicts the overall distribution alone (solid).
More participants with OH had carotid plaque at baseline at 51% (151 of 298) versus 32% (2832 of 8841) among those without OH at baseline. OH, systolic OH, postural change in SBP, and postural change in DBP were associated with carotid plaque. Diastolic OH was not associated with carotid plaque (Table 3). Participants with an increase in SBP between 2 and 10 mm Hg or an increase in DBP of 3 to 10 mm Hg had lower odds of carotid plaque, whereas participants with a change in SBP <0 mm Hg or a change in DBP <1 mm Hg had higher odds of carotid plaque (Figure 2C and 2D). Interestingly, there were higher odds of carotid plaque among those with an increase in SBP >10 mm Hg or DBP >10 mm Hg, although these were nonsignificant.
Cardiac Markers
The proportion with detectable hs‐cTnT levels at visit 2 was 51% (152 of 298) among those with OH and 33% (2874 of 8841) among those without OH at baseline. OH (odds ratio [OR], 1.49; 95% confidence interval [CI], 1.16–1.93), systolic OH (OR, 1.68; 95% CI, 1.27–2.21), and postural change in SBP (OR, 1.05; 95% CI, 1.00–1.11) were associated with detectable hs‐cTnT levels, whereas diastolic OH (OR, 1.25; 95% CI, 0.80–1.95) and postural change in DBP (OR, 1.08; 95% CI, 0.98–1.18) were not associated (Table 4). This was reflected in splines, whereby U‐shaped relationships were observed with higher odds of detectable hs‐cTnT at both the lower and upper range of change in SBP or DBP (Figure 3A and 3B).
Table 4.
Association Between OH and Detectable hs‐cTnT or Elevated NT‐proBNP
| Variable | Detectable hs‐cTnT at Visit 2 (≥5 ng/L) | Elevated NT‐proBNP at Visit 2 (≥100 pg/mL) |
|---|---|---|
| OH (present vs absent) | 1.49 (1.16–1.93) | 1.92 (1.48–2.49) |
| Systolic OH (present vs absent) | 1.68 (1.27–2.21) | 1.92 (1.45–2.53) |
| Diastolic OH (present vs absent) | 1.25 (0.80–1.95) | 2.00 (1.26–3.16) |
| Postural change in systolic blood pressure (per −10 mm Hg) | 1.05 (1.00–1.11) | 1.12 (1.06–1.18) |
| Postural change in diastolic blood pressure (per −10 mm Hg) | 1.08 (0.98–1.18) | 1.04 (0.94–1.16) |
Values are given as odds ratio (95% confidence interval). Adjusted for age, sex, race‐center, estimated glomerular filtration rate, body mass index, resting heart rate, high‐density lipoprotein cholesterol, low‐density lipoprotein cholesterol, triglycerides, total cholesterol, diabetes mellitus status, hypertension status, antihypertensive medication use in the past 2 weeks, self‐reported dizziness, alcohol consumption, education level, leisure index, and smoking status. hs‐cTnT, high‐sensitivity troponin T; NT‐proBNP, N‐terminal pro‐B‐type natriuretic peptide; OH, orthostatic hypotension.
Figure 3.
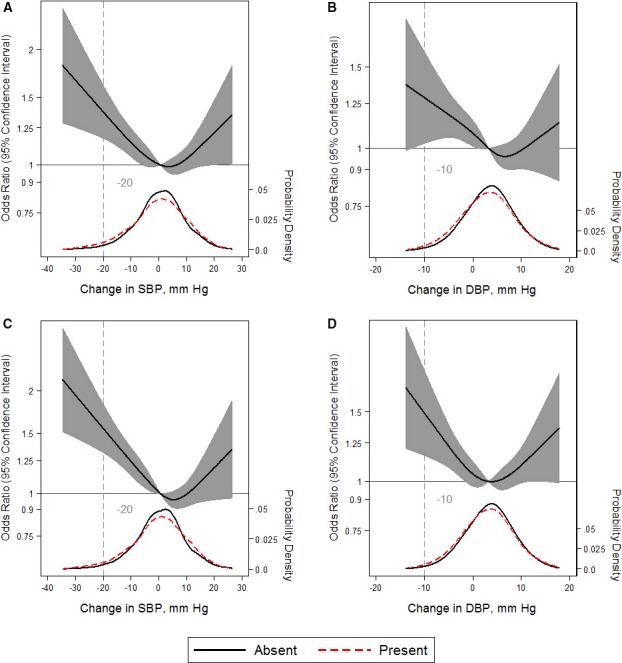
Adjusted restricted cubic splines of the relationship (solid line) between postural change in systolic blood pressure (SBP) or diastolic blood pressure (DBP; per mm Hg) with detectable high‐sensitivity troponin T (hs‐cTNT) ≥5 ng/L (A and B) or elevated NT‐proBNP (N‐terminal pro‐B‐type natriuretic peptide) ≥100 pg/mL (C and D). Gray shade represents 95% confidence intervals. The models were expressed relative to the 50th percentile of postural change in SBP or DBP (0.85 and 3.5 mm Hg, respectively), with 4 knots specified using Harrell's method. All models used logistic regression to determine odds ratios shown on natural log scale and were adjusted for age, sex, race‐center, estimated glomerular filtration rate, body mass index, resting heart rate, high‐density lipoprotein cholesterol, low‐density lipoprotein cholesterol, triglycerides, total cholesterol, diabetes mellitus status, hypertension status, antihypertensive medication use in the past 2 weeks, self‐reported dizziness, alcohol consumption, education level, physical activity, and smoking status. The plot was truncated at the 0.5th and 99.5th percentiles of postural change in SBP or DBP. In addition, overlaid are kernel density plots depicting the distribution of postural change in SBP or DBP by participants with either detectable hs‐cTnT or elevated NT‐proBNP present (red dash) vs absent (solid).
Similarly, the proportion with an elevated NT‐proBNP was 41% (122 of 298) among those with OH versus 21% (1834 of 8841) among those without OH at baseline. In contrast to hs‐cTnT, all OH metrics were associated with an elevated NT‐proBNP, except postural change in DBP (Table 4). Furthermore, continuous changes in SBP or DBP demonstrated U‐shaped relationships, with higher odds of an elevated NT‐proBNP at either extreme (Figure 3C and 3D).
Sensitivity Analyses
Adjusting for resting SBP or DBP (Tables S1 and S2) or carotid plaque (Table S3) or excluding the first standing measurement of SBP and DBP (Tables S4 and S5) did not meaningfully change our findings. Using a more specific definition of OH (both systolic and diastolic criteria) was more strongly associated with cross‐sectional outcomes and biomarkers, but not clinical events (Table S6).
Discussion
In this middle‐aged community‐dwelling population, we found that OH measured within the first 2 minutes of standing was strongly associated with future risk of MI, congestive HF, stroke, and fatal CHD, independent of the CVD risk factors examined in our models. Furthermore, having OH was associated with concurrent CIMT and carotid plaque as well as intermediate‐term markers of subclinical myocardial damage and cardiac wall strain. These findings suggest that OH is strongly associated with both clinical and subclinical CVD, such that its identification in ambulatory middle‐aged adults may warrant further consideration for CVD risk management.
OH as an independent risk factor of CVD has been controversial. Although several observational studies have shown that OH is associated with CVD events12, 13, 14, 15, 16, 17 and mortality,14, 18 others have shown no relationship.7, 8, 9, 10 Along these lines, in a secondary analysis of the ACCORD, Fleg and colleagues11 demonstrated that OH was not associated with CVD events. In addition, they showed that treatment of risk factors associated with both OH and CVD (namely, hyperglycemia and hypertension) had no impact on OH.11 In contrast, our study demonstrates prospective, concurrent, and intermediate‐term relationships between OH and both subclinical and clinical CVD outcomes. Furthermore, there were no major differences in associations between systolic OH and diastolic OH. Some of the diastolic OH levels were attenuated because of the smaller number with diastolic OH, but the direction and magnitude of the associations were similar. Our report meaningfully contributes to the literature on this topic. Although prior reports focus on clinical CVD events, our study further elucidates potential pathways of the association of OH with CVD events by examining both concurrent measures of atherosclerosis and intermediate‐term biomarkers that reflect subclinical CVD injury and strain.
Our observation that OH was associated with CVD is consistent with what is known about the physiological characteristics of BP stabilization after standing in both vascular and cardiac systems. Gravity‐induced pooling of intravascular volume in the lower extremities is detected by arterial baroreceptors (carotid and aortic) and low‐pressure baroreceptors (predominantly in the right atrium). These receptors trigger vasoconstriction and increased heart rate, resulting in BP stabilization with standing.35 Consequently, vascular stiffness (a risk factor for CVD) is associated with reduced responsiveness to shifts in intravascular volume, although this relationship is not necessarily causative.36 Similarly, coronary disease can affect heart rate and stroke volume,37 which are critical for increasing cardiac output when changing posture.38
Although OH may simply represent a marker for underlying CVD, its role as an active causal mediator in the development of CVD is also biologically plausible. OH has been shown to occur well in advance of CVD, even preceding some CVD risk factors, such as hypertension.39 Furthermore, sudden recurrent decreases in BP with standing could contribute to end‐organ damage. Several studies have shown OH to be associated with diseases of end‐organ hypoperfusion, such as stroke40 and peripheral artery disease.13 In our study, the association between OH and detectable hs‐cTnT may indicate microischemia from recurrent hypoperfusion of coronary vessels.29 However, further research is needed to confirm this hypothesis.
Our study provides insights as to the conflicting reports of OH and CVD in the literature. Postural change in BP did not consistently have a linear relationship with the outcomes examined in our study. In relation to carotid plaque, detectable hs‐cTnT, elevated NT‐proBNP, and stroke, postural elevations in BP (orthostatic hypertension) demonstrated U‐shaped relationships, suggesting a higher prevalence of these conditions among those with greater postural increases in BP. As a result, reports that phenotype OH as a dichotomous or linear variable may miss the higher prevalence of CVD with increases in BP on standing and further neglect an important possibility that adults with large increases in BP on standing do not represent a healthy reference group. Future studies of OH and CVD should assess for U‐shaped associations, particularly the higher risk of CVD in those with postural increases in BP on standing.
Another important observation from our splines is that none of the definitions of systolic or diastolic OH reflected thresholds in risk for the outcomes of interest. Rather, the definitions from the consensus definition transected linear portions of all the risk relationship curves. One exception to this was carotid plaque, which seemed to have a threshold in risk at a decrease in SBP of 10 mm Hg or DBP of 5 mm Hg, which was lower than the consensus definition. This suggests that postural change in BP with standing is more accurately interpreted on a continuum rather than a discreet disease state, such that the greater the decrease in standing BP, the higher the risk of CVD. Future research on OH should include continuous characterizations of the relationship between postural change in BP and clinical outcomes.
Our study has many strengths. First, the ARIC Study included a large biracial sample of middle‐aged adults; as a result, our findings are relevant to a community‐based ambulatory population. Second, staff underwent rigorous training to execute the ARIC Study's standardized OH protocol along with other covariates. Third, CVD events represent the primary outcomes of the ARIC Study. As such, long‐term outcomes were monitored closely and adjudicated. The measurement of concurrent and intermediate‐term measures supports these primary associations, elucidating potentially useful pathways of the association between OH and CVD.
Our study also has limitations. First, OH was assessed within the first 2 minutes of standing. It is unclear whether similar associations would be observed with OH identified at or beyond 3 minutes of standing. It has been hypothesized that the temporal manifestation of OH (1 versus 3 minutes) may correspond to different underlying pathophysiological features.41 Second, because of later implementation of the protocol, OH was not assessed in everyone, reducing power. Third, hs‐TnT and NT‐proBNP were not measured at the same time as the OH assessment and, thus, we cannot determine whether they were detectable or elevated at the time of the OH assessment or if these developed afterward. Fourth, we did not have standing heart rate or assessments of symptoms related to standing, which limits our ability to further phenotype OH. Fifth, concurrent symptoms and their severity were not comprehensively assessed. As a result, we do not know who was likely to undergo treatment for OH in this population. However, we anticipate this was a small number. Sixth, we included among our tables, postural change in SBP or DBP as a continuous variable because this may be informative for clinical interpretation of postural change above or below traditional cut points. However, this implies a linear relationship that was not consistently observed with all outcomes. Seventh, although models were adjusted for numerous covariates, residual confounding is always a concern with observational studies.
Our study has important implications. OH in clinical practice is commonly attributed to hypovolemia or neurologic conditions. Even among patients with diabetes mellitus, the higher prevalence of OH among this group is thought to be secondary to diabetic neuropathy,42 and less commonly reflective of subclinical CVD. Our study documents the presence of subclinical CVD in patients with OH. Moreover, the mainstays of OH treatment focus on BP augmentation and stabilization and include increased salt and fluid intake,43 deescalation of antihypertensive medications,44 and mineralocorticoid administration.45, 46 These could have adverse health implications if the cause of OH is CVD. Given the strong and robust relationship between OH and CVD observed in this study, OH identified in ambulatory clinical settings should prompt consideration for latent CVD, especially before initiating OH treatment.
In conclusion, this study shows that OH is strongly associated with clinical CVD events (MI, congestive HF, stroke, and fatal CHD) as well as CIMT, carotid plaque, detectable hs‐cTnT, and elevated NT‐proBNP. Although future work is necessary to establish a causal role for OH in the pathogenesis of CVD, OH identified in adults in the community may warrant consideration of concurrent subclinical CVD. Moreover, future research on OH and CVD should account for the possibility of greater CVD risk among adults with increases in BP on standing.
Sources of Funding
Juraschek is supported by National Institutes of Health (NIH)/National Heart, Lung, and Blood Institute (NHLBI) grant 7K23HL135273‐02. The ARIC (Atherosclerosis Risk in Communities) Study is performed as a collaborative study supported by NHLBI contracts (HHSN268201700001I, HHSN268201700002I, HHSN268201700003I, HHSN268201700005I, HHSN268201700004I). Selvin was supported by NIH/National Institute of Diabetes and Digestive and Kidney Diseases grants K24DK106414 and 2R01DK089174.
Disclosures
Ballantyne reports a provisional patent (patent no. 61721475), entitled “Biomarkers to Improve Prediction of Heart Failure Risk,” filed by Baylor College of Medicine and Roche. The remaining authors have no disclosures to report.
Supporting information
Table S1. The Association of OH With Carotid Intimal Thickness, Carotid Plaque, Detectable High Sensitivity Troponin T, and Elevated NT‐proBNP With Adjustment for Resting Systolic and Diastolic Blood Pressure
Table S2. Association of Orthostatic Hypotension With Risk of Myocardial Infarction (MI), Heart Failure (HF), Stroke, Fatal Coronary Heart Disease (CHD), Any Coronary Heart Disease (CHD), and All‐Cause Mortality With Adjustment for Resting Systolic and Diastolic Blood Pressure
Table S3. Association of Orthostatic Hypotension With Risk of Myocardial Infarction (MI), Heart Failure (HF), Stroke, Fatal Coronary Heart Disease (CHD), Any Coronary Heart Disease (CHD), and All‐Cause Mortality With Adjustment for Baseline Carotid Plaque
Table S4. The Association of Orthostatic Hypotension (Based on Mean Standing Blood Pressure Measurements That Excluded the First Measurement) With Carotid Intimal Thickness, Carotid Plaque, Detectable High Sensitivity Troponin T, and Elevated NT‐proBNP
Table S5. Association of Orthostatic Hypotension (Based on Mean Standing Blood Pressure Measurements That Excluded the First Measurement) With Risk of Myocardial Infarction (MI), Heart Failure (HF), Stroke, Fatal Coronary Heart Disease (CHD), Any Coronary Heart Disease (CHD), and All‐Cause Mortality
Table S6. Association of Severe Orthostatic Hypotension (Based on Having Both Systolic and Diastolic OH) With Primary CVD Outcomes
Acknowledgments
We thank the staff and participants of the ARIC (Atherosclerosis Risk in Communities) Study for their important contributions.
(J Am Heart Assoc. 2018;7:e008884 DOI: 10.1161/JAHA.118.008884.)29735525
References
- 1. Press Y, Punchik B, Freud T. Orthostatic hypotension and drug therapy in patients at an outpatient comprehensive geriatric assessment unit. J Hypertens. 2016;34:351–358. [DOI] [PubMed] [Google Scholar]
- 2. Wu J‐S, Yang Y‐C, Lu F‐H, Wu C‐H, Chang C‐J. Population‐based study on the prevalence and correlates of orthostatic hypotension/hypertension and orthostatic dizziness. Hypertens Res. 2008;31:897–904. [DOI] [PubMed] [Google Scholar]
- 3. Shin C, Abbott RD, Lee H, Kim J, Kimm K. Prevalence and correlates of orthostatic hypotension in middle‐aged men and women in Korea: the Korean Health and Genome Study. J Hum Hypertens. 2004;18:717–723. [DOI] [PubMed] [Google Scholar]
- 4. Wu J‐S, Yang Y‐C, Lu F‐H, Wu C‐H, Wang R‐H, Chang C‐J. Population‐based study on the prevalence and risk factors of orthostatic hypotension in subjects with pre‐diabetes and diabetes. Diabetes Care. 2009;32:69–74. [DOI] [PMC free article] [PubMed] [Google Scholar]
- 5. Juraschek SP, Daya N, Rawlings AM, Appel LJ, Miller ER, Windham BG, Griswold ME, Heiss G, Selvin E. Association of history of dizziness and long‐term adverse outcomes with early vs later orthostatic hypotension assessment times in middle‐aged adults. JAMA Intern Med. 2017;177:1316–1323. [DOI] [PMC free article] [PubMed] [Google Scholar]
- 6. Magnusson M, Holm H, Bachus E, Nilsson P, Leosdottir M, Melander O, Jujic A, Fedorowski A. Orthostatic hypotension and cardiac changes after long‐term follow‐up. Am J Hypertens. 2016;29:847–852. [DOI] [PubMed] [Google Scholar]
- 7. Veronese N, De Rui M, Bolzetta F, Zambon S, Corti MC, Baggio G, Toffanello ED, Maggi S, Crepaldi G, Perissinotto E, Manzato E, Sergi G. Orthostatic changes in blood pressure and mortality in the elderly: the Pro.V.A Study. Am J Hypertens. 2015;28:1248–1256. [DOI] [PubMed] [Google Scholar]
- 8. Hossain M, Ooi WL, Lipsitz LA. Intra‐individual postural blood pressure variability and stroke in elderly nursing home residents. J Clin Epidemiol. 2001;54:488–494. [DOI] [PubMed] [Google Scholar]
- 9. Fedorowski A, Wahlstrand B, Hedner T, Melander O. Systolic and diastolic component of orthostatic hypotension and cardiovascular events in hypertensive patients: the Captopril Prevention Project. J Hypertens. 2014;32:75–81. [DOI] [PubMed] [Google Scholar]
- 10. Chou R‐H, Liu C‐J, Chao T‐F, Chen S‐J, Tuan T‐C, Chen T‐J, Chen S‐A. Association between orthostatic hypotension, mortality, and cardiovascular disease in Asians. Int J Cardiol. 2015;195:40–44. [DOI] [PubMed] [Google Scholar]
- 11. Fleg JL, Evans GW, Margolis KL, Barzilay J, Basile JN, Bigger JT, Cutler JA, Grimm R, Pedley C, Peterson K, Pop‐Busui R, Sperl‐Hillen J, Cushman WC. Orthostatic hypotension in the ACCORD (Action to Control Cardiovascular Risk in Diabetes) blood pressure trial: prevalence, incidence, and prognostic significance. Hypertension. 2016;68:888–895. [DOI] [PMC free article] [PubMed] [Google Scholar]
- 12. Rutan GH, Hermanson B, Bild DE, Kittner SJ, LaBaw F, Tell GS; CHS Collaborative Research Group . Orthostatic hypotension in older adults: the Cardiovascular Health Study. Hypertension. 1992;19:508–519. [DOI] [PubMed] [Google Scholar]
- 13. Fan X‐H, Wang Y, Sun K, Zhang W, Wang H, Wu H, Zhang H, Zhou X, Hui R. Disorders of orthostatic blood pressure response are associated with cardiovascular disease and target organ damage in hypertensive patients. Am J Hypertens. 2010;23:829–837. [DOI] [PubMed] [Google Scholar]
- 14. Verwoert GC, Mattace‐Raso FUS, Hofman A, Heeringa J, Stricker BHC, Breteler MMB, Witteman JCM. Orthostatic hypotension and risk of cardiovascular disease in elderly people: the Rotterdam study. J Am Geriatr Soc. 2008;56:1816–1820. [DOI] [PubMed] [Google Scholar]
- 15. Fedorowski A, Hedblad B, Melander O. Early postural blood pressure response and cause‐specific mortality among middle‐aged adults. Eur J Epidemiol. 2011;26:537–546. [DOI] [PMC free article] [PubMed] [Google Scholar]
- 16. Fedorowski A, Stavenow L, Hedblad B, Berglund G, Nilsson PM, Melander O. Orthostatic hypotension predicts all‐cause mortality and coronary events in middle‐aged individuals (The Malmo Preventive Project). Eur Heart J. 2010;31:85–91. [DOI] [PMC free article] [PubMed] [Google Scholar]
- 17. Rose KM, Tyroler HA, Nardo CJ, Arnett DK, Light KC, Rosamond W, Sharrett AR, Szklo M. Orthostatic hypotension and the incidence of coronary heart disease: the Atherosclerosis Risk in Communities Study. Am J Hypertens. 2000;13:571–578. [DOI] [PubMed] [Google Scholar]
- 18. Rose KM, Eigenbrodt ML, Biga RL, Couper DJ, Light KC, Sharrett AR, Heiss G. Orthostatic hypotension predicts mortality in middle‐aged adults: the Atherosclerosis Risk in Communities (ARIC) Study. Circulation. 2006;114:630–636. [DOI] [PubMed] [Google Scholar]
- 19. The ARIC Investigators . The Atherosclerosis Risk in Communities (ARIC) Study: design and objectives. Am J Epidemiol. 1989;129:687–702. [PubMed] [Google Scholar]
- 20. Jackson R, Chambless LE, Yang K, Byrne T, Watson R, Folsom A, Shahar E, Kalsbeek W; The Atherosclerosis Risk in Communities (ARIC) Study Investigators . Differences between respondents and nonrespondents in a multicenter community‐based study vary by gender ethnicity. J Clin Epidemiol. 1996;49:1441–1446. [DOI] [PubMed] [Google Scholar]
- 21. White AD, Folsom AR, Chambless LE, Sharret AR, Yang K, Conwill D, Higgins M, Williams OD, Tyroler HA. Community surveillance of coronary heart disease in the Atherosclerosis Risk in Communities (ARIC) Study: methods and initial two years’ experience. J Clin Epidemiol. 1996;49:223–233. [DOI] [PubMed] [Google Scholar]
- 22. Eriksson H, Caidahl K, Larsson B, Ohlson LO, Welin L, Wilhelmsen L, Svärdsudd K. Cardiac and pulmonary causes of dyspnoea: validation of a scoring test for clinical‐epidemiological use: the Study of Men Born in 1913. Eur Heart J. 1987;8:1007–1014. [DOI] [PubMed] [Google Scholar]
- 23. Mundt KA, Chambless LE, Burnham CB, Heiss G. Measuring ankle systolic blood pressure: validation of the Dinamap 1846 SX. Angiology. 1992;43:555–566. [DOI] [PubMed] [Google Scholar]
- 24. The National Heart, Lung, and Blood Institute . ARIC manual 11: sitting blood pressure. http://www.cscc.unc.edu/aric/visit/?. Accessed April 4, 2016.
- 25. Freeman R, Wieling W, Axelrod FB, Benditt DG, Benarroch E, Biaggioni I, Cheshire WP, Chelimsky T, Cortelli P, Gibbons CH, Goldstein DS, Hainsworth R, Hilz MJ, Jacob G, Kaufmann H, Jordan J, Lipsitz LA, Levine BD, Low PA, Mathias C, Raj SR, Robertson D, Sandroni P, Schatz I, Schondorff R, Stewart JM, van Dijk JG. Consensus statement on the definition of orthostatic hypotension, neurally mediated syncope and the postural tachycardia syndrome. Clin Auton Res. 2011;21:69–72. [DOI] [PubMed] [Google Scholar]
- 26. The Consensus Committee of the American Autonomic Society and the American Academy of Neurology. Consensus statement on the definition of orthostatic hypotension, pure autonomic failure, and multiple system atrophy. Neurology. 1996;46:1470. [DOI] [PubMed] [Google Scholar]
- 27. Chambless LE, Heiss G, Folsom AR, Rosamond W, Szklo M, Sharrett AR, Clegg LX. Association of coronary heart disease incidence with carotid arterial wall thickness and major risk factors: the Atherosclerosis Risk in Communities (ARIC) Study, 1987–1993. Am J Epidemiol. 1997;146:483–494. [DOI] [PubMed] [Google Scholar]
- 28. Liang M, McEvoy JW, Chen Y, Sharrett AR, Selvin E. Association of a biomarker of glucose peaks, 1,5‐anhydroglucitol, with subclinical cardiovascular disease. Diabetes Care. 2016;39:1752–1759. [DOI] [PMC free article] [PubMed] [Google Scholar]
- 29. McEvoy JW, Chen Y, Rawlings A, Hoogeveen RC, Ballantyne CM, Blumenthal RS, Coresh J, Selvin E. Diastolic blood pressure, subclinical myocardial damage, and cardiac events: implications for blood pressure control. J Am Coll Cardiol. 2016;68:1713–1722. [DOI] [PMC free article] [PubMed] [Google Scholar]
- 30. Ndumele CE, Matsushita K, Sang Y, Lazo M, Agarwal SK, Nambi V, Deswal A, Blumenthal RS, Ballantyne CM, Coresh J, Selvin E. N‐terminal pro‐brain natriuretic peptide and heart failure risk among individuals with and without obesity: the Atherosclerosis Risk in Communities (ARIC) Study. Circulation. 2016;133:631–638. [DOI] [PMC free article] [PubMed] [Google Scholar]
- 31. Juraschek SP, Daya N, Appel LJ, Miller ER, Windham BG, Pompeii L, Griswold ME, Kucharska‐Newton A, Selvin E. Orthostatic hypotension in middle‐age and risk of falls. Am J Hypertens. 2017;30:188–195. [DOI] [PMC free article] [PubMed] [Google Scholar]
- 32. Richardson MT, Ainsworth BE, Wu HC, Jacobs DR, Leon AS. Ability of the Atherosclerosis Risk in Communities (ARIC)/Baecke Questionnaire to assess leisure‐time physical activity. Int J Epidemiol. 1995;24:685–693. [DOI] [PubMed] [Google Scholar]
- 33. Levey AS, Stevens LA, Schmid CH, Zhang YL, Castro AF, Feldman HI, Kusek JW, Eggers P, Van Lente F, Greene T, Coresh J; CKD‐EPI (Chronic Kidney Disease Epidemiology Collaboration) . A new equation to estimate glomerular filtration rate. Ann Intern Med. 2009;150:604–612. [DOI] [PMC free article] [PubMed] [Google Scholar]
- 34. Harrell FE, Lee KL, Pollock BG. Regression models in clinical studies: determining relationships between predictors and response. J Natl Cancer Inst. 1988;80:1198–1202. [DOI] [PubMed] [Google Scholar]
- 35. Ricci F, De Caterina R, Fedorowski A. Orthostatic hypotension: epidemiology, prognosis, and treatment. J Am Coll Cardiol. 2015;66:848–860. [DOI] [PubMed] [Google Scholar]
- 36. Torjesen A, Cooper LL, Rong J, Larson MG, Hamburg NM, Levy D, Benjamin EJ, Vasan RS, Mitchell GF. Relations of arterial stiffness with postural change in mean arterial pressure in middle‐aged adults: the Framingham Heart Study. Hypertension. 2017;69:685–690. [DOI] [PMC free article] [PubMed] [Google Scholar]
- 37. Iskandrian AS, Hakki AH, Newman D. The relation between myocardial ischemia and the ejection fraction response to exercise in patients with normal or abnormal resting left ventricular function. Am Heart J. 1985;109:1253–1258. [DOI] [PubMed] [Google Scholar]
- 38. Rodeheffer RJ, Gerstenblith G, Beard E, Fleg JL, Becker LC, Weisfeldt ML, Lakatta EG. Postural changes in cardiac volumes in men in relation to adult age. Exp Gerontol. 1986;21:367–378. [DOI] [PubMed] [Google Scholar]
- 39. Rose KM, Holme I, Light KC, Sharrett AR, Tyroler HA, Heiss G. Association between the blood pressure response to a change in posture and the 6‐year incidence of hypertension: prospective findings from the ARIC study. J Hum Hypertens. 2002;16:771–777. [DOI] [PubMed] [Google Scholar]
- 40. Eigenbrodt ML, Rose KM, Couper DJ, Arnett DK, Smith R, Jones D. Orthostatic hypotension as a risk factor for stroke: the Atherosclerosis Risk in Communities (ARIC) Study, 1987–1996. Stroke. 2000;31:2307–2313. [DOI] [PubMed] [Google Scholar]
- 41. Singer W, Low PA. Early orthostatic hypotension and orthostatic intolerance: more than an observation or annoyance. JAMA Intern Med. 2017;177:1324–1325. [DOI] [PubMed] [Google Scholar]
- 42. van Hateren KJJ, Kleefstra N, Blanker MH, Ubink‐Veltmaat LJ, Groenier KH, Houweling ST, Kamper AM, van der Meer K, Bilo HJG. Orthostatic hypotension, diabetes, and falling in older patients: a cross‐sectional study. Br J Gen Pract. 2012;62:e696–e702. [DOI] [PMC free article] [PubMed] [Google Scholar]
- 43. Shannon JR, Diedrich A, Biaggioni I, Tank J, Robertson RM, Robertson D, Jordan J. Water drinking as a treatment for orthostatic syndromes. Am J Med. 2002;112:355–360. [DOI] [PubMed] [Google Scholar]
- 44. de Jong MR, Van der Elst M, Hartholt KA. Drug‐related falls in older patients: implicated drugs, consequences, and possible prevention strategies. Ther Adv Drug Saf. 2013;4:147–154. [DOI] [PMC free article] [PubMed] [Google Scholar]
- 45. Campbell IW, Ewing DJ, Clarke BF. 9‐Alpha‐fluorohydrocortisone in the treatment of postural hypotension in diabetic autonomic neuropathy. Diabetes. 1975;24:381–384. [DOI] [PubMed] [Google Scholar]
- 46. Low PA, Gilden JL, Freeman R, Sheng KN, McElligott MA;; Midodrine Study Group . Efficacy of midodrine vs placebo in neurogenic orthostatic hypotension: a randomized, double‐blind multicenter study. JAMA. 1997;277:1046–1051. [PubMed] [Google Scholar]
Associated Data
This section collects any data citations, data availability statements, or supplementary materials included in this article.
Supplementary Materials
Table S1. The Association of OH With Carotid Intimal Thickness, Carotid Plaque, Detectable High Sensitivity Troponin T, and Elevated NT‐proBNP With Adjustment for Resting Systolic and Diastolic Blood Pressure
Table S2. Association of Orthostatic Hypotension With Risk of Myocardial Infarction (MI), Heart Failure (HF), Stroke, Fatal Coronary Heart Disease (CHD), Any Coronary Heart Disease (CHD), and All‐Cause Mortality With Adjustment for Resting Systolic and Diastolic Blood Pressure
Table S3. Association of Orthostatic Hypotension With Risk of Myocardial Infarction (MI), Heart Failure (HF), Stroke, Fatal Coronary Heart Disease (CHD), Any Coronary Heart Disease (CHD), and All‐Cause Mortality With Adjustment for Baseline Carotid Plaque
Table S4. The Association of Orthostatic Hypotension (Based on Mean Standing Blood Pressure Measurements That Excluded the First Measurement) With Carotid Intimal Thickness, Carotid Plaque, Detectable High Sensitivity Troponin T, and Elevated NT‐proBNP
Table S5. Association of Orthostatic Hypotension (Based on Mean Standing Blood Pressure Measurements That Excluded the First Measurement) With Risk of Myocardial Infarction (MI), Heart Failure (HF), Stroke, Fatal Coronary Heart Disease (CHD), Any Coronary Heart Disease (CHD), and All‐Cause Mortality
Table S6. Association of Severe Orthostatic Hypotension (Based on Having Both Systolic and Diastolic OH) With Primary CVD Outcomes