

Abstract
Background
Data on the temporal trends in ideal cardiovascular health (CVH) as well as on their association with subclinical/overt cardiovascular disease (CVD) and death are limited.
Methods and Results
This study included 3460 participants attending ≥1 of 4 consecutive exams of the Framingham Heart Study (1991–2008, mean age 55.4 years, CVH score ranged 0–14). We created 4 groups describing changes in CVH score between examination cycles 5 and 8, using first and last exams attended (high‐high: starting CVH score ≥8, last score of ≥8, referent; high‐low: ≥8 start and ≤7 last; low‐high: ≤7 start and ≥8 last; and low‐low: ≤7 start and ≤7 last) and related them to subclinical CVD cross‐sectionally, and incident CVD and death. Fewer people have ideal CVH scores over the past 20 years (8.5% for 1991–1995, 5.9% for 2005–2008, P=0.002), because of decreases in those with ideal status of body mass index, blood glucose, and serum cholesterol levels (P<0.05 for all). The odds of subclinical disease and risk of CVD and death were higher for all compared with the high‐high group (428 CVD and 367 death events, median follow‐up 5.1 years, hazard ratios for CVD: 1.39, 1.73, 1.9 and death: 1.12, 1.57, 1.4 and odds ratios for subclinical disease: 1.61, 1.98, 2.86 for high‐low, low‐high, and low‐low, respectively).
Conclusions
The decreased presence of ideal CVH scores over the past 20 years resulted in increasing odds of subclinical disease and risk of CVD and death, emphasizing the importance of maintaining ideal CVH over the life course.
Keywords: American Heart Association, cardiovascular disease, ideal cardiovascular health, subclinical disease
Subject Categories: Cardiovascular Disease, Epidemiology, Lifestyle, Risk Factors
Clinical Perspective
What Is New?
The decrease in the percentage of people with ideal cardiovascular health over the past 20 years, mostly because of decreases in the proportion of those with an ideal body mass index, blood pressure, blood glucose and serum cholesterol levels, was associated with higher odds of subclinical disease and risk of overt cardiovascular disease and all‐cause mortality.
What Are the Clinical Implications?
Acquiring and maintaining a healthy lifestyle early in adulthood may reduce the incidence of cardiovascular disease and decrease rates of cardiovascular disease morbidity and mortality which are related to high financial costs, therefore attention should be placed on public health policies and community‐based efforts targeting smoking cessation, weight control, and promoting healthier diets as cost‐effective strategies for promoting cardiovascular health, along with screening and controlling high levels of blood pressure, glucose, and lipids.
The ideal cardiovascular health (CVH), as defined by the American Heart Association, has been associated with lower rates of subclinical disease cross‐sectionally, and with incident cardiovascular disease (CVD) prospectively.1, 2, 3, 4, 5 Investigators have also assessed the short‐term trends in the individual components defining the CVH, but data on the temporal trends in the ideal CVH over longer periods of follow‐up are limited. More specifically, in a study by Lee et al, it was reported that fewer Korean participants followed a healthy diet and had ideal glucose and cholesterol levels during the 5‐year study period (2005–2010), while more participants had ideal physical activity and blood pressure levels.6 Furthermore, the proportion of smokers and those with ideal body mass index remained the same. This study used a limited follow‐up period, mentioning that a long‐term study is needed to confirm these findings. Olsen et al7 reported an increase in the ideal CVH among Danish participants during a period of ≈30 years (1978–2006); however, the focus of that investigation was on the impact of education level on this trend. Additionally, Aatola et al reported on the inverse association between the change in ideal CVH and pulse wave velocity.8
The long‐time effort of physicians and healthcare organizations to emphasize a healthy lifestyle to avoid development of disease have led to declines in CVD mortality, but CVD still remains the top cause of death among Americans. Additionally, CVD remains a financial burden to the US population, given the concomitant hospitalizations and medical and surgical management of CVD, and associated costs. Therefore, prevention of CVD is of public health importance and primordial prevention may be of fundamental importance to offset the burden posed by CVD. Given the strong link between CVH score and incidence of CVD, it is important to evaluate temporal trends in ideal CVH in a representative sample of the US population and to relate such trends to the incidence of CVD and all‐cause mortality.
We hypothesized that the ideal cardiovascular health of Americans has decreased over the past 20 years, in part because of the increasing rates of obesity, and that people maintaining an ideal CVH during this time period will have lower rates of subclinical and clinical CVD, as well as all‐cause mortality, relative to individuals in whom the CVH score deteriorated. We tested these hypotheses using a large community‐based sample from the Framingham Heart Study.
Methods
The data, analytical methods, and study materials will not be made available to other researchers for purposes of reproducing the results or replicating the procedure.
Study Sample
The sampling methods and the study design of the Framingham Heart Study have been described elsewhere.9 For the present investigation, Framingham Offspring cohort participants attending at least one of examination cycles 5 (1991–1995), 6 (1995–1998), 7 (1998–2001), or 8 (2005–2008) were eligible. Routine assessment of subclinical disease measures were performed during the sixth (1995–1998) and the eighth examination (2005–2008) cycles. Of 4139 participants (13 891 person‐exams) attending at least one examination during the period 1991–2008, people were excluded for the following reasons: prevalent CVD (1783 person‐exams), serum creatinine levels ≥2 mg/dL (31 person‐exams), BMI <18.5 kg/m2 (91 person‐exams), missing CVH score components (2672 person‐exams), and outlier values for unusually high lipid values (2 person‐exams). The remaining 9312 person‐exams comprised our base sample of 3460 unique participants (Sample 1, Figure S1), which was used to evaluate the trend in CVH score across the 20‐year period. To relate the 4 CVH groups to the presence of subclinical disease, we took the base sample of 3460 participants and excluded participants who had attended only one exam (n=655, Sample 2, Figure S1) and participants missing a last subclinical disease exam at either exam 6 or exam 8 (n=795), resulting in a sample of 2010 (Sample 3, Figure S1) participants. To evaluate the association of the 4 CVH score groups with incidence of CVD and all‐cause mortality, we excluded participants who had attended only one examination (n=655, Sample 2, Figure S1) and others for lack of follow‐up time from the time of their last examination (n=31), resulting in a sample of 2774 (Sample 4, Figure S1) participants for this component of our investigation. We had low loss‐to‐follow‐up for this investigation (≈10%), which is consistent with the high attendance of participants of the Framingham Heart Study.
American Heart Association Cardiovascular Health Score
For each participant‐examination, a cardiovascular health score was created by recoding the 7 metrics (body mass index, smoking status, physical activity, diet, fasting blood glucose concentrations, blood pressure, blood total cholesterol levels, Table S1) as variables with 3 levels, with a score of 2 indicating the ideal status for each metric, a score of 1 indicating the intermediate status, and a score of 0 indicating poor status; thus the CVH score ranged from a minimum of 0 (indicating extremely poor cardiovascular health) to a maximum of 14 (reflecting ideal cardiovascular health). Body mass index, fasting blood glucose, resting blood pressure, serum cholesterol, and self‐reported smoking status were obtained during each examination at the Framingham Heart Study clinic. Quality of diet was assessed using the food frequency questionnaire administered at the time of examination, with ≥2 healthy components indicating ideal diet quality and 1, 0 components indicating intermediate diet quality and poor diet quality, respectively. Physical activity at exams 5, 7, and 8 was measured using a questionnaire‐based physical activity index, while physical activity at exam 6 was assessed using the Paffenberger Questionnaire. A value in the upper quartile, third quartile, and lowest 2 quartiles indicated ideal, intermediate, and poor physical activity levels, respectively (Table S1).
Subclinical Disease Measurements
At the sixth and eighth examination cycles, attendees underwent testing for several subclinical disease measures (Table S2). A 12‐lead standard resting ECG was obtained on all participants, and we used the sex‐specific Cornell voltage criteria to evaluate electrocardiographic left ventricular hypertrophy. Two‐dimensional standardized transthoracic echocardiography was performed on all study participants. All echocardiograms were read carefully by a sonographer or a cardiologist experienced in echocardiography; both were masked to any clinical information. The reproducibility of echocardiographic measurements was excellent.10 Left ventricular (LV) internal dimensions and thicknesses of the LV posterior wall at end‐diastole as well as the inter‐ventricular septum were estimated using an average of ≥3 cardiac cycles, which were measured with a digital M‐mode (according to the American Society of Echocardiography [ASE] guidelines). LV internal dimensions at end‐systole and end‐diastole were used to calculate fractional shortening. LV ejection fraction (LVEF) was estimated by visually assessing the LV systolic function in multiple views, and was categorized as diminished (LVEF <0.50) or normal (LVEF ≥0.50). Carotid ultrasonography was performed using a standard protocol.11, 12 We measured carotid intima‐media thickness (IMT) using gated diastolic images of the right and left carotid arteries at the level of the proximal 2 cm of the internal carotid artery, the distal common carotid artery, and the carotid artery bulb. Ankle‐brachial systolic blood pressure values were obtained with an 8‐MHz Doppler pen probe as well as an ultrasonic Doppler flow detector (Parks Medical Electronics, Aloha, OR) using a standardized testing protocol, as previously described. Microalbuminuria was detected using an immuno‐turbidometric assay (Tina‐Quant Albumin Assay; Roche Diagnostics) and we further indexed it (using a modified Jaffe method) to urinary creatinine to estimate the urine albumin‐to‐creatinine ratio within a spot urine sample. Coronary artery calcification (CAC) was not included in the definition of subclinical disease because of the non‐availability of CAC measurements at the sixth examination cycle of the Framingham Offspring cohort.
Presence of subclinical disease was defined using a score consisting of at least one of the following: increased carotid intima media thickness or stenosis; left ventricular hypertrophy (by ECG or echocardiography) or systolic dysfunction (by echocardiography); reduced ankle‐brachial index; and microalbuminuria (Table S2).11, 12 The subclinical disease score ranged from a minimum of 0 (indicative of absence of subclinical disease) to a maximum of 5 (indicating presence of subclinical disease with evidence from all 5 listed criteria).
Outcome Events
The outcomes of interest were incidence of a first CVD event and all‐cause mortality during follow‐up from the last examination attended. CVD events included stroke or transient ischemic attack, coronary heart disease (myocardial infarction, coronary insufficiency, and angina pectoris), intermittent claudication, or heart failure.13 All events for Framingham Heart Study participants are adjudicated periodically by a panel of 3 physicians who evaluate all medical and hospital records.
Statistical Analysis
Descriptive statistics for sample characteristics were assessed at the first examination cycle attended by participants between 1991 and 2008. Out of 3460 participants (Sample 1), 2826 had their first exam at the fifth examination cycle, 344 at the sixth examination cycle, 193 at the seventh examination cycle, and 97 at the eighth examination cycle. We also calculated the prevalence of the CVH score and its components at each exam over the 20‐year period and plotted the CVH score across exams by sex to assess any sex‐specific trend of the CVH score over time. Furthermore, we plotted percentages of each of the 3 levels (ideal, intermediate, and poor) across exams for each component comprising the CVH score to visualize trends for each component over time. We used age‐ and sex‐adjusted chi‐squared tests accounting for repeated observations to assess for changes in ideal categorizations comparing exam 5 to exam 8. Additionally, we created 4 groups describing changes in CVH score between exams 5 and 8 using each participant's first and last CVH scores, based on the examination cycles they attended (high‐high: those with starting CVH score ≥8 and last score of ≥8, referent; high‐low: ≥8 start and ≤7 last; low‐high: ≤7 start and ≥8 last; and low‐low: ≤7 start and ≤7 last; Table S3). We used the value 8 as a cut‐off because this was both the mean and median value of the CVH score.
Using Sample 3, we related the CVH score groups to presence of subclinical disease at examination cycle 6 or 8 (presence of subclinical disease was defined by a subclinical disease score ≥1 versus no subclinical disease) depending on which was the latest exam attended, using logistic regression models, adjusted for age and sex; the high‐high group was considered the referent group.
Using Sample 4, we related the CVH score groups to CVD incidence and all‐cause mortality, respectively, using Cox proportional hazards regression models, adjusted for age and sex, after confirming that the assumption of proportional hazards was met. In sensitivity analyses, we further adjusted all models for education level and income.
All study participants provided written informed consent and the Boston University Medical Center Institutional Review Board approved all protocols for this investigation.
Results
The characteristics of our study sample are displayed in Table 1. Our sample was comprised of middle‐aged individuals with a body mass index in the overweight range and a high proportion of hypertension at their baseline examination. The mean CVH score (definition for components shown in Table S1) at baseline was slightly higher in women as compared with men (P<0.001). Overall, those with ideal CVH scores (12–14 points) decreased from 8.5% (examination 5, 1991–1995) to 5.9% (examination 8, 2005–2008, P<0.0001 for comparison, Table 2, Figure 1). The proportion of participants with ideal status of body mass index, blood pressure, glucose, and cholesterol levels has decreased during the past 20 years (1991–2008), with the highest decrease observed in those with ideal glucose levels (Table 2, Figure 2). The cutoff for the ideal category of physical activity increased from 36.9 at exam 5 to 38.0 at exam 8. Furthermore, participants who maintained their high CVH score throughout the study period had lower odds of subclinical disease (definition of components of subclinical disease shown in Table S2) compared with those whose CVH scores decreased (Table 3, Tables S3 and S4). Notably, people who were classified in the “low” CVH group at the beginning of the study and in the “high” CVH group at the end had almost twice the odds of having subclinical disease as compared with those who started and ended the study period being classified in the “high” group. The latter indicates that maintaining a low CVH score for a long period of time significantly impacts the risk of subclinical disease, such that people who improve their CVH score may not be able to easily reverse that risk. In our prospective analysis, evaluating the association between changes in groupings and incidence of CVD, we observed 428 CVD events (195 in women, Table S5) with a median of 5.1 years of follow‐up (range 0.1–17.5 years). People who started and maintained a high CVH score throughout the study period had lower risk of incident CVD compared with all other groups (Table 3, Figure 3A). Finally, those who started with a “low” CVH score, regardless of whether they increased their score or not throughout the study period, had higher rates of all‐cause mortality as compared with those who started and maintained a high CVH score throughout the study (Table 3, Figure 3B). When further adjusting for education level and income, neither education level nor income were found to be significantly associated with risk of CVD in the prospective analyses.
Table 1.
Clinical Characteristics of Study Participants at First Exam Attended
| Characteristics | Women (n=1892) | Men (n=1568) |
|---|---|---|
| Age, y | 55.4±9.9 | 55.3±9.8 |
| Body mass index, kg/m2 | 26.9±5.6 | 28.2±4.2 |
| Systolic blood pressure, mm Hg | 124±20 | 129±17 |
| Diastolic blood pressure, mm Hg | 73±10 | 77±10 |
| Hypertensive, % | 30.9 | 36.5 |
| Antihypertensive medication, % | 17.3 | 18.9 |
| Total cholesterol | 207±38 | 201±35 |
| High density lipoprotein cholesterol | 57±16 | 44±12 |
| Lipid lowering medication, % | 6.7 | 7.8 |
| Fasting blood glucose, mg/dL | 97.3±23.9 | 103.3±27.5 |
| Diabetes mellitus, % | 4.9 | 8.0 |
| Diabetes mellitus medication, % | 2.1 | 3.8 |
| Smokers, % | 18.1 | 18.1 |
| Physical activity score, % | ||
| Ideal | 18.9 | 31.9 |
| Intermediate | 24.7 | 26.5 |
| Poor | 56.4 | 41.6 |
| Diet score | 1.7±0.9 | 1.4±0.9 |
| CVH score | 8.7±2.3 | 8.1±2.1 |
| CVH score, % | ||
| 0 points | 0.0 | 0.0 |
| 1 point | 0.0 | 0.1 |
| 2 points | 0.2 | 0.2 |
| 3 points | 1.2 | 1.0 |
| 4 points | 2.5 | 2.9 |
| 5 points | 5.3 | 6.5 |
| 6 points | 8.5 | 11.4 |
| 7 points | 13.3 | 15.7 |
| 8 points | 14.8 | 21.1 |
| 9 points | 16.8 | 16.9 |
| 10 points | 15.4 | 12.2 |
| 11 points | 10.4 | 6.8 |
| 12 points | 7.5 | 3.7 |
| 13 points | 3.4 | 1.4 |
| 14 points | 0.7 | 0.1 |
Values represent mean±SD, unless otherwise specified. More details on the definition of the components of the CVH score (diet, physical activity, etc) are provided in Table S1. CVH indicates cardiovascular health.
Table 2.
Prevalence of CVH Score and Its Components Over a 20‐Year Period
| Exam 5 (1991–1995, n=2826) | Exam 6 (1995–1998, n=2068) | Exam 7 (1998–2001, n=2339) | Exam 8 (2005–2008, n=2079) | P Valuea | |
|---|---|---|---|---|---|
| CVH score, mean±SD | 8.5±2.2 | 8.2±2.2 | 8.2±2.2 | 8.1±2.1 | <0.001 |
| CVH score, % | |||||
| 0 points | 0.0 | 0.0 | 0.0 | 0.0 | |
| 1 point | 0.1 | 0.0 | 0.0 | 0.0 | |
| 2 points | 0.3 | 0.1 | 0.3 | 0.1 | |
| 3 points | 1.0 | 1.0 | 1.0 | 0.4 | |
| 4 points | 2.6 | 4.0 | 2.4 | 3.2 | |
| 5 points | 5.7 | 6.7 | 6.7 | 6.8 | |
| 6 points | 8.8 | 10.9 | 11.6 | 11.2 | |
| 7 points | 14.1 | 15.1 | 16.3 | 17.7 | 0.002 |
| 8 points | 17.7 | 16.9 | 17.4 | 18.2 | |
| 9 points | 17.2 | 14.7 | 15.4 | 16.2 | |
| 10 points | 14.6 | 13.6 | 13.0 | 12.7 | |
| 11 points | 9.4 | 9.4 | 9.2 | 7.6 | |
| 12 points | 5.7 | 5.5 | 4.6 | 4.6 | |
| 13 points | 2.5 | 1.8 | 1.9 | 1.2 | |
| 14 points | 0.3 | 0.3 | 0.2 | 0.1 | |
| Individual componentsb, % in categories | |||||
| Body mass index | |||||
| Ideal | 35.2 | 31.6 | 29.3 | 29.6 | 0.039 |
| Intermediate | 41.1 | 41.8 | 41.9 | 41.1 | |
| Poor | 23.7 | 26.6 | 28.8 | 29.3 | |
| Blood pressure | |||||
| Ideal | 35.7 | 30.3 | 30.4 | 21.6 | 0.075 |
| Intermediate | 41.9 | 45.7 | 46.4 | 53.9 | |
| Poor | 22.4 | 24.0 | 23.2 | 24.5 | |
| Blood glucose | |||||
| Ideal | 68.2 | 61.3 | 57.1 | 47.0 | <0.001 |
| Intermediate | 26.2 | 32.4 | 35.4 | 44.7 | |
| Poor | 5.6 | 6.3 | 7.5 | 8.3 | |
| Serum cholesterol | |||||
| Ideal | 44.6 | 40.8 | 38.2 | 30.5 | 0.003 |
| Intermediate | 39.6 | 40.6 | 46.8 | 61.3 | |
| Poor | 15.8 | 18.6 | 15.0 | 8.2 | |
| Smoking history | |||||
| Ideal | 32.7 | 34.3 | 34.0 | 36.3 | <0.001 |
| Intermediate | 49.2 | 53.1 | 54.3 | 55.4 | |
| Poor | 18.1 | 11.6 | 11.7 | 8.3 | |
| Diet | |||||
| Ideal | 50.7 | 50.4 | 54.6 | 57.7 | 0.168 |
| Intermediate | 37.9 | 38.0 | 35.2 | 35.3 | |
| Poor | 11.4 | 11.6 | 10.2 | 7.0 | |
CVH indicates cardiovascular health; PAI, physical activity index.
For CVH score means, P‐value reflects age‐ and sex‐adjusted difference in means between exam 5 and exam 8. All other P‐values reflect age‐ and sex‐adjusted difference in prevalence of ideal score between exam 5 and exam 8.
Physical activity index (PAI) not shown since authors defined ideal as PAI >75th percentile, intermediate as 50th< PAI ≤75th percentile, and poor as PAI ≤50th percentile. (PAI=physical activity index).
Figure 1.
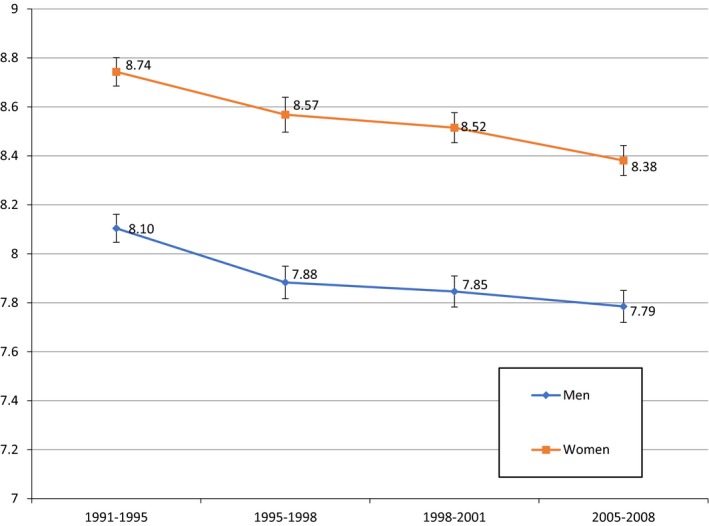
Sex‐specific and age‐adjusted trend of CVH score across exams. CVH indicates cardiovascular health. All numbers are percentages for Y axis.
Figure 2.
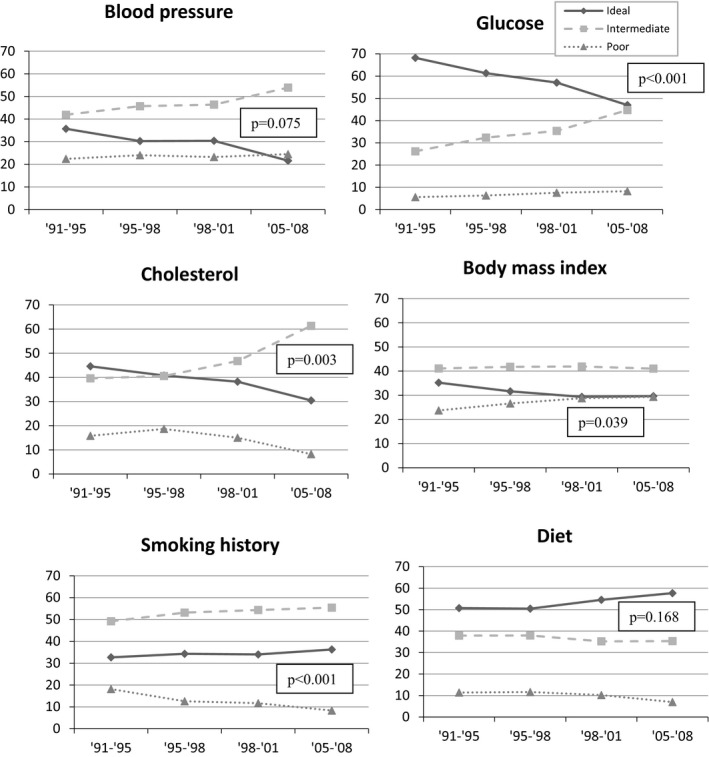
Trends of each component* defining the CVH score across exams. *Physical activity is not presented because of how ideal, intermediate, and poor physical activity was defined. Y‐axis represents percentage at exam. P values are from age‐ and sex‐adjusted chi‐squared tests comparing ideal status in period 1991–1995 to ideal status in period 2005–2008. CVH indicates cardiovascular health.
Table 3.
Age‐, and Sex‐Adjusted Associations Between Groupings of Change in the CVH Score and Presence of Subclinical Disease, Incidence of CVD, and Mortality
| Presence of Subclinical Diseasea | No. Events/No. At‐Risk | OR (95% CI) | P Value |
|---|---|---|---|
| CVH score groups | |||
| High‐high | 351/1046 | Referent | ··· |
| High‐low | 179/401 | 1.60 (1.25–2.05) | <0.001 |
| Low‐high | 89/170 | 1.98 (1.41–2.79) | <0.0001 |
| Low‐low | 242/393 | 2.86 (2.22–3.68) | <0.0001 |
| CVD Incidenceb | No. Events/No. At‐Risk | HR (95% CI) | P Value |
|---|---|---|---|
| CVH score groups | |||
| High‐high | 148/1354 | Referent | ··· |
| High‐low | 84/544 | 1.39 (1.06–1.81) | 0.02 |
| Low‐high | 51/253 | 1.73 (1.26–2.38) | <0.001 |
| Low‐low | 145/623 | 1.90 (1.51–2.39) | <0.0001 |
| Mortalityb | No. Events/No. At‐risk | HR (95% CI) | P Value |
|---|---|---|---|
| CVH score groups | |||
| High‐high | 139/1354 | Referent | ··· |
| High‐low | 64/544 | 1.12 (0.83–1.50) | 0.47 |
| Low‐high | 49/253 | 1.57 (1.13–2.18) | 0.007 |
| Low‐low | 115/623 | 1.40 (1.09–1.79) | 0.008 |
Presence of subclinical disease was evaluated at last exam with available subclinical disease, n=2010 (1472 from exam 8 and 538 from exam 6).
Follow‐up for CVD incidence and mortality begins after last exam attended with available CVH score (n=2774, 428 CVD events, 367 death events). CI indicates confidence interval; CVD, cardiovascular disease; CVH, cardiovascular health; HR, hazard ratio
Figure 3.
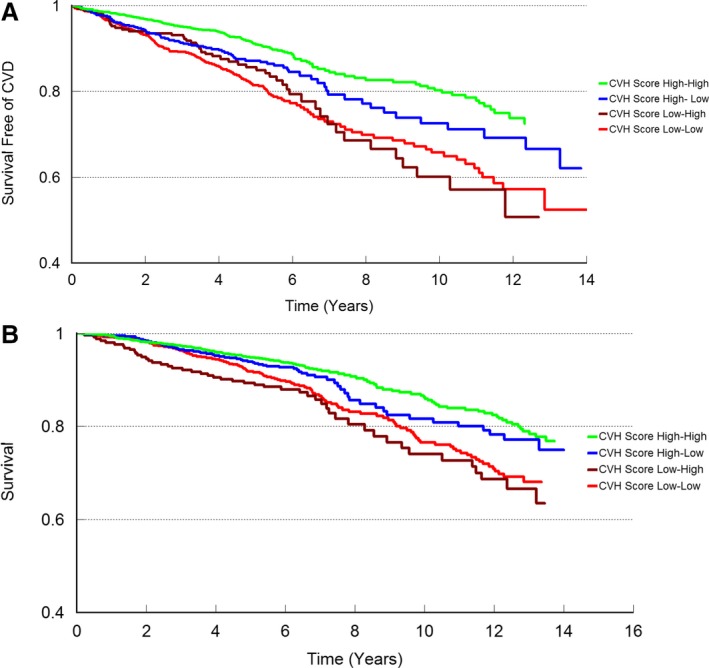
A, Kaplan–Meier plot for incidence of cardiovascular disease (CVD). B, Kaplan–Meier plot for incidence of all‐cause mortality. CVH indicates cardiovascular health.
Discussion
The principal findings of our report are 2‐fold. First, the proportion of participants with an ideal CVH has decreased during the past 20 years, mostly because of decreases in the proportion of those with an ideal body mass index, blood pressure, blood glucose and serum cholesterol levels. Second, people who maintained their high CVH scores (“high‐high” group) were at lower odds of subclinical disease and lower risk of incident CVD and all‐cause mortality compared with other groups.
Multiple reports have been published showing the association between an ideal cardiovascular health and lower risk of incident hypertension, dementia, and heart failure, lower odds of subclinical disease and lower values of serum biomarkers representing various biological pathways.2, 3, 5, 14 Additionally, Ogunmoroti et al15 published on trends of the CVH score among employees of a healthcare organization, showing an increase of the CVH score within a 3‐year period (2011–2014), and Yang et al16 used the Kailuan study to assess the association between the change in CVH score over a 2‐year time period (2006–2008) and incidence of stroke. Both studies used a short time period, whereas our study provided more comprehensive results, evaluating trends of the CVH score over a 20‐year period and assessing the association of change in the CVH score with subclinical and clinical CVD. Laitinen et al17 showed that sustaining or regaining the ideal CVH score from childhood to young adulthood results in beneficial effects on cardio‐metabolic health (follow‐up 21 years, 1986–2007). Our investigation focused on adults with ages ranging from 25 to 74 years, and not only confirmed the aforementioned results using 4 different groups representing changes in CVH score, but also expanded to show the associations with subclinical disease and incidence of overt CVD and all‐cause mortality. Reports from Dong et al18 and Djousse et al19 showed a decline in ideal CVH score among Chinese children and adolescents during a period of 10 years (2004–2014), and black adults during a 13‐year period (2000–2013); our report confirmed the results among adults and extended the findings to assess the association of change in CVH score during a 20‐year period and subclinical and clinical CVD, as well as all‐cause mortality. Moreover, our study evaluated the trends of each component of the CVH score throughout the 20‐year period, for which limited data exist; we observed declines in proportions of individuals with ideal blood pressure, fasting glucose, serum cholesterol, and body mass index that likely contributed to the decline in prevalence of ideal CVH score over the past 20 years. It should also be noted that the change in the ideal status of BMI between exams 5 and 6 was higher as compared with the change between exams 6 and 7 and also between 7 and 8, which may reflect the start of the obesity epidemic; this could be the main driver of the larger change in ideal CVH scores between exams 5 and 6. Additionally, Caleyachetty et al20 reported that adults with a higher number of social risk factors, such as lower education level and lower family income were less likely to have an ideal status of the cardiovascular risk factors; however, in our investigation we did not observe statistically significant results for the variables income or years in education in our prospective analyses. We also observed that people who maintained their high CVH score throughout the study period were at lower odds of having subclinical disease than those whose scores decreased or those who started with a low CVH score and improved later in life, underlying the high importance of having an ideal CVH score as early as possible throughout the adult life course. Finally, people who started with a “low” CVH score, regardless of whether they increased their score or not throughout the study period, had higher rates of developing CVD and dying as compared with those who started and maintained a high CVH score throughout the study period, reinforcing the potential importance of acquiring and maintaining an ideal CVH score.
Our study underlines the importance of maintaining a healthy lifestyle, reflected by an ideal CVH score, to help reduce the incidence of CVD, which in turn will decrease rates of CVD morbidity and mortality. Furthermore, given the increasing number of CVD hospitalizations, and economic burden associated with the medical and surgical management of overt CVD, prevention of CVD will also result in a significant reduction of the financial burden posed by CVD both at the individual and the community level; this notion further emphasizes the critical need for primordial, primary and secondary prevention of CVD, all of which can be rendered possible by maintaining ideal cardiovascular health.
Although achieving and preserving a good cardiovascular health status requires mainly the effort of an individual, it is crucial to mention the effect of public health policies. Masters et al21 conducted a systematic review on the return on investment of public health interventions, and concluded that such interventions are highly cost‐saving. More specifically, they reported that the public health interventions result in a median return on investment of ≈14:1, which is a significant cost saving activity at a national level. Moreover, attention should be placed on large scale community‐based efforts targeting smoking cessation, weight control, and promoting healthier diets at a national level as cost‐effective strategies for promoting CVH, along with screening and controlling high levels of blood pressure, glucose, and lipids. The present study combined cross‐sectional and longitudinal analyses, including a large community‐based sample with a validated group of subclinical disease measures and continuous surveillance for clinical outcomes (including CVD). Some limitations should be acknowledged. Coronary artery calcification was not used for the definition of subclinical disease, because of the non‐availability of measurements at the sixth examination cycle. Moreover, the generalizability of our study results is limited to white participants of white ancestry who are middle‐aged and older. Finally, diet and physical activity were defined using food frequency questionnaires and a formula for summating varying degrees of activity, respectively, that differed from those used by the American Heart Association; specifically, physical activity at exam 6 was calculated using a different summation process than in other examination cycles.
Conclusion
The presence of ideal CVH score has decreased over the past 20 years, which resulted in increasing odds of subclinical disease and risk of CVD and all‐cause mortality. These findings underscore the importance of acquiring an ideal CVH score early in life and maintaining it over the life course.
Sources of Funding
This work was supported by contracts N01‐HC‐25195 and HHSN268201500001I (Vasan) from the National Heart, Lung, and Blood Institute.
Disclosures
None.
Supporting information
Table S1. Components and Definition of the Cardiovascular Health Score
Table S2. Components and Definition of Subclinical Disease
Table S3. Frequencies of CVH Score Groups by Sex in Sample With ≥2 Exams Available (n=2805)
Table S4. Distribution of Exams for Participants With ≥2 Exams Available
Table S5. Breakdown of Incident Cardiovascular Disease (CVD) Events
Figure S1. Sample exclusions.
(J Am Heart Assoc. 2018;7:e008741 DOI: 10.1161/JAHA.118.008741.)29773573
References
- 1. Collins TC, Slovut DP, Newton R Jr, Johnson WD, Larrivee S, Patterson J, Johnston JA, Correa A. Ideal cardiovascular health and peripheral artery disease in African Americans: results from the Jackson Heart Study. Prev Med Rep. 2017;7:20–25. [DOI] [PMC free article] [PubMed] [Google Scholar]
- 2. Nayor M, Enserro DM, Vasan RS, Xanthakis V. Cardiovascular health status and incidence of heart failure in the Framingham Offspring Study. Circ Heart Fail. 2016;9:e002416. [DOI] [PMC free article] [PubMed] [Google Scholar]
- 3. Pase MP, Beiser A, Enserro D, Xanthakis V, Aparicio H, Satizabal CL, Himali JJ, Kase CS, Vasan RS, DeCarli C, Seshadri S. Association of ideal cardiovascular health with vascular brain injury and incident dementia. Stroke. 2016;47:1201–1206. [DOI] [PMC free article] [PubMed] [Google Scholar]
- 4. Spahillari A, Talegawkar S, Correa A, Carr JJ, Terry JG, Lima J, Freedman JE, Das S, Kociol R, de Ferranti S, Mohebali D, Mwasongwe S, Tucker KL, Murthy VL, Shah RV. Ideal cardiovascular health, cardiovascular remodeling, and heart failure in blacks: the Jackson Heart Study. Circ Heart Fail. 2017;10:e003682. [DOI] [PMC free article] [PubMed] [Google Scholar]
- 5. Xanthakis V, Enserro DM, Murabito JM, Polak JF, Wollert KC, Januzzi JL, Wang TJ, Tofler G, Vasan RS. Ideal cardiovascular health: associations with biomarkers and subclinical disease and impact on incidence of cardiovascular disease in the Framingham Offspring Study. Circulation. 2014;130:1676–1683. [DOI] [PubMed] [Google Scholar]
- 6. Lee HJ, Suh B, Yoo TG, Lee H, Shin DW. Trends in cardiovascular health metrics among Korean adults. Korean J Fam Med. 2013;34:403–412. [DOI] [PMC free article] [PubMed] [Google Scholar]
- 7. Olsen GS, Holm AS, Jorgensen T, Borglykke A. Distribution of ideal cardiovascular health by educational levels from 1978 to 2006: a time trend study from the capital region of Denmark. Eur J Prev Cardiol. 2014;21:1145–1152. [DOI] [PubMed] [Google Scholar]
- 8. Aatola H, Hutri‐Kahonen N, Juonala M, Laitinen TT, Pahkala K, Mikkila V, Telama R, Koivistoinen T, Lehtimaki T, Viikari JS, Raitakari OT, Kahonen M. Prospective relationship of change in ideal cardiovascular health status and arterial stiffness: the Cardiovascular Risk in Young Finns Study. J Am Heart Assoc. 2014;3:e000532 DOI: 10.1161/JAHA.113.000532. [DOI] [PMC free article] [PubMed] [Google Scholar]
- 9. Kannel WB, Feinleib M, McNamara PM, Garrison RJ, Castelli WP. An investigation of coronary heart disease in families. The Framingham Offspring Study. Am J Epidemiol. 1979;110:281–290. [DOI] [PubMed] [Google Scholar]
- 10. Sundstrom J, Sullivan L, Selhub J, Benjamin EJ, D'Agostino RB, Jacques PF, Rosenberg IH, Levy D, Wilson PW, Vasan RS. Relations of plasma homocysteine to left ventricular structure and function: the Framingham Heart Study. Eur Heart J. 2004;25:523–530. [DOI] [PubMed] [Google Scholar]
- 11. Ingelsson E, Sullivan LM, Fox CS, Murabito JM, Benjamin EJ, Polak JF, Meigs JB, Keyes MJ, O'Donnell CJ, Wang TJ, D'Agostino RB, Wolf PA, Vasan RS. Burden and prognostic importance of subclinical cardiovascular disease in overweight and obese individuals. Circulation. 2007;116:375–384. [DOI] [PubMed] [Google Scholar]
- 12. Ingelsson E, Sullivan LM, Murabito JM, Fox CS, Benjamin EJ, Polak JF, Meigs JB, Keyes MJ, O'Donnell CJ, Wang TJ, D'Agostino RB Sr, Wolf PA, Vasan RS. Prevalence and prognostic impact of subclinical cardiovascular disease in individuals with the metabolic syndrome and diabetes. Diabetes. 2007;56:1718–1726. [DOI] [PubMed] [Google Scholar]
- 13. Kannel WB, Wolf PA, Garrison RJ, eds. Section 34: Some Risk Factors Related to the Annual Incidence of Cardiovascular Disease and Death in Pooled Repeated Biennial Measurements. Framingham Heart Study, 30 Year Follow‐Up. Bethesda, MD: US Department of Health and Human Services; 1987. [Google Scholar]
- 14. Zhao HY, Liu XX, Wang AX, Wu YT, Zheng XM, Zhao XH, Cui K, Ruan CY, Lu CZ, Jonas JB, Wu SL. Ideal cardiovascular health and incident hypertension: the longitudinal community‐based Kailuan study. Medicine (Baltimore). 2016;95:e5415. [DOI] [PMC free article] [PubMed] [Google Scholar]
- 15. Ogunmoroti O, Utuama O, Spatz ES, Rouseff M, Parris D, Das S, Younus A, Guzman H, Tran T, Agatston A, Feldman T, Virani SS, Maziak W, Veledar E, Nasir K. Trends in ideal cardiovascular health metrics among employees of a large healthcare organization (from the Baptist Health South Florida Employee Study). Am J Cardiol. 2016;117:787–793. [DOI] [PubMed] [Google Scholar]
- 16. Yang X, Wang A, Liu X, An S, Chen S, Wang Y, Wang Y, Wu S. Positive changes in ideal CVH metrics reduce the incidence of stroke. Sci Rep. 2016;6:19673. [DOI] [PMC free article] [PubMed] [Google Scholar]
- 17. Laitinen TT, Pahkala K, Magnussen CG, Oikonen M, Viikari JS, Sabin MA, Daniels SR, Heinonen OJ, Taittonen L, Hartiala O, Mikkila V, Hutri‐Kahonen N, Laitinen T, Kahonen M, Raitakari OT, Juonala M. Lifetime measures of ideal cardiovascular health and their association with subclinical atherosclerosis: the Cardiovascular Risk in Young Finns Study. Int J Cardiol. 2015;185:186–191. [DOI] [PubMed] [Google Scholar]
- 18. Dong H, Yan Y, Liu J, Zhao X, Cheng H, Hou D, Huang G, Li S, Wang Y, Mi J. Alarming trends in ideal cardiovascular health among children and adolescents in Beijing, China, 2004 to 2014. Int J Cardiol. 2017;231:264–270. [DOI] [PubMed] [Google Scholar]
- 19. Djousse L, Petrone AB, Blackshear C, Griswold M, Harman JL, Clark CR, Talegawkar S, Hickson DA, Gaziano JM, Dubbert PM, Correa A, Tucker KL, Taylor HA. Prevalence and changes over time of ideal cardiovascular health metrics among African‐Americans: the Jackson Heart Study. Prev Med. 2015;74:111–116. [DOI] [PMC free article] [PubMed] [Google Scholar]
- 20. Caleyachetty R, Echouffo‐Tcheugui JB, Muennig P, Zhu W, Muntner P, Shimbo D. Association between cumulative social risk and ideal cardiovascular health in US adults: NHANES 1999–2006. Int J Cardiol. 2015;191:296–300. [DOI] [PubMed] [Google Scholar]
- 21. Masters R, Anwar E, Collins B, Cookson R, Capewell S. Return on investment of public health interventions: a systematic review. J Epidemiol Community Health. 2017;71:827–834. [DOI] [PMC free article] [PubMed] [Google Scholar]
Associated Data
This section collects any data citations, data availability statements, or supplementary materials included in this article.
Supplementary Materials
Table S1. Components and Definition of the Cardiovascular Health Score
Table S2. Components and Definition of Subclinical Disease
Table S3. Frequencies of CVH Score Groups by Sex in Sample With ≥2 Exams Available (n=2805)
Table S4. Distribution of Exams for Participants With ≥2 Exams Available
Table S5. Breakdown of Incident Cardiovascular Disease (CVD) Events
Figure S1. Sample exclusions.