

Abstract
Background
Hypertension is a major risk factor for cardiovascular disease and all‐cause mortality. Compared with prior guidelines, the 2017 American College of Cardiology/American Heart Association (ACC/AHA) hypertension guideline recommends lower blood pressure thresholds for defining hypertension, for initiating antihypertensive medication, and for antihypertensive medication treatment goals.
Methods and Results
To better understand potential impacts of the 2017 guideline, we studied trends in mean systolic blood pressure and diastolic blood pressure, prevalence and burden of hypertension, and proportion of controlled hypertension in the US adult population aged ≥20 from 1999 through 2016. We used data from 38 276 adults from the National Health and Nutrition Examination Survey. Age‐standardized prevalence of hypertension decreased from 48.4% in 1999–2000 to 45.4% in 2015–2016. However, absolute burden of hypertension consistently increased, from 87.0 million in 1999–2000 to 108.2 million in 2015–2016. The age‐standardized proportion of controlled hypertension among adults receiving antihypertensive pharmacologic treatment increased from 1999–2000 (25.6%) to 2015–2016 (43.5%). There was not consistent improvement in control throughout the full period among non‐Hispanic blacks, individuals aged ≥60, or those with diabetes mellitus, chronic kidney disease, or high cardiovascular disease risk.
Conclusions
Based on the 2017 guideline, from 1999 to 2016, the age‐standardized prevalence of hypertension decreased and the proportion of control among those treated for hypertension improved. However, the absolute hypertension burden increased. Among those treated, the control rate did not consistently improve in all subgroups. These data emphasize the need for continuous efforts in the prevention and control of hypertension in the US general population.
Keywords: epidemiology, high blood pressure, hypertension, risk factor
Subject Categories: High Blood Pressure, Hypertension, Risk Factors, Epidemiology
Clinical Perspective
What Is New?
This study reports long‐term trends of prevalence and burden of hypertension and prevalence of hypertension control among US adults based on definitions from the 2017 American College of Cardiology/American Heart Association (ACC/AHA) blood pressure guideline.
Among US adults aged ≥20, from 1999 to 2016, there was a decrease in age‐adjusted prevalence of hypertension as defined by the 2017 guideline, although the absolute burden increased.
Among adults treated for hypertension, age‐adjusted control improved from 1999 to 2016, although control did not improve throughout the full period among non‐Hispanic blacks, individuals aged ≥60, or those with diabetes mellitus, chronic kidney disease, or high cardiovascular disease risk.
What Are the Clinical Implications?
Due to the increasing overall burden of hypertension, these data emphasize the importance of prevention and control of hypertension in the US general population.
Introduction
Hypertension is a major modifiable risk factor for cardiovascular disease (CVD) and premature mortality in the United States and worldwide.1, 2, 3, 4, 5 Much evidence from observational studies has shown strong, positive relationships between blood pressure (BP) and risk of CVD and mortality.6, 7 Clinical trials have documented that antihypertensive treatment reduces CVD events and all‐cause mortality. A network meta‐analysis of randomized clinical trials reported positive linear relationships between mean achieved systolic BP and risk of CVD and all‐cause mortality; lowest risks were observed among those with achieved systolic BP of 120 to 124 mm Hg.8
The 2017 American College of Cardiology/American Heart Association (ACC/AHA) Guideline for the Prevention, Detection, Evaluation, and Management of High Blood Pressure in Adults (2017 guideline) provided updated BP thresholds for defining hypertension and for the initiation of and goals of pharmacologic treatment of hypertension.9 This guideline, which recommends lower thresholds than prior guidelines,10, 11, 12 defines hypertension as systolic BP ≥130 mm Hg or diastolic BP ≥80 mm Hg. The 2017 guideline was based on a “pragmatic interpretation of BP‐related CVD risk and benefit of BP reduction in clinical trials.”9 For example, in the Systolic Blood Pressure Intervention Trial of individuals with high CVD risk but without diabetes mellitus, compared with a standard systolic BP target of <140 mm Hg, individuals randomized to an intensive systolic BP target of <120 mm Hg had 25% lower risk of CVD events and 27% lower risk of all‐cause mortality.13 Impacts of the 2017 guideline may include increased awareness of hypertension, encouragement of lifestyle modification, and, among US adults with high risk of CVD, increased antihypertension medication initiation and intensification.14
Prior work has assessed the potential effects of these updated criteria on the prevalence and management of hypertension.14 Building from this prior work, here we assess temporal trends in the prevalence and burden of hypertension and proportion of controlled hypertension, as defined by the 2017 guideline, in the US adult population from 1999 through 2016.
Methods
The data and code that support the findings of this study are available from the corresponding author upon reasonable request.
Study Design and Population
Data for this study were derived from the National Health and Nutrition Examination Survey (NHANES) 1999–2016. NHANES, conducted by the National Center for Health Statistics (NCHS) of the US Centers for Disease Control and Prevention, consists of cross‐sectional, nationally representative samples of the noninstitutionalized civilian US population. These samples are identified through a stratified, multistage probability sampling design. In each survey, participants completed in‐home interviews and then visited a mobile examination center, where they responded to additional questionnaires and underwent a medical examination and blood sample collection. During the years 1999 to 2016, 47 133 NHANES participants, aged ≥20 years completed the in‐home interview and medical examination. After excluding participants with missing systolic BP or diastolic BP (n=5490), hypertension treatment (n=161), or variables needed to define diabetes mellitus, chronic kidney disease, CVD history, or 10‐year predicted CVD risk (n=3206), there were 38 276 adults with data available for analysis (Figure 1). All participants provided written informed consent, and all protocols were approved by the NCHS Research Ethics Review Board (name changed from NHANES Institutional Review Board in 2003).
Figure 1.
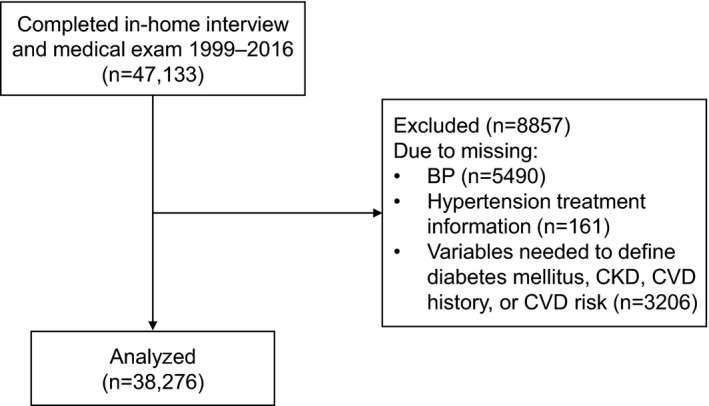
Study population.
Data Collection
Participants completed standardized questionnaires that assessed demographics; cigarette smoking; prior diagnosis of hypertension and antihypertensive medication use; prior diagnosis of high blood cholesterol and the use of lipid‐lowering drugs; and history of myocardial infarction, stroke, heart failure, and diabetes mellitus.15 During the medical examination, BP was measured after resting quietly in a seated position for 5 minutes. Three consecutive measurements were taken, with a fourth attempt potentially made if an earlier measurement was interrupted or incomplete. Mean systolic BP was defined as the average of 3 measurements and mean diastolic BP as the average of 3 measurements. Blood samples were collected at the mobile examination center, stored at −20°C, and sent to offsite laboratories for analyses. Not all participants had fasted before the blood draw. A participant was classified as fasting before the collection of the blood sample if the participant reported not eating or drinking anything other than water for at least 8 hours before the time of venipuncture. Body mass index was calculated as weight in kilograms divided by height in meters squared.
Definitions of Diabetes Mellitus, Chronic Kidney Disease, Cardiovascular Disease
Participants were classified as having diabetes mellitus based on self‐reported status and self‐reported current use of insulin or of pills to lower blood sugar; or having hemoglobin A1c ≥6.5%, fasting serum glucose ≥126 mg/dL, or any serum glucose ≥200 mg/dL.16 Chronic kidney disease was defined as urinary albumin‐creatinine ratio >30 mg/g or estimated glomerular filtration rate (derived by the Chronic Kidney Disease Epidemiology Collaboration equation)17 <60 mL/min per 1.73 m2. History of CVD was defined as self‐reported history of coronary heart disease, myocardial infarction, stroke, or heart failure. Among individuals without prior CVD, the 10‐year estimated risk of atherosclerotic CVD was calculated based on the Pooled Cohort Risk Equations and dichotomized as ≥10% and <10%.9, 18
Definitions of Hypertension, Treatment, and Control
Treatment for hypertension was defined as self‐reported current use of antihypertensive medication among individuals who had reported being told by a doctor or other health professional that they had high BP.
Based on the 2017 guideline, hypertension was defined as mean systolic BP ≥130 mm Hg, mean diastolic BP ≥80 mm Hg, or self‐reported current use of antihypertensive medication.9 For individuals taking antihypertensive medications, control was defined as having both systolic BP <130 mm Hg and diastolic BP <80 mm Hg.9
Statistical Analysis
We first calculated age‐standardized descriptive statistics for each 2‐year cycle. Age‐standardized mean systolic BP and diastolic BP within categories (sex, race/ethnicity, age, treatment for hypertension) were also calculated for each cycle. We report trends for the following race/ethnicity categories: non‐Hispanic white, non‐Hispanic black, and Mexican American. Though other racial/ethnic groups were not available for all cycles to allow for separate estimates for these groups, other racial/ethnic groups were included in overall analyses and other stratified analyses. Next, age‐standardized prevalence of hypertension within categories of interest was calculated for each 2‐year cycle. We then calculated the age‐standardized proportion of controlled hypertension among individuals who were currently taking antihypertensive medication. To estimate absolute burden of hypertension (defined by 2017 guideline) among women and men over time, we calculated total population counts of women and men with hypertension, by multiplying crude age‐specific hypertension prevalence with total US age‐specific population estimates at the time of the respective NHANES cycle.
To estimate nationally representative estimates, we used NHANES sampling weights for all analyses. To take into account the exclusion of individuals who attended the mobile exam clinic but were missing data on either systolic or diastolic BP, hypertension treatment, or key stratification variables, the original weights were reweighted within categories of age, sex, and ethnicity, as previously described.19 For body mass index, there were an additional 383 participants missing information in the final data set; recalibrated weights for body mass index were calculated using the same reweighting approach. Age standardization was calculated via direct standardization to the year 2010 US Census (ages 20–39, 40–59, ≥60 years).20 Based on recommendations from the National Surveillance Definitions for Hypertension, age‐standardized estimates of controlled hypertension were calculated using the subpopulation of individuals with hypertension in the 2009–2010 NHANES cycle (ages 20–39, 40–59, ≥60 years).21
To test for temporal trends in age‐standardized or age‐specific measure of interest, we used weighted least squares regression models (Joinpoint software).22 This approach takes into account the standard error of each data point when determining whether an apparent change over time is significant. As some trends for mean systolic and diastolic BP, hypertension prevalence, and proportion of controlled hypertension appeared nonlinear, we used piecewise regression to assess for changes in trends over time.22, 23 The piecewise regression approach uses a grid‐search method and permutation tests to assess whether the data better fit a linear model or piecewise model. If there was evidence that the piecewise model fit better than the linear model and there was a significant difference between the trend before and after the join point, we report the year at which the trend shifted; otherwise, we only report P for linear trend.
We conducted all analyses using SAS, version 9.4 (SAS Institute, Cary, NC) or Joinpoint Regression Program software (National Cancer Institute, Bethesda, MD). All P values are 2‐sided. A 2‐sided P value of 0.05 was considered statistically significant. We did not account for multiple comparisons. K.S.D. had full access to all data in the study and takes responsibility for its integrity and the data analysis.
Results
Demographic and Health Characteristics
Table 1 reports age‐standardized and age‐specific health characteristics of the US population aged ≥20 from 1999 to 2016. During this period, the proportion of individuals aged ≥60 years tended to increase, and age‐standardized prevalence of non‐Hispanic whites tended to decrease (from 71.1% in 1999–2000 to 63.5% in 2015–2016). Additionally, from 1999 to 2016, the prevalence of age‐standardized high‐school education or higher increased (from 76.2% in 1999–2000 to 86.3% in 2015–2016), while age‐standardized prevalence of current smoking decreased (from 23.5% in 1999–2000 to 18.6% in 2015–2016). Over time, mean age‐standardized body mass index increased, as did age‐standardized prevalence of use of antihypertensive medications and of diabetes mellitus.
Table 1.
Age‐Standardized and Age‐Specific Characteristics of the US Population aged ≥20, by NHANES Cycle
| 1999–2000 | 2001–2002 | 2003–2004 | 2005–2006 | 2007–2008 | 2009–2010 | 2011–2012 | 2013–2014 | 2015–2016 | P‐Linear Trend | |
|---|---|---|---|---|---|---|---|---|---|---|
| N | 3460 | 3934 | 3282 | 3587 | 4618 | 5153 | 4496 | 4925 | 4821 | |
| Age, % | ||||||||||
| 20 to 39 y | 44.0 | 41.0 | 38.8 | 38.0 | 37.5 | 37.0 | 36.3 | 36.2 | 36.2 | <0.001 |
| 40 to 59 y | 34.3 | 38.6 | 38.5 | 39.0 | 38.8 | 38.2 | 37.9 | 36.9 | 35.9 | 0.92 |
| ≥60 y | 21.7 | 20.4 | 22.7 | 23.0 | 23.7 | 24.7 | 25.8 | 26.8 | 28.0 | <0.001 |
| Women, % | 52.5 | 52.5 | 52.2 | 52.0 | 51.9 | 51.8 | 52.0 | 51.9 | 51.8 | 0.002 |
| Race/ethnicity, % | ||||||||||
| Non‐Hispanic white | 71.1 | 72.3 | 72.5 | 72.2 | 69.6 | 68.0 | 66.3 | 65.6 | 63.5 | 0.001 |
| Non‐Hispanic black | 10.6 | 10.7 | 11.1 | 11.4 | 11.2 | 11.4 | 11.5 | 11.5 | 11.4 | 0.001 |
| Mexican American | 6.0 | 6.8 | 7.6 | 7.8 | 8.3 | 8.6 | 7.8 | 9.2 | 9.0 | <0.001 |
| High‐school education or higher, %a | 76.2 | 81.4 | 82.2 | 82.7 | 80.1 | 81.3 | 83.9 | 85.0 | 86.3 | 0.02 |
| Current cigarette smoke, % | 23.5 | 23.8 | 24.9 | 23.5 | 22.5 | 20.1 | 19.3 | 19.6 | 18.6 | <0.001 |
| BMIa, kg/m2 | 28.1 (0.2) | 28.0 (0.2) | 28.2 (0.2) | 28.4 (0.2) | 28.4 (0.2) | 28.7 (0.1) | 28.7 (0.2) | 29.1 (0.2) | 29.4 (0.3) | <0.001 |
| Antihypertensive medication among full population, % | 18.0 | 18.4 | 21.2 | 21.6 | 22.8 | 23.3 | 23.1 | 23.9 | 22.3 | 0.007 |
| Total cholesterol, mg/dL | 205.2 (1.2) | 203.0 (1.4) | 202.5 (0.7) | 198.9 (0.6) | 197.5 (0.9) | 196.1 (1.1) | 195.5 (1.0) | 190.1 (0.7) | 192.8 (1.3) | <0.001 |
| HDL cholesterol, mg/dL | 50.7 (0.7) | 52.0 (0.3) | 54.2 (0.4) | 54.8 (0.4) | 52.1 (0.6) | 53.4 (0.5) | 53.0 (0.5) | 53.3 (0.3) | 55.4 (0.7) | 0.33 |
| Diabetes mellitus, % | 8.1 | 8.6 | 8.8 | 9.2 | 10.4 | 10.6 | 10.7 | 11.2 | 11.8 | <0.001 |
| CKD, % | 14.0 | 14.4 | 13.9 | 14.2 | 14.2 | 12.8 | 13.9 | 14.8 | 13.5 | 0.46 |
| CVD, % | 7.5 | 7.4 | 7.9 | 7.8 | 7.5 | 7.4 | 7.2 | 7.6 | 7.1 | 0.09 |
| ≥10% 10‐y CVD risk, %b | 20.5 | 20.8 | 19.7 | 19.4 | 19.6 | 18.8 | 18.8 | 19.2 | 19.4 | 0.02 |
Population characteristics presented as percentage or mean (standard error). Age‐standardized to 2010 US Census: ages 20 to 39, 40 to 59, ≥60 years; weights of 0.3673, 0.3795, 0.2532, respectively. BMI indicates body mass index; CKD, chronic kidney disease; CVD, cardiovascular disease; HDL, high‐density lipoprotein.
Education status missing on 28 participants. BMI missing on 383 participants (weights reweighted for BMI, as described in text).
Among those without prior CVD, 10‐year predicted cardiovascular disease risk ≥10% using the Pooled Cohort Risk Equations.18 Age‐standardized based on the subpopulation of individuals free of CVD, as this is calculated only among those who have not previously had a CVD event (n=34 798). Age categories: 20 to 39, 40 to 59, ≥60 years; weights from NHANES 2009–2010 of 0.3947, 0.3904, 0.2149, respectively.
Age‐Standardized and Age‐Specific Mean Systolic BP and Diastolic BP
In women, the age‐standardized mean systolic BP decreased from 1999–2000 to 2009–2010 (P=0.007), with no significant trend in subsequent years (Figure 2A). Among both women and men, age‐standardized mean diastolic BP decreased over time (P‐linear trend=0.03 for women, 0.01 for men) (Figure 3A).
Figure 2.
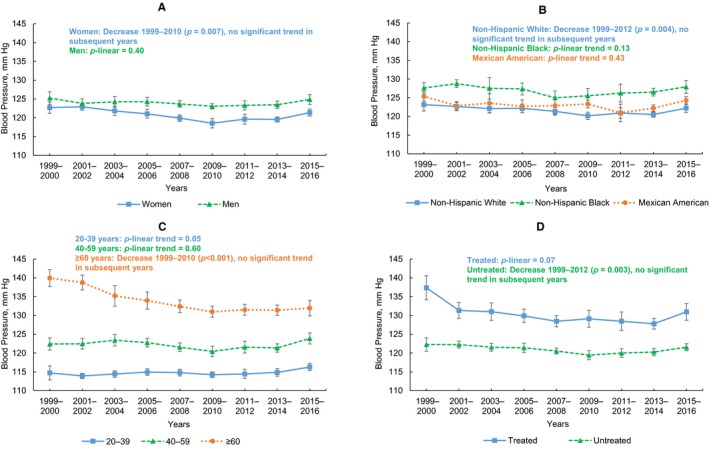
Age‐standardized and age‐specific mean systolic blood pressure (BP) in the US population aged ≥20, by NHANES cycle. A, Age‐standardized mean systolic blood pressure (BP) among women (blue) and men (green). B, Age‐standardized mean systolic BP among non‐Hispanic whites (blue), non‐Hispanic blacks (green), and Mexican Americans (orange). C, Age‐standardized mean systolic BP among ages 20 to 39 (blue), 40 to 59 (green), and ≥60 (orange) years. D, Age‐standardized mean systolic BP among individuals treated for hypertension (blue) and among those not receiving hypertension treatment (green).
Figure 3.
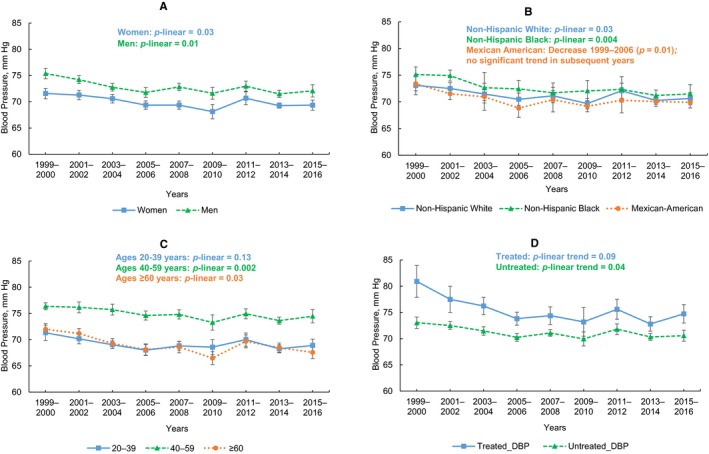
Age‐standardized and age‐specific mean diastolic blood pressure (BP) in the US population ages 20 and older, by NHANES cycle. A, Age‐standardized mean diastolic blood pressure (BP) among women (blue) and men (green). B, Age‐standardized mean diastolic BP among non‐Hispanic whites (blue), non‐Hispanic blacks (green), and Mexican Americans (orange). C, Age‐standardized mean diastolic BP among ages 20 to 39 (blue), 40 to 59 (green), and ≥60 (orange) years. D, Age‐standardized mean diastolic BP among individuals treated for hypertension (blue) and among those not receiving hypertension treatment (green).
There was evidence of nonlinear trends for both systolic BP and diastolic BP by race/ethnicity groups (Figures 2B and 3B). Among non‐Hispanic whites, age‐standardized mean systolic BP decreased from 1999–2000 to 2011–2012 (P=0.004), with no significant trend in later years (Figure 2B). Age‐standardized mean diastolic BP decreased from 1999 to 2006 among Mexican Americans (P=0.01), with no significant trend in later years (Figure 3B). Age‐standardized mean diastolic BP decreased among both non‐Hispanic whites (P‐linear trend=0.03) and non‐Hispanic blacks (P‐linear trend=0.004).
Mean systolic BP was consistently highest among individuals ≥60 years and lowest among ages 20 to 39 years (Figure 2C). From 1999–2000 to 2009–2010, mean systolic BP decreased among individuals ≥60 years (P<0.001), with no significant trend in subsequent years. Mean diastolic BP was consistently highest among individuals aged 40 to 59 years (Figure 3C). There was a linear trend of decreasing mean diastolic BP over time among ages 40 to 59 years (P‐linear trend=0.002) and ≥60 years (P‐linear trend=0.03).
Among individuals receiving pharmacologic antihypertensive treatment, there were not significant trends in change in mean systolic or diastolic BP, though there were suggestive patterns of decreasing BP over time (Figures 2D and 3D). For example, age‐standardized mean systolic BP decreased substantially from 1999–2000 (137.4 mm Hg; 95% confidence interval, 134.2–140.6 mm Hg) to 2001–2002 (131.3 mm Hg; 95% confidence interval, 129.2–133.4 mm Hg) among those receiving treatment. Among those not on antihypertensive treatment, there was a trend of decreasing systolic BP from 1999 to 2012 (P=0.002), with no significant trend in subsequent years (Figure 2D). Additionally, diastolic BP decreased over time (P‐linear trend=0.04) (Figure 3D).
Age‐Standardized and Age‐Specific Prevalence of Hypertension
In the full population, age‐standardized prevalence of hypertension, as defined by the 2017 guideline, decreased from 48.4% in 1999–2000 to 45.4% in 2015–2016 (Table 2; P‐linear trend =0.02). Similar patterns of decreasing hypertension prevalence over time were observed among women, men, and non‐Hispanic whites. Among individuals aged ≥60 years, there was a decrease in hypertension prevalence over time, from 79.5% in 1999–2000 to 71.8% in 2015–2016 (P‐linear trend=0.006).
Table 2.
Age‐Standardized and Age‐Specific Prevalence of Hypertension (2017 AHA/ACC Guidelinea) in the US Population Aged ≥20, by NHANES Cycle
| Total Hypertension Prevalence, % (95% CI)b | ||||||||||
|---|---|---|---|---|---|---|---|---|---|---|
| 1999–2000 (n=3460) | 2001–2002 (n=3934) | 2003–2004 (n=3282) | 2005–2006 (n=3587) | 2007–2008 (n=4618) | 2009–2010 (n=5153) | 2011–2012 (n=4496) | 2013–2014 (n=4925) | 2015–2016 (n=4821) | P trend, linear | |
| Overall | 48.4 (44.8–51.9) | 47.5 (44.9–50.1) | 46.1 (43.0–49.2) | 46.0 (43.6–48.5) | 45.1 (43.2–47.1) | 44.3 (41.6–47.0) | 46.0 (43.9–48.1) | 44.2 (42.3–46.0) | 45.4 (43.1–47.8) | 0.02 |
| By sex | ||||||||||
| Women | 43.0 (39.2–46.8) | 43.4 (40.9–46.0) | 42.2 (39.4–44.9) | 41.9 (39.1–44.7) | 41.2 (38.7–43.7) | 40.8 (38.4–43.2) | 42.0 (39.5–44.5) | 41.2 (38.8–43.6) | 41.9 (39.4–44.4) | 0.07 |
| Men | 54.0 (49.7–58.4) | 51.7 (47.6–55.9) | 50.2 (46.0–54.5) | 50.2 (46.8–53.6) | 49.0 (46.9–51.0) | 47.7 (44.2–51.3) | 50.1 (46.8–53.4) | 47.2 (44.2–50.2) | 49.0 (45.3–52.7) | 0.02 |
| By race /ethnicity | ||||||||||
| Non‐Hispanic white | 47.1 (42.4–51.7) | 46.2 (43.1–49.3) | 45.2 (41.9–48.5) | 45.4 (42.4–48.5) | 44.7 (41.6, 47.8) | 42.8 (39.7–45.9) | 45.5 (42.6–48.5) | 42.7 (39.9–45.5) | 43.8 (40.9–46.6) | 0.02 |
| Non‐Hispanic black | 57.9 (53.3–62.6) | 60.3 (56.1–64.5) | 54.5 (47.9–61.1) | 56.6 (53.2–60.0) | 53.2 (49.0–57.4) | 58.4 (54.9–61.8) | 57.6 (53.8–61.4) | 56.7 (55.0–58.4) | 57.3 (54.2–60.5) | 0.62 |
| Mexican American | 45.5 (42.1–48.8) | 41.0 (38.0–44.1) | 42.9 (37.7–48.2) | 37.7 (32.7–42.8) | 42.8 (38.8–46.8) | 41.4 (36.7–46.1) | 40.8 (35.4–46.2) | 42.8 (39.7–45.9) | 44.7 (40.3–49.0) | 0.96 |
| By age | ||||||||||
| 20 to 39 y | 23.2 (18.5–28.0) | 23.9 (21.1–26.7) | 19.3 (17.1–21.4) | 19.7 (16.2–23.1) | 19.2 (15.4–22.9) | 20.7 (18.6–22.9) | 21.3 (17.6–25.0) | 18.3 (15.8–20.8) | 21.4 (17.8–24.9) | 0.27 |
| 40 to 59 y | 51.9 (47.6–56.3) | 49.2 (45.3–53.1) | 52.3 (46.3–58.2) | 51.8 (47.8–55.8) | 49.3 (45.9–52.6) | 46.0 (40.1–52.0) | 50.5 (48.6–52.4) | 48.2 (44.4–51.9) | 51.1 (47.4–54.8) | 0.60 |
| ≥60 y | 79.5 (73.3–85.7) | 79.1 (75.7–82.4) | 75.9 (71.7–80.1) | 75.7 (71.0–80.4) | 76.6 (73.7–79.6) | 75.9 (72.7–79.1) | 75.0 (71.6–78.4) | 75.7 (72.5–78.8) | 71.8 (66.6–77.0) | 0.006 |
| Diabetes mellitus | 72.1 (60.8–83.3) | 67.1 (59.0–75.1) | 64.2 (55.4–73.1) | 69.3 (59.0–79.6) | 66.4 (61.8–71.1) | 67.8 (59.2–76.4) | 71.0 (62.8–79.3) | 65.9 (59.7–72.0) | 68.3 (57.4–79.2) | 0.86 |
| CKD | 60.3 (54.0–66.5) | 64.0 (56.8–71.2) | 56.2 (49.9–62.6) | 61.2 (53.8–68.6) | 59.5 (54.7–64.4) | 58.7 (51.1–66.3) | 62.6 (58.0–67.1) | 59.4 (54.6–64.2) | 61.4 (53.8–68.9) | 0.82 |
| CVD | 44.7 (34.3–55.2) | 62.1 (49.2–75.0) | 56.8 (44.0–69.6) | 48.1 (42.1–54.1) | 59.4 (50.3–68.4) | 64.5 (53.7–75.3) | 63.2 (52.6–73.7) | 64.0 (51.4–76.6) | 60.7 (49.3–72.0) | 0.05 |
| ≥10% 10‐y CVD riskc | 55.6 (47.7–63.4) | 57.0 (52.3–61.6) | 58.8 (48.9–68.8) | 61.2 (48.2–74.2) | 60.3 (54.0–66.6) | 60.5 (54.8–66.2) | 73.3 (58.6–88.0) | 65.1 (58.5–71.6) | 64.6 (56.2–73.0) | 0.002 |
| Diabetes mellitus, CKD, CVD, or ≥10% 10‐y CVD riskd | 57.0 (52.6–61.4) | 61.3 (57.5–65.1) | 57.1 (51.9–62.4) | 58.0 (53.0–63.0) | 58.1 (54.6–61.6) | 59.6 (54.9–64.3) | 63.3 (59.6–66.9) | 59.0 (56.1–61.8) | 60.6 (54.7–66.5) | 0.39 |
CI indicates confidence interval; CKD, chronic kidney disease; CVD, cardiovascular disease.
2017 American College of Cardiology/American Heart Association (ACC/AHA) guideline for the prevention, detection, evaluation, and management of high blood pressure in adults.9
Prevalence is age‐standardized to 2010 Census (ages 20–39, 40–59, ≥60 years; weights of 0.3673, 0.3795, 0.2532, respectively). Estimate and 95% CIs reported.
Among those without prior CVD, 10‐year predicted cardiovascular disease risk ≥10% using the Pooled Cohort Risk Equations.18 Age‐standardized based on the subpopulation of individuals free of CVD, as this is calculated only among those who have not previously had a CVD event. Age categories: 20 to 39, 40 to 59, ≥60 years; weights from NHANES 2009–2010 of 0.3947, 0.3904, 0.2149, respectively.
Individuals with diabetes mellitus, CKD, prior CVD (coronary heart disease, stroke, or heart failure), or 10‐year predicted atherosclerotic cardiovascular disease risk ≥10% using the Pooled Cohort Risk Equations.18
Over time, there was an increase in age‐standardized hypertension prevalence among individuals without prior CVD who had ≥10% estimated 10‐year risk of atherosclerotic CVD, from 55.6% in 1999–2000 to 64.6% in 2015–2016 (P‐trend linear 0.002). A similar pattern was observed among those with CVD.
Absolute Burden of Hypertension
From 1999 to 2016, the estimated absolute burden of hypertension, as defined by the 2017 guideline, among US adults aged ≥20 increased among both women and men (Figure 4). The estimated number of women with hypertension was 40.4 million in 1999–2000 and 53.0 million in 2015–2016. Among men, the estimated number with hypertension was 46.6 million in 1999–2000 and 55.2 million in 2015–2016.
Figure 4.
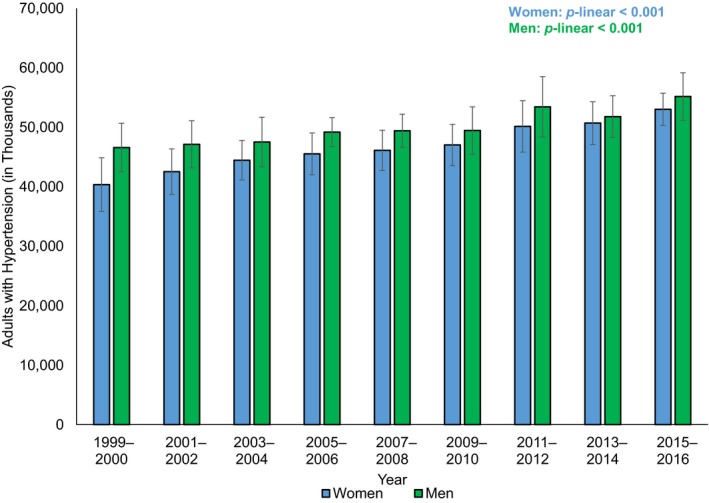
Absolute number of individuals (in thousands) with hypertension (2017 AHA/ACC Guideline*) in the US population ages 20 and older, by NHANES cycle. *2017 American College of Cardiology/American Heart Association (ACC/AHA) guideline for the prevention, detection, evaluation and management of high blood pressure in adults.
Age‐Standardized and Age‐Specific Hypertension Control Among Treated Individuals
Among adults receiving pharmacologic treatment for hypertension, the age‐standardized proportion of control tended to increase substantially over time (Table 3). For example, in 1999–2000, the age‐standardized proportion of hypertension control was 25.6% and in 2015–2016 was 43.5% (P‐linear trend=0.002). There were linear trends of improvement among women, men, non‐Hispanic whites, individuals with diabetes mellitus, and individuals with chronic kidney disease. Among other subgroups, there were nonlinear patterns. Among non‐Hispanic blacks, there was an increase in the age‐standardized proportion of hypertension control from 1999–2000 to 2002–2004 (P<0.001), with no significant trend in later years. Among individuals aged ≥60, the proportion of hypertension control improved from 1999–2000 to 2009–2010 (P<0.001), with no significant trend thereafter. Among individuals with diabetes mellitus, chronic kidney disease, or high CVD risk, the proportion of hypertension control decreased from 1999–2000 to 2007–2008 (P=0.02), with no significant trend in subsequent years.
Table 3.
Age‐Standardized Proportion of Controlled Hypertension (2017 AHA/ACC Guidelinea) Among Treated Individuals in the US Population Aged ≥20, by NHANES Cycle
| Proportion of Controlled Hypertension Among Treated Individuals, % (95% CI)b | ||||||||||
|---|---|---|---|---|---|---|---|---|---|---|
| 1999–2000 (n=690) | 2001–2002 (n=786) | 2003–2004 (n=770) | 2005–2006 (n=788) | 2007–2008 (n=1241) | 2009–2010 (n=1369) | 2011–2012 (n=1177) | 2013–2014 (n=1311) | 2015–2016 (n=1299) | P trend linear | |
| Overall | 25.6 (19.9–31.3) | 34.2 (28.7–39.7) | 38.0 (33.2–42.7) | 40.4 (34.2–46.5) | 44.8 (39.7–49.8) | 44.0 (40.6–47.4) | 48.2 (41.1–55.3) | 48.7 (44.3–53.2) | 43.5 (37.3–49.7) | 0.002 |
| By sex | ||||||||||
| Women | 31.5 (21.4–41.5) | 35.3 (27.6–42.9) | 36.2 (29.1–43.3) | 40.9 (35.1–46.7) | 48.2 (41.6–54.8) | 46.5 (40.8–52.1) | 46.5 (38.0–55.1) | 52.6 (47.1–58.1) | 45.1 (39.1–51.0) | 0.006 |
| Men | 24.9 (19.3–30.4) | 33.8 (27.0–40.6) | 40.0 (35.2–44.9) | 40.2 (31.3–49.2) | 41.0 (32.8–49.2) | 42.1 (35.3–48.9) | 48.7 (41.3–56.0) | 45.1 (39.9–50.2) | 42.1 (34.3–49.9) | 0.006 |
| By race/ethnicity | ||||||||||
| Non‐Hispanic white | 28.4 (19.7–37.0) | 33.6 (26.0–41.2) | 40.9 (35.2–46.6) | 42.8 (33.9–51.8) | 46.5 (38.7–54.4) | 45.6 (41.8–49.4) | 52.8 (44.8–60.9) | 52.7 (47.6–57.8) | 45.7 (36.3–55.1) | <0.001 |
| Non‐Hispanic black | 18.7 (11.5–25.9) | 27.5 (21.0–33.9) | 35.8 (27.0–44.6) | 37.4 (33.3–41.4) | 37.7 (29.5–46.0) | 37.4 (28.5–46.3) | 36.9 (29.6–44.2) | 36.2 (27.7–44.7) | 37.2 (31.7–42.7) | NAc |
| Mexican American | 24.2 (12.6–35.9) | 40.3 (29.2–51.4) | 39.1 (27.5–50.8) | 41.2 (25.4–57.1) | 45.6 (37.2–54.0) | 36.7 (26.2–47.2) | 39.3 (27.2–51.4) | 50.3 (39.9–60.7) | 41.9 (37.8–46.0) | 0.14 |
| By age | ||||||||||
| 20 to 59 y | 30.2 (24.9–35.5) | 36.3 (28.8–43.8) | 43.5 (37.9–49.0) | 44.3 (38.0–50.5) | 45.2 (37.5–53.0) | 43.9 (39.2–48.5) | 53.6 (45.1–62.0) | 53.7 (47.6–59.8) | 47.0 (36.3–57.7) | 0.002 |
| ≥60 y | 21.1 (16.7–25.5) | 30.2 (24.6–35.9) | 31.9 (25.9–37.9) | 35.1 (28.7–41.5) | 42.5 (38.4–46.7) | 45.3 (41.9–48.7) | 41.5 (34.8–48.3) | 42.3 (35.5–49.1) | 41.5 (35.4–47.6) | NAc |
| Diabetes mellitus | 25.6 (11.8–39.5) | 31.6 (22.1–41.0) | 35.7 (26.3–45.2) | 41.6 (31.5–51.8) | 46.9 (38.3–55.5) | 41.9 (34.6–49.1) | 49.3 (38.2–60.5) | 48.4 (40.3–56.5) | 47.6 (39.8–55.4) | 0.002 |
| CKD | 18.2 (9.4–26.9) | 27.6 (16.4–38.8) | 27.8 (17.5–38.1) | 36.0 (26.5–45.5) | 37.1 (30.4–43.9) | 39.5 (34.1–45.0) | 42.0 (31.2–52.7) | 45.0 (34.0–56.0) | 37.4 (29.4–45.4) | 0.005 |
| Diabetes mellitus, CKD, CVD, or ≥10% 10‐y CVD riskd | 21.1 (15.5–26.7) | 30.3 (22.7–37.9) | 33.0 (25.8–40.3) | 34.3 (25.5–43.1) | 42.4 (37.2–47.5) | 42.4 (36.6–48.2) | 44.1 (37.0–51.3) | 46.7 (39.3–54.1) | 41.7 (36.6–46.8) | NAc |
CI indicates confidence interval; CKD, chronic kidney disease; CVD, cardiovascular disease.
2017 American College of Cardiology/American Heart Association (ACC/AHA) guideline for the prevention, detection, evaluation and management of high blood pressure in adults.9
Hypertension control estimates are age standardized by the direct method using computed weights based on the subpopulation of individuals with hypertension in the 2009–2010 (age groups 20–39, 40–59, ≥60 years; weights of 0.1743, 0.4002, 0.4255, respectively), per recommendations of the National Surveillance Definitions for Hypertension.21
Piecewise regression analyses indicated that slopes were significantly different before and after joinpoint, so P value for linear trend was not reported. Please see Results section for details.
Individuals with diabetes mellitus, CKD, prior CVD (coronary heart disease, stroke, or heart failure), or among those without prior CVD, 10‐year predicted atherosclerotic cardiovascular disease risk ≥10% using the Pooled Cohort Risk Equations.18
Discussion
Based on 2017 ACC/AHA hypertension guideline criteria, among US adults, there was an improvement in age‐standardized hypertension prevalence and control from 1999 through 2016. However, the absolute burden of hypertension has consistently increased. Additionally, among some groups receiving treatment, much of the improvement in hypertension control tended to occur during the early part of the period, with no significant trends in recent years.
Using the 2017 guideline, long‐term trends in hypertension prevalence are somewhat different than trends found when hypertension was defined on the basis of the Seventh Report of the Joint National Committee on Prevention, Detection, Evaluation and Treatment of High Blood Pressure guideline.10 For example, based on this report, the age‐standardized prevalence of hypertension (systolic BP ≥140 mm Hg, diastolic BP ≥90 mm Hg or taking medication to lower blood pressure), did not change from 1999–2000 (28.4%) to 2015–2016 (29.0%) among US adults.24 In contrast, based on the 2017 guideline, age‐standardized hypertension prevalence decreased from 1999–2000 (48.4%) to 2015–2016 (45.5%).
However, more in line with our findings, hypertension control defined as systolic BP <140 mm Hg and diastolic BP <90 mm Hg improved among individuals with hypertension from 1999 to 2010, but then did not change through 2016.24 Similarly, another analysis of NHANES data reported that, among US adults taking prescription medication for hypertension, the age‐standardized prevalence of uncontrolled hypertension (systolic BP ≥140 mm Hg or diastolic BP ≥90 mm Hg) decreased from 38% in 2003 to 30% in 2012.25 These findings24, 25 and our results align with another NHANES analysis, which reported that, among individuals with hypertension, use of antihypertensive medication and use of multiple antihypertensive medications increased from 2001 to 2010.26 Similarly, we observed an increase in age‐standardized prevalence of antihypertensive medication use, from 18.0% in 1999–2000 to 22.3% in 2015–2016. Compared with monotherapy, single‐pill combination and multiple‐pill combinations were associated with 55% and 26% greater likelihood of blood pressure control, respectively.26
Prior work comparing the 2017 guideline with earlier guidelines concluded that, among US adults, the 2017 guideline substantially increased hypertension prevalence and also the proportion of adults recommended antihypertensive treatment.14 Our findings of long‐term trends align with this recent report comparing current hypertension prevalence based on the 2017 guideline with earlier guidelines. We found a higher prevalence of hypertension based on the 2017 guideline than did analyses based on older hypertension guidelines.24, 25 Additionally, based on the 2017 guideline, the proportion of hypertension control among those with treated hypertension is lower than that based on earlier guidelines. From 1999 to 2016, based on the 2017 definitions, the prevalence of hypertension decreased and the proportion of control among those treated increased. However, among several subgroups, there was not improvement in the proportion of hypertension control in more recent years, which is similar to overall patterns observed using earlier definitions of hypertension control or uncontrolled hypertension.24, 25 Implementation of the 2017 guideline could potentially lead to further improvements, through improved hypertension awareness, encouragement of lifestyle modification, and, among those at high risk of CVD, the commencement or intensification of antihypertensive medication.14
Importantly, improvements in hypertension prevalence were not consistently observed among all subgroups. The improvement in hypertension prevalence from 1999 to 2016 was observed among individuals aged ≥60 years, but not among other age groups. Age‐standardized hypertension prevalence also decreased among non‐Hispanic whites but not among non‐Hispanic blacks or Mexican Americans. Additionally, the age‐standardized prevalence of hypertension increased among those with a history of CVD or ≥10% 10‐year risk of CVD.
This study has potential limitations. First, although guidelines recommend that BP measurements be taken at 2 separate visits, all NHANES BP measurements were taken at 1 visit. Therefore, the prevalence of hypertension at each time point might be overestimated, although the secular trends should be consistent. Second, because of sample size, we were unable to reliably estimate the proportion of controlled hypertension among some subgroups, such as 10‐year age groups. Third, we reported the proportion of controlled hypertension only among those currently on medication. This approach was chosen, as we thought it would not be as informative to estimate hypertension control among individuals who were not, at the time, classified as hypertensive (eg, individuals with systolic BP between 130 and 140 mm Hg). Finally, our definition of hypertension control does not take into account previously diagnosed hypertension that has been controlled by lifestyle changes, rather than medication.
In summary, based on the 2017 ACC/AHA hypertension guideline, the age‐standardized prevalence of hypertension decreased from 48.4% in 1999–2000 to 45.4% in 2015–2016 among US adults, although the absolute burden has consistently increased. In those receiving pharmacologic treatment for hypertension, the age‐standardized proportion of hypertension control increased from 25.6% in 1999–2000 to 43.5% in 2015–2016, although there have not been consistent improvements among all subgroups throughout the full period. These data emphasize the need of continuous efforts for the prevention and control of hypertension in the US general population.
Sources of Funding
This work was supported by the National Institute of General Medical Sciences (grant 1P20GM109036‐01A1).
Disclosures
Drs Dorans, Mills, and He report research support from the National Institutes of Health. Dr Liu has no disclosures to report.
(J Am Heart Assoc. 2018;7:e008888 DOI: 10.1161/JAHA.118.008888.)29858369
References
- 1. Danaei G, Ding EL, Mozaffarian D, Taylor B, Rehm J, Murray CJL, Ezzati M. The preventable causes of death in the United States: comparative risk assessment of dietary, lifestyle, and metabolic risk factors. PLoS Med. 2009;6:e1000058. [DOI] [PMC free article] [PubMed] [Google Scholar]
- 2. GBD 2015 Risk Factors Collaborators . Global, regional, and national comparative risk assessment of 79 behavioural, environmental and occupational, and metabolic risks or clusters of risks, 1990–2015: a systematic analysis for the Global Burden of Disease Study 2015. Lancet. 2016;388:1659–1724. [DOI] [PMC free article] [PubMed] [Google Scholar]
- 3. Mills KT, Bundy JD, Kelly TN, Reed JE, Kearney PM, Reynolds K, Chen J, He J. Global disparities of hypertension prevalence and control: a systematic analysis of population‐based studies from 90 countries. Circulation. 2016;134:441–450. [DOI] [PMC free article] [PubMed] [Google Scholar]
- 4. US Burden of Disease Collaborators . The state of US health, 1990–2010: burden of diseases, injuries, and risk factors. JAMA. 2013;310:591–608. [DOI] [PMC free article] [PubMed] [Google Scholar]
- 5. Forouzanfar MH, Liu P, Roth GA, Ng M, Biryukov S, Marczak L, Alexander L, Estep K, Hassen Abate K, Akinyemiju TF, Ali R, Alvis‐Guzman N, Azzopardi P, Banerjee A, Bärnighausen T, Basu A, Bekele T, Bennett DA, Biadgilign S, Catalá‐López F, Feigin VL, Fernandes JC, Fischer F, Gebru AA, Gona P, Gupta R, Hankey GJ, Jonas JB, Judd SE, Khang Y‐H, Khosravi A, Kim YJ, Kimokoti RW, Kokubo Y, Kolte D, Lopez A, Lotufo PA, Malekzadeh R, Melaku YA, Mensah GA, Misganaw A, Mokdad AH, Moran AE, Nawaz H, Neal B, Ngalesoni FN, Ohkubo T, Pourmalek F, Rafay A, Rai RK, Rojas‐Rueda D, Sampson UK, Santos IS, Sawhney M, Schutte AE, Sepanlou SG, Shifa GT, Shiue I, Tedla BA, Thrift AG, Tonelli M, Truelsen T, Tsilimparis N, Ukwaja KN, Uthman OA, Vasankari T, Venketasubramanian N, Vlassov VV, Vos T, Westerman R, Yan LL, Yano Y, Yonemoto N, Zaki MES, Murray CJL. Global burden of hypertension and systolic blood pressure of at least 110 to 115 mm Hg, 1990–2015. JAMA. 2017;317:165–182. [DOI] [PubMed] [Google Scholar]
- 6. Lewington S, Clarke R, Qizilbash N, Peto R, Collins R. Age‐specific relevance of usual blood pressure to vascular mortality: a meta‐analysis of individual data for one million adults in 61 prospective studies. Lancet. 2002;360:1903–1913. [DOI] [PubMed] [Google Scholar]
- 7. Wei Y‐C, George NI, Chang C‐W, Hicks KA. Assessing sex differences in the risk of cardiovascular disease and mortality per increment in systolic blood pressure: a systematic review and meta‐analysis of follow‐up studies in the United States. PLoS One. 2017;12:e0170218. [DOI] [PMC free article] [PubMed] [Google Scholar]
- 8. Bundy JD, Li C, Stuchlik P, Bu X, Kelly TN, Mills KT, He H, Chen J, Whelton PK, He J. Systolic blood pressure reduction and risk of cardiovascular disease and mortality: a systematic review and network meta‐analysis. JAMA Cardiol. 2017;2:775–781. [DOI] [PMC free article] [PubMed] [Google Scholar]
- 9. Whelton PK, Carey RM, Aronow WS, Casey DE Jr, Collins KJ, Dennison Himmelfarb C, DePalma SM, Gidding S, Jamerson KA, Jones DW, MacLaughlin EJ, Muntner P, Ovbiagele B, Smith SCJ, Spencer CC, Stafford RS, Taler SJ, Thomas RJ, Williams KA Sr, Williamson JD, Wright JT Jr. 2017 ACC/AHA/AAPA/ABC/ACPM/AGS/APhA/ASH/ASPC/NMA/PCNA Guideline for the prevention, detection, evaluation, and management of high blood pressure in adults: a report of the American College of Cardiology/American Heart Association Task Force on Clinical Practice Guidelines. Hypertension. 2018;71:e13–e115. DOI: 10.1161/HYP.0000000000000065 [DOI] [PubMed] [Google Scholar]
- 10. Chobanian AV, Bakris GL, Black HR, Cushman WC, Green LA, Izzo JLJ, Jones DW, Materson BJ, Oparil S, Wright JTJ, Roccella EJ; National Heart, Lung, and Blood Institute Joint National Committee on Prevention, Detection, Evaluation, and Treatment of High Blood Pressure; National High Blood Pressure Education Program Coordinating Committee . The Seventh Report of the Joint National Committee on Prevention, Detection, Evaluation, and Treatment of High Blood Pressure: the JNC 7 report. JAMA. 2003;289:2560–2572. [DOI] [PubMed] [Google Scholar]
- 11. James PA, Oparil S, Carter BL, Cushman WC, Dennison‐Himmelfarb C, Handler J, Lackland DT, LeFevre ML, MacKenzie TD, Ogedegbe O, Smith SC, Svetkey LP, Taler SJ, Townsend RR, Wright JT, Narva AS, Ortiz E. 2014 Evidence‐based guideline for the management of high blood pressure in adults: report from the panel members appointed to the Eighth Joint National Committee (JNC 8). JAMA. 2014;311:507–520. [DOI] [PubMed] [Google Scholar]
- 12. Qaseem A, Wilt TJ, Rich R, Humphrey LL, Frost J, Forciea MA. Pharmacologic treatment of hypertension in adults aged 60 years or older to higher versus lower blood pressure targets: a clinical practice guideline from the American College of Physicians and the American Academy of Family Physicians. Ann Intern Med. 2017;166:430–437. [DOI] [PubMed] [Google Scholar]
- 13. SPRINT Research Group , Wright JT, Williamson JD, Whelton PK, Snyder JK, Sink KM, Rocco M V, Reboussin DM, Rahman M, Oparil S, Lewis CE, Kimmel PL, Johnson KC, Goff DC, Fine LJ, Cutler JA, Cushman WC, Cheung AK, Ambrosius WT. A randomized trial of intensive versus standard blood‐pressure control. N Engl J Med. 2015;373:2103–2116. [DOI] [PMC free article] [PubMed] [Google Scholar]
- 14. Muntner P, Carey RM, Gidding S, Jones DW, Taler SJ, Wright JTJ, Whelton PK. Potential U.S. population impact of the 2017 American College of Cardiology/American Heart Association high blood pressure guideline. J Am Coll Cardiol. 2018;71:109–118.29146532 [Google Scholar]
- 15. Zipf G, Chiappa M, Porter KS, Ostchega Y, Lewis BG, Dostal J. National health and nutrition examination survey: plan and operations, 1999–2010. Vital Health Stat. 2013;1:1–37. [PubMed] [Google Scholar]
- 16. American Diabetes Association . Diagnosis and classification of diabetes mellitus. Diabetes Care. 2010;33(suppl 1):S62–S69. [DOI] [PMC free article] [PubMed] [Google Scholar]
- 17. Levey AS, Stevens LA, Schmid CH, Zhang YL, Castro AF III, Feldman HI, Kusek JW, Eggers P, Van Lente F, Greene T, Coresh J. A new equation to estimate glomerular filtration rate. Ann Intern Med. 2009;150:604–612. [DOI] [PMC free article] [PubMed] [Google Scholar]
- 18. Goff DC, Lloyd‐Jones DM, Bennett G, Coady S, D'Agostino RB, Gibbons R, Greenland P, Lackland DT, Levy D, O'Donnell CJ, Robinson JG, Schwartz JS, Shero ST, Smith SC, Sorlie P, Stone NJ, Wilson PWF. 2013 ACC/AHA guideline on the assessment of cardiovascular risk: a report of the American College of Cardiology/American Heart Association Task Force on Practice Guidelines. Circulation. 2014;129:S49–S73. [DOI] [PubMed] [Google Scholar]
- 19. Ostchega Y, Dillon CF, Lindle R, Carroll M, Hurley BF. Isokinetic leg muscle strength in older Americans and its relationship to a standardized walk test: data from the National Health and Nutrition Examination Survey 1999–2000. J Am Geriatr Soc. 2004;52:977–982. [DOI] [PubMed] [Google Scholar]
- 20. Howden L, Meyer J. Age and sex composition: 2010. 2010 Census Briefs. May 2011. Washington, DC: US Census Bureau; 2011. [Google Scholar]
- 21. Crim MT, Yoon SS, Ortiz E, Wall HK, Schober S, Gillespie C, Sorlie P, Keenan N, Labarthe D, Hong Y. National surveillance definitions for hypertension prevalence and control among adults. Circ Cardiovasc Qual Outcomes. 2012;5:343–351. [DOI] [PMC free article] [PubMed] [Google Scholar]
- 22. National Cancer Institute . Joinpoint trend analysis software (Version 4.5.0.1). 2017. Available at: https://surveillance.cancer.gov/joinpoint/. Accessed November 21, 2017.
- 23. Kim HJ, Fay MP, Feuer EJ, Midthune DN. Permutation tests for joinpoint regression with applications to cancer rates. Stat Med. 2000;19:335–351. [DOI] [PubMed] [Google Scholar]
- 24. Fryar CD, Ostchega Y, Hales CM, Zhang G, Kruszon‐Moran D. Hypertension prevalence and control among adults: United States, 2015–2016. NCHS data brief, no 289. Hyattsville, MD: National Center for Health Statistics; 2017. [PubMed] [Google Scholar]
- 25. Yoon SS, Gu Q, Nwankwo T, Wright JD, Hong Y, Burt V. Trends in blood pressure among adults with hypertension United States, 2003 to 2012. Hypertension. 2015;65:54–61. [DOI] [PMC free article] [PubMed] [Google Scholar]
- 26. Gu Q, Burt VL, Dillon CF, Yoon S. Trends in antihypertensive medication use and blood pressure control among United States adults with hypertension: the National Health and Nutrition Examination Survey, 2001 to 2010. Circulation. 2012;126:2105–2114. [DOI] [PubMed] [Google Scholar]