

Abstract
Background
Few data exist on resource utilization with pediatric ventricular assist devices (VADs). We tested the hypothesis that device type and adverse events are associated with increased resource utilization in pediatric patients supported with VADs.
Methods and Results
The Pediatric Interagency Registry for Mechanically Assisted Circulatory Support, a national registry of VADs in patients <19 years old, and the Pediatric Health Information System, an administrative database, were merged. Univariate analysis was performed assessing the association of all factors with the total cost and length of stay first. Significant variables (P<0.05) were subjected to multivariable analysis. The study included 142 patients from 19 centers with VAD implants from October 2012 to June 2016. The median age was 9 years (interquartile range [IQR] 2‐15), 84 (59%) supported with a continuous‐flow VAD. Overall median hospital costs were $750 000 (IQR $539 000 to $1 100 000) with a median hospital length of stay of 81 days (IQR 54‐128). On multivariable analysis, device type and postoperative complications were not associated with resource utilization. Factors associated with increased costs included patient age, lower‐volume VAD center, being intubated, being on extracorporeal membrane oxygenation, number of complex chronic medical conditions, and length of stay. Among continuous‐flow VAD patients, discharge to home before transplant versus remaining hospitalized was associated with lower hospital costs (median $600 000 [IQR $400 000 to $820 000] versus median $680 000 [IQR $500 000 to $970 000], P=0.03).
Conclusion
VADs in pediatric patients are associated with high resource utilization. Increased resource utilization was associated with lower‐volume VAD centers, disease severity at VAD implantation, and the presence of complex chronic medical conditions. Further study is needed to develop cost‐effective strategies in this complex population.
Keywords: cost, pediatric, ventricular assist device, resource utilization
Subject Categories: Heart Failure, Cost-Effectiveness
Clinical Perspective
What Is New?
The authors describe for the first time combining multicenter patient registry and administrative databases, the hospital costs associated with ventricular assist devices in children, and factors that are associated with costs.
The costs were quite high and much higher than has been reported from adults who undergo placement of a ventricular assist device.
What Are the Clinical Implications?
The application of ventricular assist devices more broadly to children with advanced heart failure has been a tremendous clinical advancement, with the overall excellent survival to heart transplantation.
However, as is revealed from this study, the costs associated with this therapy are great.
Several factors were identified that are independently associated with increased costs, some of which are potentially modifiable.
One potentially modifiable factor is length of hospital stay and being discharged home on appropriate devices.
Further study is needed to understand cost‐effective strategies for this patient population.
Introduction
The costs associated with heart failure are substantial. The total cost of care for heart failure among adults in the United States was over $30 billion in 2012 and is expected to rise to nearly $70 billion by 2030.1 Worldwide it is estimated that the current cost of heart failure is over $100 billion.2 Advanced heart failure care, including ventricular assist devices (VADs), is associated with high resource utilization.3, 4, 5, 6 VAD use is becoming increasingly common in children with advanced heart failure.7, 8 In the most recent Registry Report from the International Society for Heart and Lung Transplantation, nearly 50% of children with dilated cardiomyopathy were bridged to heart transplantation on some form of mechanical circulatory support, with the vast majority supported with a left ventricular assist device.9 Although the overall survival of pediatric patients supported with VADs has improved and is similar to adult VAD patients for certain devices, there are few data on the costs associated with VAD use in pediatric patients.10, 11, 12
Interpretation of outcomes of children implanted with VADs in the context of cost is of significant interest to patients, providers, payers, and policy makers. A more complete understanding of the drivers of costs for pediatric patients supported with VADs may help to develop more effective cost‐containment strategies and prioritize resources. Therefore, we aimed to describe hospital costs and lengths of stay (LOS) in a contemporary cohort of pediatric patients supported with VADs and test the hypothesis that device type and complications would be associated with increased resource utilization. By merging a clinical database with an administrative database, we were able to assess factors associated with costs that would not have been possible by evaluations of the databases separately.13
Methods
The data, analytic methods, and study materials are available to other researchers for purposes of reproducing the results or replicating the procedure. The procedures for requesting data from the Pediatric Interagency Registry for Mechanically Assisted Circulatory Support (PediMACS) can be accessed through The Society for Thoracic Surgery Research Center.14
Study Cohort
PediMACS is a National Heart, Lung, and Blood Institute–sponsored national registry for temporary and durable VADs that are approved by the US Food and Drug Administration. The database includes comprehensive demographic and clinical data at the time of implant as well as serially during follow‐up.7, 15 PediMACS started prospective pediatric enrollment in 2012 and now has >400 patients enrolled from over 37 medical centers. As of February 2015, 65% of patients enrolled in PediMACS were implanted at hospitals that participate in the Pediatric Health Information System (PHIS; Children's Hospital Association, Lenexa, KS). PHIS is an administrative database containing clinical and resource utilization data for inpatient, emergency department, ambulatory surgery, and observation unit patient encounters from 48 not‐for‐profit, tertiary‐care pediatric hospitals in the United States, representing 85% of freestanding children's hospitals.16 Each patient in PHIS is assigned a unique identifier allowing records to be longitudinally linked. Details about the PHIS database have been reported previously.17 This study included all patients from PediMACS with durable VADs placed from September 2012 through June 2016. We merged the data from PediMACS with PHIS using a stepwise matching algorithm that used indirect identifiers including hospital ID, sex, birth date, and implant date. Li et al described similar methods for merging clinical trial data with daily billing data from PHIS.18 Patients who were enrolled in PediMACS but not matched in the inpatient PHIS database were excluded. The internal review board of the Children's Hospital of Pennsylvania in Philadelphia approved the study protocol. All data were deidentified, and thus, informed consent was not obtained.
Outcomes Definitions
The treatment course was defined from the first day of the hospitalization of VAD implant through hospital discharge after 1 of 3 primary outcomes: death; transplantation; or device explantation for recovery. These primary outcomes were obtained from PediMACS. Overall resource utilization includes total length of hospital stay, total length of intensive care unit stay, and total inpatient cost (including room and board, pharmacy, laboratory, clinical services, supply, and imaging) during the entire treatment course. These resource utilization data were obtained from PHIS.
Covariates
Patient demographic and clinical information included age at time of VAD implantation (<1, 1‐5, 6‐10, and >10 years), sex, race, payers for the cost (private, government, or other), region, weight (<20, 20‐40, 41‐60, and >60 kg). Center volume categories were defined by median of patient volume, cardiac diagnosis (cardiomyopathy, myocarditis, congenital heart disease, or other), previous cardiac operation, intubation, extracorporeal membrane oxygenation (ECMO) preceding VAD, patient profile (cardiogenic shock; progressive decline; stable but inotrope dependent; resting symptoms or less sick). Complex chronic conditions (CCCs) were defined as medical conditions expected to last at least 12 months and that involved either several different organ systems or 1 organ system severely enough to require specialty pediatric care and hospitalization in a tertiary‐care center. To identify whether an individual was diagnosed with a CCC, we used a previously published classification scheme based on International Classification of Diseases, Ninth and Tenth Revisions, Clinical Modification (ICD‐9‐CM, ICD‐10‐CM), codes that divide cases into CCC subcategories.19 We also counted the CCC subcategories (0, 1‐2, ≥3). Major adverse events were defined as any infection, bleeding, device malfunction, neurological dysfunction, or death, using PediMACS definitions as previously reported.20 We also counted the major adverse events (0, 1‐2, ≥3).
PHIS Adjusted Inpatient Costs
The wage and price index (published annually in the Federal Register) adjusted charges for each unit of service, and annual hospital‐ and department‐specific ratio of cost to charge were obtained from PHIS. Adjusted inpatient treatment costs were calculated by multiplying the adjusted charge by the relevant ratio of cost to charge, which was then further inflated to 2016 US dollars using the medical care services component of the Consumer Price Index.21 Costs for each day of hospitalization were summarized into the following categories: room and board, pharmacy, laboratory, clinical services (eg, respiratory, rehabilitative services), supply, and imaging. Adjusted overall cost and total costs for each category were calculated for each patient as the sum of the daily costs during the entire treatment course. The current analyses include direct medical costs accrued during inpatient admissions to PHIS hospitals. Outpatient costs, indirect costs, and costs accrued at non‐PHIS hospitals were not captured.
Statistical Analyses
Baseline demographic and clinical data are expressed as number with percentage or as median value with interquartile range (IQR), as appropriate. Differences in baseline characteristics between patients with continuous‐flow VAD and patients with pulsatile‐flow VAD were assessed with χ2 tests or with the Wilcoxon rank‐sum tests, as appropriate. Lengths of hospital stay were summarized as median (IQR) and compared by VAD flow characteristic using adjusted least‐squares mean length of hospital stay ratio with corresponding 95% confidence intervals, which were calculated using generalized linear models with a log link and gamma distribution.
PHIS adjusted inpatient treatment costs (for the entire treatment course, including rehospitalizations if discharged before transplant, death, or VAD explant, and by flow characteristic of VAD) were summarized in box‐and‐whisker plots. Generalized linear models with a log link and gamma distribution were used to calculate unadjusted and adjusted cost ratios with corresponding 95% confidence interval for comparisons of total inpatient cost per patient between flow characteristic of VAD and patient characteristics. Univariate analysis was performed assessing the association of all factors with the total cost and length of stay first. Significant variables (P<0.05) were then subjected to multivariable analysis. In this way we selected 16 variables instead of all available variables in the multivariable models to reduce the risk of overfitting the data. Robust variance estimates were obtained using generalized estimating equation methods with an exchangeable correlation matrix to account for clustering by hospital. All data management and statistical analyses were performed using SAS (version 9.4, SAS Institute, Inc, Cary, NC). A 2‐sided P<0.05 was used as the threshold for statistical significance.
Results
During the study period, 351 patients with VAD implants were reported to PediMACS (Figure 1). Of these, 228 patients (65%) were at PHIS hospitals, and 202 patients could be matched in PHIS and PediMACS (89% of eligible patients). Sixty patients were excluded, including 24 patients who were still on support and did not reach a primary end point and 36 patients who were supported with a temporary VAD alone. The remaining 142 patients supported with a durable VAD implanted at 1 of 19 centers comprisedthe study cohort. Baseline demographic and clinical data are shown in Table 1. The overall median age at device implant was 9 years (IQR 2‐15 years), and most patients (n=137, 97%) were implanted as a bridge to transplant. The most common underlying diagnosis was cardiomyopathy (n=94, 66%), and the majority were supported with a left ventricular assist device (n=126, 89%).
Figure 1.
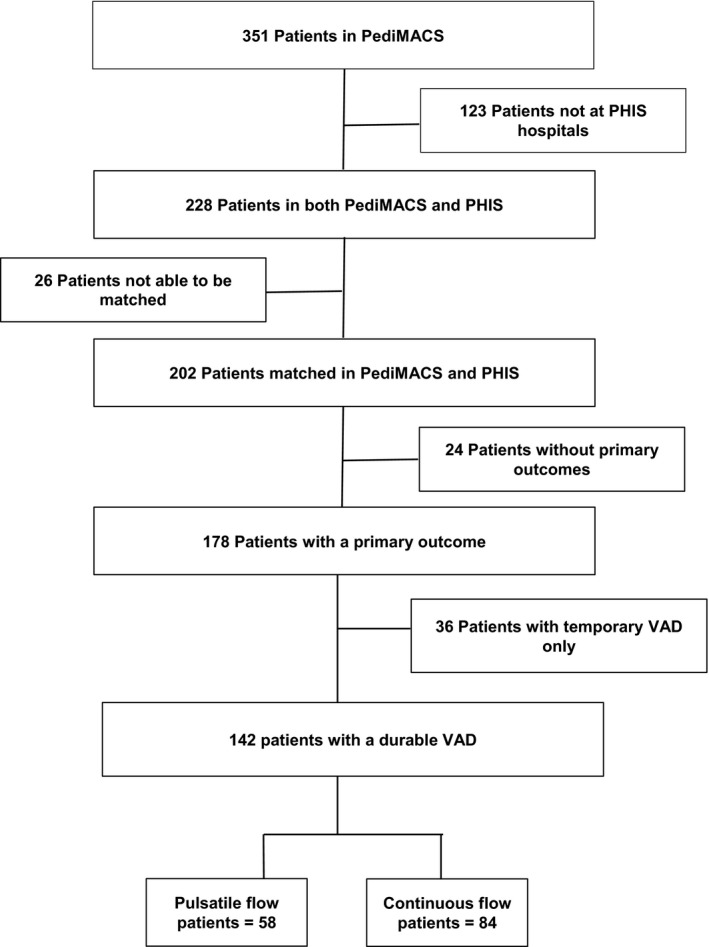
Patient cohort. PediMACS indicates Pediatric Interagency Registry for Mechanically Assisted Circulatory Support; PHIS, Pediatric Health Information System; VAD, ventricular assist device.
Table 1.
Patient Demographic and Clinical Characteristics at Time of VAD Implantation by Type of Durable VAD
| Characteristics | All (n=142) | Pulsatile Flow (n=58) | Continuous Flow (n=84) | P Value |
|---|---|---|---|---|
| Age, y | 9 (2‐15) | 1 (0‐3) | 14 (10‐16) | <0.001 |
| Age group, y | ||||
| <1 | 23 (16) | 23 (40) | 0 (0) | <0.001 |
| 1 to 5 | 31 (22) | 27 (46) | 4 (5) | |
| 6 to 10 | 28 (20) | 7 (12) | 21 (25) | |
| >10 | 60 (42) | 1 (2) | 59 (70) | |
| Female | 53 (37) | 29 (50) | 24 (29) | 0.0095 |
| Implanted year | ||||
| 2012 | 9 (6) | 5 (9) | 4 (5) | 0.74 |
| 2013 | 39 (28) | 17 (29) | 22 (26) | |
| 2014 | 39 (28) | 17 (29) | 22 (26) | |
| 2015 | 46 (32) | 16 (28) | 30 (36) | |
| 2016 | 9 (6) | 3 (5) | 6 (7) | |
| Race | ||||
| White | 84 (59) | 34 (59) | 50 (60) | 0.51 |
| Black | 31 (22) | 15 (26) | 16 (19) | |
| Other | 27 (19) | 9 (5) | 18 (21) | |
| Primary payer | ||||
| Medicaid and other government | 77 (54) | 38 (66) | 39 (46) | 0.07 |
| Private insurance | 60 (42) | 18 (31) | 42 (50) | |
| Other | 5 (4) | 2 (3) | 3 (4) | |
| Region | ||||
| Midwest | 40 (28) | 16 (28) | 24 (29) | 0.0133 |
| Northeast | 28 (20) | 5 (9) | 23 (27) | |
| South | 40 (28) | 23 (40) | 17 (20) | |
| West | 34 (24) | 14 (24) | 20 (24) | |
| Hospital patient volume | ||||
| Number of VADs <10 | 60 (42) | 23 (38) | 37 (62) | 0.60 |
| Number of VADs ≥10 | 82 (58) | 35 (43) | 47 (57) | |
| Weight, kg | 28 (11‐60) | 10 (7‐14) | 55 (32‐75) | <0.0001 |
| Weight, kg | ||||
| <20 | 56 (39) | 51 (88) | 5 (6) | <0.0001 |
| 20 to 40 | 29 (20) | 5 (8) | 24 (29) | |
| 41 to 60 | 21 (15) | 1 (2) | 20 (24) | |
| >60 | 36 (25) | 1 (2) | 35 (41) | |
| BSA, m2 | 1.0 (0.5‐1.6) | 0.5 (0.3‐0.6) | 1.6 (1.2‐1.9) | <0.0001 |
| Cardiac diagnosis | ||||
| Cardiomyopathy | 94 (66) | 34 (59) | 60 (71) | 0.37 |
| Myocarditis | 17 (12) | 9 (15) | 8 (10) | |
| Congenital heart disease | 23 (16) | 12 (21) | 11 (13) | |
| Other | 8 (6) | 3 (5) | 5 (6) | |
| Previous cardiac operation | 49 (34) | 28 (48) | 21 (25) | 0.0041 |
| Intubated | 65 (46) | 43 (74) | 22 (26) | <0.0001 |
| ECMO before VAD | 31 (22) | 19 (33) | 12 (14) | 0.0088 |
| Patient profile | ||||
| 1. Cardiogenic shock | 35 (25) | 15 (26) | 20 (23) | 0.93 |
| 2. Progressive decline | 87 (61) | 34 (59) | 53 (63) | |
| 3. Stable, but inotrope dependent | 14 (10) | 6 (10) | 8 (10) | |
| 4 to 7. Resting symptoms or less sick | 6 (4) | 3 (5) | 3 (4) | |
| CCC subcategories | ||||
| Neuromuscular CCC | 43 (30) | 25 (43) | 18 (21) | 0.0057 |
| Metabolic CCC | 72 (51) | 34 (59) | 38 (45) | 0.12 |
| Malignancy CCC | 17 (12) | 8 (14) | 9 (11) | 0.58 |
| Neonatal/prematurity CCC | 10 (7) | 8 (14) | 2 (2) | 0.0090 |
| Respiratory CCC | 15 (11) | 8 (14) | 7 (8) | 0.29 |
| Other congenital or genetic CCC | 14 (10) | 9 (15) | 5 (6) | 0.06 |
| Renal CCC | 46 (32) | 16 (28) | 30 (36) | 0.31 |
| Gastrointestinal CCC | 35 (25) | 22 (38) | 13 (15) | 0.0023 |
| Hematologic or immunologic CCC | 34 (24) | 12 (21) | 22 (26) | 0.45 |
| Number CCCs | ||||
| 0 | 22 (15) | 4 (7) | 18 (21) | 0.05 |
| 1 to 2 | 75 (53) | 32 (55) | 43 (51) | |
| ≥3 | 45 (32) | 22 (38) | 23 (27) | |
| Creatinine, mg/dL | 0.7 (0.4‐0.9) | 0.4 (0.3‐0.6) | 0.8 (0.6‐1.0) | <0.0001 |
| eGFR, mL/min per 1.73 m2 | 80 (58‐105) | 81 (55‐112) | 79 (60‐101) | 0.54 |
| BUN, mg/dL | 21 (15‐30) | 21 (12‐39) | 20 (16‐28) | 0.49 |
| Sodium, meq/L | 137 (133‐140) | 138 (134‐142) | 136 (133‐139) | 0.14 |
| Potassium, meq/L | 3.8 (3.4‐4.1) | 3.7 (3.1‐4.1) | 3.8 (3.4‐4.2) | 0.33 |
| AST, U/L | 41 (28‐79) | 45 (29‐124) | 37 (27‐73) | 0.15 |
| ALT, U/L | 43 (31‐91) | 43 (31‐105) | 45 (30‐91) | 0.16 |
| BNP, pg/mL | 1706 (841‐3176) | 2753 (1160‐4491) | 1371 (684‐2545) | 0.0030 |
| NT‐BNP, pg/mL | 7554 (2193‐16 850) | 19 852 (5510‐30 000) | 4851 (964‐11 047) | 0.0043 |
| Albumin, g/dL | 3.4 (3.0‐3.9) | 3.4 (2.8‐3.7) | 3.5 (3.1‐3.9) | 0.0285 |
| WBC, cells ×103/μL | 10.1 (7.8‐13.0) | 10.9 (8.6‐14.4) | 8.6 (6.8‐11.7) | 0.0352 |
| Hemoglobin, g/dL | 11.5 (10.7‐12.9) | 11.3 (10.3‐12.9) | 11.7 (10.9‐12.8) | 0.37 |
| Platelets, ×103/μL | 219 (146‐295) | 216 (138‐289) | 224 (165‐296) | 0.72 |
| INR | 1.3 (1.2‐1.5) | 1.2 (1.1‐1.5) | 1.3 (1.2‐1.6) | 0.10 |
| LDH, units/L | 328 (277‐474) | 406 (302‐541) | 316 (247‐468) | 0.71 |
| Total bilirubin, mg/dL | 1.0 (0.6‐1.5) | 0.8 (0.4‐1.2) | 1.1 (0.6‐1.7) | 0.75 |
| Preimplant device strategy | ||||
| Bridge to recovery | 3 (2) | 0 (0) | 3 (4) | 0.08 |
| Bridge to transplant | 137 (97) | 56 (97) | 81 (96) | |
| Destination therapy | 2 (1) | 2 (3) | 0 (0) | |
| Preimplant device type | ||||
| LVAD | 126 (89) | 47 (81) | 79 (94) | 0.08 |
| RVAD | 3 (2) | 2 (3) | 1 (1) | |
| BiVAD | 11 (8) | 7 (12) | 4 (5) | |
| TAH | 2 (1) | 2 (3) | 0 (0) | |
Data are expressed as median (interquartile range) for continuous variables, count (%) for categorical variables; P values reflect comparisons between the pulsatile flow and continuous flow VADs. ALT indicates alanine aminotransferase; AST, aspartate aminotransferase; BiVAD, biventricular assist device; BNP, B‐type natriuretic peptide; BSA, body surface area; BUN, blood urea nitrogen; CCC, complex chronic condition; ECMO, extracorporeal membrane oxygenation; eGFR, estimated glomerular filtration rate; INR, international normalized ratio; LDH, lactate dehydrogenase; LVAD, left ventricular assist device; NT‐BNP, N‐terminal pro‐BNP; RVAD, right ventricular assist device; TAH, total artificial heart; VAD, ventricular assist device; WBC, white blood cells.
Pulsatile‐ Versus Continuous‐Flow VADs
There were significant differences in patient characteristics between patients supported with pulsatile‐flow versus continuous‐flow VADs. Patients on pulsatile‐flow VADs were more likely to be younger, weigh less, have a previous cardiac operation, be placed on ECMO before VAD, and have more complex chronic diseases compared to patients on continuous‐flow VADs (P<0.05 for all) (Table 1). More patients on pulsatile‐flow VADs had an underlying diagnosis of congenital heart disease (n=12, 21%) compared to continuous‐flow VAD patients (n=11, 13%), but this did not reach statistical significance (P=0.37).
Favorable outcomes (transplant or explant for recovery) were similar between patients supported with a continuous‐flow (n=76, 90%) and a pulsatile‐flow VAD (n=47, 81%) (P=0.1) (Table 2). Patients with pulsatile‐flow devices, however, were more likely to have device malfunction (31% versus 13%, P<0.01) and neurologic dysfunction (32% versus 14%, P<0.01) compared to those with continuous‐flow devices. Pulsatile‐flow VADs had more major adverse events. Intensive care unit LOS, hospital LOS, and total costs were increased with pulsatile‐flow versus continuous‐flow VADs (P<0.05 for all). After adjustment by age, CCCs, and other baseline characteristics, there were no differences in ICU LOS, hospital LOS, or total costs between the use of pulsatile‐flow and continuous‐flow VADs (Tables 3 and 4).
Table 2.
Unadjusted Outcomes of Patients From Hospitalization of VAD Implant Through Primary Outcomes by Type of Durable VAD
| Outcomes | Pulsatile Flow (n=58) | Continuous Flow (n=84) | P Value |
|---|---|---|---|
| Primary outcomes | |||
| Death | 11 (19) | 8 (9) | 0.10 |
| Transplant/ explant | 47 (81) | 76 (91) | |
| Major adverse events | |||
| Infection | 15 (25) | 17 (20) | 0.43 |
| Bleeding | 16 (26) | 17 (20) | 0.31 |
| Device malfunction | 18 (31) | 11 (13) | 0.0091 |
| Neurologic dysfunction | 19 (32) | 12 (14) | 0.0088 |
| Number of major adverse events | |||
| 0 | 14 (24) | 48 (57) | 0.0005 |
| 1 to 2 | 36 (62) | 28 (33) | |
| ≥3 | 8 (14) | 8 (10) | |
| Hospital LOS, d | 122 (76‐183) | 69 (49‐97) | <0.0001 |
| ICU LOS, d | 60 (36‐94) | 34 (23‐51) | <0.0001 |
| Total costs components, $ | |||
| Room and board | 360 561 (223 557‐553 490) | 214 818 (0.17‐0.33) | <0.0001 |
| Clinical services | 234 577 (129 165‐310 405) | 209 615 (143 248‐301 776) | 0.45 |
| Laboratory | 84 860 (64 071‐124 783) | 56 644 (39 928‐85 514) | <0.0001 |
| Imaging | 24 216 (12 401‐36 582) | 19 584 (12 221‐29 406) | 0.0120 |
| Pharmacy | 76 134 (49 173‐129 857) | 78 182 (49 007‐126 629) | 0.49 |
| Supply | 146 968 (87 783‐250 746) | 111 647 (81 846‐164 764) | 0.0035 |
| Total costs, $ | 1 015 036 (731 971‐1 338 074) | 699 341 (536 112‐966 203) | 0.0007 |
Data expressed as median (interquartile range) for continuous variables, count (%) for categorical variables; P values reflect comparisons between the pulsatile‐flow and continuous‐flow VADs. ICU indicates intensive care units; LOS, length of stay; VAD, ventricular assist device.
Table 3.
Comparisons of Length of Hospital Stay per Patient From Hospitalization of VAD Implant Through Primary Outcomes by Patient and VAD Characteristics
| Characteristics | Length of Hospital Stay (Days) Median (IQR) | Unadjusted LOS Ratio (95% CI) | P Value | Adjusted LOS Ratio (95% CI) | P Value |
|---|---|---|---|---|---|
| Age, y | |||||
| <1 | 111 (58‐183) | Reference | Reference | ||
| 1 to 5 | 123 (95‐182) | 1.24 (0.89‐1.72) | 0.19 | 1.43 (1.08‐1.89) | 0.0116 |
| 6 to 10 | 89 (60‐109) | 0.88 (0.63‐1.24) | 0.49 | 0.86 (0.52‐1.41) | 0.55 |
| >10 | 60 (46‐83) | 0.63 (0.47‐0.84) | 0.0021 | 0.73 (0.40‐1.35) | 0.32 |
| Sex | |||||
| Male | 77 (51‐137) | Reference | Reference | ||
| Female | 96 (60‐125) | 0.94 (0.75‐1.18) | 0.69 | 0.97 (0.81‐1.18) | 0.81 |
| Flow characteristics | |||||
| Continuous flow | 69 (49‐97) | Reference | Reference | ||
| Pulsatile flow | 122 (76‐183) | 1.65 (1.32‐2.03) | <0.0001 | 1.21 (0.83‐1.76) | 0.31 |
| Implanted year | |||||
| 2012 | 123 (108‐235) | Reference | Reference | ||
| 2013 | 72 (51‐107) | 0.67 (0.41‐1.07) | 0.09 | 1.08 (0.70‐1.66) | 0.71 |
| 2014 | 88 (58‐149) | 0.72 (0.45‐1.16) | 0.18 | 0.96 (0.63‐1.46) | 0.86 |
| 2015 | 76 (48‐116) | 0.62 (0.39‐0.99) | 0.0464 | 0.92 (0.60‐1.43) | 0.73 |
| 2016 | 77 (48‐125) | 0.55 (0.30‐1.00) | 0.05 | 0.98 (0.58‐1.60) | 0.94 |
| Race | |||||
| White | 78 (52‐132) | Reference | Reference | ||
| Black | 91 (58‐128) | 0.96 (0.73‐1.27) | 0.81 | 0.96 (0.76‐1.20) | 0.71 |
| Other | 99 (48‐126) | 1.08 (0.81‐1.44) | 0.57 | 0.95 (0.72‐1.24) | 0.72 |
| Primary payer | |||||
| Medicaid and other government | 92 (58‐128) | Reference | Reference | ||
| Private insurance | 72 (49‐125) | 0.92 (0.74‐1.15) | 0.47 | 1.12 (0.93‐1.36) | 0.20 |
| Other | 96 (82‐130) | 1.29 (0.71‐2.35) | 0.39 | 1.58 (0.95‐2.63) | 0.07 |
| Region | |||||
| Midwest | 87 (64‐113) | Reference | Reference | ||
| Northeast | 73 (59‐128) | 0.87 (0.63‐1.20) | 0.41 | 1.14 (0.81‐1.47) | 0.28 |
| South | 77 (44‐127) | 0.89 (0.67‐1.19) | 0.45 | 0.83 (0.65‐1.06) | 0.13 |
| West | 81 (54‐139) | 1.03 (0.76‐1.39) | 0.84 | 1.13 (0.85‐1.48) | 0.38 |
| Hospital patient volume | |||||
| Number of VADs <10 | 83 (58‐127) | Reference | Reference | ||
| Number of VADs ≥10 | 80 (50‐128) | 0.92 (0.74‐1.15) | 0.46 | 0.88 (0.72‐1.07) | 0.20 |
| Weight, kg | |||||
| <20 | 122 (76‐189) | Reference | Reference | ||
| 20 to 40 | 81 (58‐108) | 0.68 (0.52‐0.89) | 0.0053 | 1.16 (0.72‐1.85) | 0.54 |
| 41 to 60 | 57 (34‐69) | 0.40 (0.29‐0.54) | <0.0001 | 0.91 (0.50‐1.67) | 0.77 |
| >60 | 67 (48‐113) | 0.63 (0.49‐0.81) | 0.0004 | 1.36 (0.78‐2.40) | 0.29 |
| Cardiac diagnosis | |||||
| Cardiomyopathy | 72 (51‐111) | Reference | Reference | ||
| Myocarditis | 91 (62‐107) | 0.95 (0.68‐1.34) | 0.11 | 0.59 (0.36‐0.99) | 0.36 |
| Congenital heart disease | 126 (77‐172) | 1.26 (0.94‐1.70) | 0.80 | 1.01 (0.76‐1.35) | 0.92 |
| Other | 138 (67‐283) | 1.75 (1.10‐2.79) | 0.0178 | 1.46 (0.93‐2.31) | 0.09 |
| Previous cardiac operation | |||||
| No | 70 (50‐103) | Reference | Reference | ||
| Yes | 122 (76‐164) | 1.58 (1.27‐1.97) | <0.0001 | 1.10 (0.85‐1.42) | 0.45 |
| Intubated | |||||
| No | 70 (50‐112) | Reference | Reference | ||
| Yes | 99 (64‐156) | 1.23 (0.99‐1.53) | 0.05 | 1.06 (0.86‐1.31) | 0.59 |
| ECMO before VAD | |||||
| No | 77 (51‐123) | Reference | Reference | ||
| Yes | 103 (72‐195) | 1.44 (1.11‐1.86) | 0.0053 | 1.30 (0.97‐1.31) | 0.07 |
| Patient profile | |||||
| 1. Cardiogenic shock | 83 (48‐137) | Reference | Reference | ||
| 2. Progressive decline | 75 (51‐128) | 1.05 (0.81‐1.37) | 0.65 | 1.17 (0.90‐1.52) | 0.25 |
| 3. Stable but inotrope dependent | 104 (78‐123) | 1.14 (0.75‐1.71) | 0.53 | 1.47 (1.00‐2.16) | 0.05 |
| 4 to 7. Resting symptoms or less sick | 95 (49‐131) | 1.05 (0.59‐1.87) | 0.84 | 0.91 (0.54‐1.53) | 0.73 |
| Number CCCsa | |||||
| 0 | 57 (43‐72) | Reference | Reference | ||
| 1 to 2 | 77 (50‐112) | 1.50 (1.13‐1.98) | 0.0040 | 1.32 (1.02‐1.71) | 0.0337 |
| ≥3 | 126 (83‐202) | 2.60 (1.93‐3.50) | <0.0001 | 2.14 (1.60‐2.87) | <0.0001 |
| Number of major adverse events | |||||
| 0 | 69 (50‐103) | Reference | Reference | ||
| 1 to 2 | 101 (62‐155) | 1.45 (1.16‐1.81) | 0.0009 | 1.06 (0.87‐1.29) | 0.55 |
| ≥3 | 84 (53‐219) | 1.83 (1.30‐2.59) | 0.0006 | 1.03 (0.73‐1.44) | 0.87 |
Major adverse events were defined as any infection, bleeding, device malfunction, neurological dysfunction, and death. CCC indicates chronic complex conditions; CI, confidence interval; ECMO, extracorporeal membrane oxygenation; IQR, interquartile range; LOS, length of stay; VAD indicates ventricular assist device.
Linear trend with increasing number of CCCs or major adverse events, P<0.0001.
Table 4.
Comparisons of Total Inpatient Cost per Patient From Hospitalization of VAD Implant Through Primary Outcomes by Patient and VAD Characteristics
| Characteristics | Total Inpatient Cost ($) Median (IQR) | Unadjusted Cost Ratio (95% CI) | P Value | Adjusted Cost Ratio (95% CI) | P Value |
|---|---|---|---|---|---|
| Age, y | |||||
| <1 | 879 627 (639 000‐1 283 271) | Reference | Reference | ||
| 1 to 5 | 1 204 600 (847 145‐1 390 959) | 1.33 (0.99‐1.77) | 0.05 | 1.34 (1.15‐1.57) | 0.0002 |
| 6 to 10 | 744 061 (586 183‐1 029 973) | 0.99 (0.74‐1.33) | 0.95 | 1.31 (0.98‐1.75) | 0.06 |
| >10 | 685 600 (525 757‐961 031) | 0.86 (0.67‐1.12) | 0.27 | 1.60 (1.12‐2.28) | 0.0096 |
| Sex | |||||
| Male | 803 158 (568 845‐1 287 160) | Reference | Reference | ||
| Female | 847 145 (616 294‐1 075 459) | 0.89 (0.74‐1.08) | 0.24 | 1.07 (0.97‐1.20) | 0.16 |
| Flow characteristics | |||||
| Continuous flow | 699 341 (536 112‐966 203) | Reference | Reference | ||
| Pulsatile flow | 1015 036 (731 971‐1 338 074) | 1.35 (1.12‐1.61) | 0.0011 | 1.01 (0.82‐1.24) | 0.90 |
| Implanted year | |||||
| 2012 | 1 222 105 (876 766‐1 605 482) | Reference | Reference | ||
| 2013 | 700 415 (568 845‐1 021 739) | 0.74 (0.50‐1.09) | 0.13 | 1.02 (0.81‐1.29) | 0.85 |
| 2014 | 901 135 (712 793‐1 351 882) | 0.89 (0.60‐1.31) | 0.56 | 1.03 (0.83‐1.25) | 0.76 |
| 2015 | 801 340 (533 093‐991 525) | 0.67 (0.46‐0.98) | 0.04 | 0.87 (0.69‐1.11) | 0.26 |
| 2016 | 634 490 (454 953‐1 144 126) | 0.62 (0.38‐1.03) | 0.06 | 1.01 (0.75‐1.35) | 0.91 |
| Race | |||||
| White | 812 558 (585 358‐1 241 584) | Reference | Reference | ||
| Black | 836 934 (466 959‐1 144 754) | 0.87 (0.69‐1.10) | 0.25 | 0.87 (0.77‐0.99) | 0.0362 |
| Other | 970 488 (635 732‐1 204 600) | 1.02 (0.80‐1.29) | 0.86 | 1.17 (1.02‐1.35) | 0.0234 |
| Primary payer | |||||
| Medicaid and other government | 847 145 (577 108‐1 204 600) | Reference | Reference | ||
| Private insurance | 716 144 (574 346‐1 129 731) | 0.95 (0.79‐1.15) | 0.64 | 1.00 (0.90‐1.11) | 0.99 |
| Other | 961 919 (644 883‐1 321 062) | 1.26 (0.76‐2.07) | 0.36 | 1.38 (1.05‐1.82) | 0.0194 |
| Region | |||||
| Midwest | 869 872 (675 057‐1 222 144) | Reference | Reference | ||
| Northeast | 714 839 (497 148‐1 003 199) | 0.80 (0.62‐1.05) | 0.11 | 0.89 (0.72‐1.09) | 0.28 |
| South | 716 193 (460 906‐1 076 623) | 0.84 (0.66‐1.07) | 0.17 | 0.93 (0.81‐1.06) | 0.31 |
| West | 909 225 (635 732‐1 235 477) | 0.88 (0.68‐1.13) | 0.33 | 1.01 (0.86‐1.18) | 0.87 |
| Hospital volume | |||||
| Number of patients supported by VADs <10 | 893 496 (619 849‐1 312 617) | Reference | Reference | ||
| Number of patients supported by VADs ≥10 | 756 144 (546 750‐1 120 935) | 0.78 (0.65‐0.94) | 0.0080 | 0.82 (0.74‐0.91) | 0.0003 |
| Weight, kg | |||||
| <20 | 1 122 642 (725 968‐1 367 622) | Reference | Reference | ||
| 20 to 40 | 803 158 (630 154‐970 488) | 0.75 (0.60‐0.95) | 0.0198 | 0.99 (0.66‐1.49) | 0.98 |
| 41 to 60 | 623 405 (485 595‐731 971) | 0.54 (0.42‐0.71) | <0.0001 | 0.73 (0.45‐1.20) | 0.22 |
| >60 | 720 108 (542 941‐1 037 095) | 0.79 (0.63‐0.98) | 0.0330 | 0.98 (0.72‐1.35) | 0.94 |
| Cardiac diagnosis | |||||
| Cardiomyopathy | 738 552 (546 750‐1 059 317) | Reference | Reference | ||
| Myocarditis | 850 851 (616 294‐1 075 459) | 0.90 (0.68‐1.19) | 0.46 | 1.07 (0.81‐1.42) | 0.61 |
| Congenital heart disease | 1 135 115 (876 766) | 1.20 (0.94‐1.54) | 0.13 | 0.91 (0.72‐1.14) | 0.43 |
| Other | 1 209 657 (571 595‐2 146 593) | 1.53 (1.04‐2.26) | 0.0312 | 1.21 (0.84‐1.71) | 0.29 |
| Previous cardiac operation | |||||
| No | 698 266 (539 131‐961 267) | Reference | Reference | ||
| Yes | 1 077 788 (855 957‐1 423 258) | 1.60 (1.34‐1.91) | <0.0001 | 1.27 (1.10‐1.45) | 0.0007 |
| Intubated | |||||
| No | 664 827 (528 860‐982 464) | Reference | Reference | ||
| Yes | 970 939 (731 971‐1 344 286) | 1.30 (1.09‐1.56) | 0.0033 | 1.15 (1.02‐1.30) | 0.0243 |
| ECMO before VAD | |||||
| No | 739 801 (546 750‐1 120 935) | Reference | Reference | ||
| Yes | 1 059 317 (762 129‐1 427 789) | 1.51 (1.22‐1.86) | 0.0001 | 1.18 (1.01‐1.37) | 0.0347 |
| Patient profile | |||||
| 1. Cardiogenic shock | 855 957 (634 490‐1 344 286) | Reference | Reference | ||
| 2. Progressive decline | 767 110 (539 131‐1 135 115) | 0.90 (0.72‐1.11) | 0.34 | 1.03 (0.89‐1.19) | 0.67 |
| 3. Stable but inotrope dependent | 935 354 (643 972‐1 235 477) | 0.91 (0.65‐1.28) | 0.60 | 1.04 (0.84‐1.28) | 0.73 |
| 4 to 7. Resting symptoms or less sick | 1 128 543 (528 860‐1 390 959) | 0.99 (0.61‐1.60) | 0.97 | 1.02 (0.77‐1.35) | 0.86 |
| Number of CCCs | |||||
| 0 | 632 322 (539 131‐700 415) | Reference | Reference | ||
| 1 to 2 | 803 158 (508 700‐803 158) | 1.33 (1.11‐1.60) | 0.0019 | 1.09 (0.95‐1.26) | 0.20 |
| ≥3 | 1 222 105 (850 851‐1 548 253) | 1.78 (1.34‐2.37) | <0.0001 | 1.21 (1.02‐1.44) | 0.0264 |
| Number of major adverse events | |||||
| 0 | 699 341 (549 329‐970 488) | Reference | Reference | ||
| 1 to 2 | 889 187 (639 687‐1 329 568) | 1.33 (1.02‐1.49) | 0.0019 | 0.96 (0.86‐1.07) | 0.43 |
| ≥3 | 1 186 691 (591 241‐1 559 619) | 1.74 (1.36‐2.22) | <0.0001 | 1.03 (0.86‐1.23) | 0.76 |
| Length of hospital stay (days, quartiles)a | |||||
| First (6‐54) | 522 654 (419 071‐630 154) | Reference | Reference | ||
| Second (55‐82) | 645 055 (546 750‐862 979) | 1.38 (1.17‐1.62) | <0.0001 | 1.24 (1.08‐1.42) | 0.0016 |
| Third (83‐128) | 893 496 (841 764‐1 103 267) | 1.84 (1.57‐2.15) | <0.0001 | 1.65 (1.42‐1.92) | <0.0001 |
| Fourth (129‐577) | 1 392 633 (1 261 064‐1 392 633) | 3.32 (2.84‐3.89) | <0.0001 | 2.79 (2.36‐3.30) | <0.0001 |
Major adverse events were defined as any infection, bleeding, device malfunction, neurological dysfunction, and death. CCC indicates chronic complex conditions; CI, confidence interval; ECMO, extracorporeal membrane oxygenation; IQR, interquartile range; VAD, ventricular assist device.
Linear trend with increasing number of CCCs or major adverse events, P<0.0001.
Among patients on a continuous‐flow VAD, 29 (35%) were discharged home before the primary end point (death, transplant, VAD explant for recovery). Patients discharged home spent fewer total days in the hospital (median 60 days, IQR 49‐84) compared to patients who remained hospitalized (median 72, IQR 51‐102), but this did not reach statistical significance (P=0.07). Being discharged home was associated with decreased total costs ($600 296, IQR $480 019 to $816 081) compared to patients who remained hospitalized throughout their VAD course on a continuous‐flow VAD (median $674 276, IQR $480 019 to $816 081; P=0.03).
Length of Stay
The overall median intensive care unit LOS was 43 days (IQR 26‐68), and hospital LOS was 81 days (IQR 54‐128). Factors associated with hospital LOS are shown in Table 3. The number of CCCs was associated with LOS, with a median LOS of 57 days (IQR 43‐72 days) among patients with no CCC compared to a median LOS of 126 days (IQR 83‐202) among patients with ≥3 CCCs) (P<0.001) (Figure 2). The number of major adverse events was also associated with LOS, with a median LOS of 69 days (IQR 50‐99) among patients with no major adverse events compared to a median LOS of 114 days (IQR 64‐216) among patients with ≥3 major adverse events (P=0.0001) (Figure 2). On multivariable analysis, age group, patient profile at time of implant, and number of CCCs remained independently associated with hospital LOS.
Figure 2.
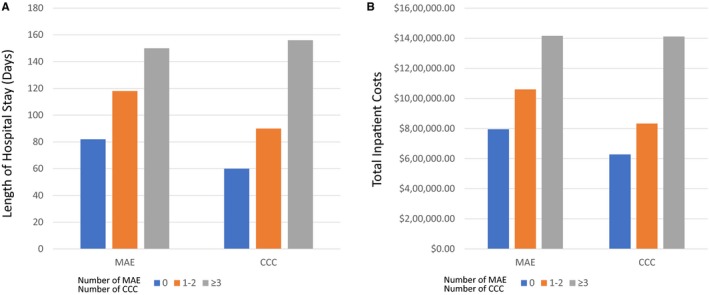
Comparisons of length of hospital stay (A) and total inpatient costs per patient (B) from hospitalization for VAD implant through primary outcomes by number of complex chronic conditions subcategories and major adverse events. CCC indicates complex chronic conditions; MAE, major adverse events; VAD, ventricular assist device.
Hospital Costs
The overall median hospital costs were $750 000 (IQR $530 000 to $1 100 000), and factors associated with hospital costs are depicted in Table 4. On multivariable analysis, factors associated with increased hospital costs included age, center implanting <10 VADs during the study period, previous cardiac operation, intubation at the time of VAD implantation, ECMO before VAD, hospital LOS, and number of CCCs. The median hospital costs among patients with no CCCs was $632 322 (IQR $539 131 to $700 415) versus $1 222 105 (IQR $850 851 to $1 548 253) among patients with ≥3 CCCs (P<0.001) (Figure 2). Device type, patient profile, and number of adverse events were not significantly associated with hospital costs after controlling for baseline characteristics (Table 4). Similar to total hospital costs, distributions of component costs did not differ by device type. Overall, room and board, clinical services, and supply (including VADs) were the major drivers of cost, accounting for more than 75% of the total cost per patient (Figure 3).
Figure 3.
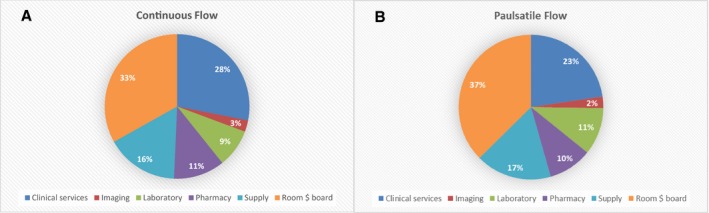
Distribution of component inpatient costs per patient from hospitalization for ventricular assist device implant through primary outcomes by flow characteristics of durable ventricular assist device.
Discussion
There are several important findings of this multicenter observational study that highlight some of the current challenges in pediatric advanced heart failure management. The use of VADs in pediatric patients was associated with high resource utilization, with most patients having a hospital LOS greater than 2.5 months, ICU LOS greater than 1.5 months, and total hospital costs of $750 000. These costs are 2‐ to 4‐fold greater than reported costs in adult VAD patients.3, 4, 5, 6 Additionally, hospital LOS after VAD placement in adults has been decreasing. Between 2008 and 2011, the mean LOS after VAD implant in the United States was 36 days, less than half the duration that was observed in children. Even in the context of surgery for complex congenital heart disease, the resource utilization in pediatric VAD patients is high. In the multicenter Single Ventricle Reconstruction Trial for hypoplastic left heart syndrome, the median postoperative hospital LOS was 24 days, a greater than 3‐fold decrease from what was observed in pediatric VAD patients.22
These findings should be interpreted in the context of current care for advanced heart failure in children. Most heart failure admissions, even without VAD placement, are prolonged and associated with high resource utilization, morbidity, and mortality.23, 24, 25, 26, 27 In a study of adult and pediatric cardiomyopathy patients admitted with heart failure, the pediatric patients had an average LOS of 16 days and average hospital charges of $116 000 compared to adults who averaged a LOS of 7 days and charges of $40 000.25 Additionally, mortality and morbidities such as respiratory failure and sepsis were also greater in children as compared to adults.25 The resource utilization is most pronounced among patients with congenital heart disease. A recent study of children with advanced heart failure and congenital heart disease reported a median hospital LOS of 42 days and hospital charges of over $650 000, with only a few of these children being treated with a VAD.27
VADs are also utilized in a different manner in children compared to adults. In children, the vast majority of VADs are used as bridge to heart transplantation, and most children remain hospitalized from the time of VAD implant through transplant.7 Destination therapy, which is just as common as bridge to transplantation in adults, is exceptionally uncommon in children.15 Only 4% of patients in PediMACS were implanted as destination therapy.7 Additionally, the Berlin Heart EXCOR VAD (Berlin Heart GmbH, Berlin, Germany), a pulsatile VAD and the only durable device available for infants and small children, does not have a driver approved for home use in the United States. Thus, all patients on these devices have to remain hospitalized. Importantly, even among children implanted with continuous‐flow VADs that would allow for home discharge, only the minority of patients were actually discharged home before transplant. There was a cost savings in sending pediatric patients home before transplant, but the savings were relatively modest with median costs of patients discharged home being 12% less than that of patients who remained hospitalized. This cost savings was likely not greater because the total days hospitalized were still high among patients discharged home (median 60 days) and not significantly less than that of patients who remained hospitalized (median 72 days). Discharging patients safely, in a timely manner, and preventing rehospitalizations are key proposed strategies for reducing healthcare costs in many populations, including heart failure patients, and would seem to hold promise for decreasing resource utilization in pediatric VAD patients.1
The pediatric advanced heart failure population is complex with a high degree of disease severity and multiple comorbidities being common at the time of VAD implantation. Nearly half of the patients were intubated, 22% were on ECMO, and 25% were in cardiogenic shock at VAD implantation. Additionally, chronic noncardiac medical conditions were common, with only 15% of patients having no chronic complex conditions and 32% having ≥3 chronic complex conditions. Perhaps not surprising given this degree of disease severity at the time of VAD implantation, major adverse events were common, with over 60% of patients experiencing at least 1 major adverse event. All of these factors, with the exception of being identified as being in cardiogenic shock, were associated with increased LOS and greater costs on univariable analysis. This is consistent with what has been described in other populations where chronic conditions, disease severity, and postoperative complications have all been associated with high resource utilization.28, 29, 30, 31, 32, 33
On multivariable analysis, several patient factors were associated with hospital LOS and/or total costs including age, being on ECMO, being intubated, having prior cardiac surgery, higher volume of VADs implanted, and the number of chronic complex conditions. Importantly, in controlling for baseline characteristics, there was no difference in resource utilization based on device type, underlying disease, and postoperative adverse events. It is important to note that the sequelae of major adverse events may vary among the different VADs. For example, a device exchange in a paracorporeal pulsatile VAD does not require a major operation as with an intracorporeal continuous‐flow device. Although there are specific definitions for adverse events in PediMACS,20 use of other definitions for adverse events may change the prevalence of some events. It is also possible that adverse events were underreported, as has been observed in other studies,34 but given that the majority of patients had at least 1 major adverse event, this suggests that patient and perhaps provider and institutional factors may be more important drivers of resource utilization in this population. As the field looks for strategies to improve the cost‐effectiveness of VADs, identifying best practices from high‐performing centers and targeting potentially modifiable risk factors, such as intubation and ECMO before VAD, would be reasonable starting points for quality improvement initiatives.
The merger of PHIS billing data with a National Heart, Lung, and Blood Institute–sponsored national registry for VADs establishes an enhanced data set that leverages the specific strengths of the individual data sources. First, PediMACS is approved by the Food and Drug Administration and contains detailed diagnostic, procedural, and other high‐quality clinical data. Second, hospital cost estimates from PHIS are considered to be quite reliable, as these data are used routinely by member hospitals for billing, fiscal planning, and practical optimization.35 These data are also widely used for cost and cost‐effectiveness research.36, 37, 38 Finally, the data‐merging process and estimation of patient‐level costs are efficient. These merged data sets provide opportunities for comparative effectiveness, cost, and cost‐effectiveness research efforts that are ongoing.
Limitations
There are several limitations of this study. Although PediMACS contains most of the VADs placed in pediatric patients in the United States, and PHIS is the largest administrative database of Children's Hospitals, the lack of resource utilization data on children who underwent VAD implantation at hospitals that do not participate in PHIS reduces the precision of resource utilization estimates. Additionally, it is possible that centers did not report all of their VAD patients to PediMACS, which could introduce some bias. Non‐PHIS institutes and non‐US sites may have different cost structures than PHIS institutes, and consequently, the data may not be generalizable to these centers or to other sites outside of the United States. Although 89% of eligible PediMACS patients were matched in PHIS in this study, there were only 142 patients supported with durable VADs in the cohort. We have to interpret the results with caution because of the relative small sample size, and significant associations may have been missed due to the lack of study power. Additionally, some factors are highly related, such as young age, device type, and remaining hospitalized before transplantation, and therefore challenging to describe the relative influence of each factor. As noted above, most patients remain hospitalized from VAD implantation through transplantation, so separating out the cost of the hospitalization attributed to VAD care versus transplant would be artificial and arbitrary. Only hospital costs were assessed, and the costs of outpatient care for the small number of patients discharged home were not available; and a result, the total cost of VAD care for these patients would be greater than reported here. Finally, these analyses are limited to direct hospital costs and do not include physician fees and other costs carried by patients and families.
Conclusions
The use of VADs in pediatric patients is associated with high resource utilization, with a hospital LOS >2.5 months and median hospital costs of $750 000. Increased resource utilization is associated with lower‐volume VAD centers, disease severity at the time of VAD implantation, and the presence of complex chronic medical conditions. These factors may decrease the likelihood of successful discharge before transplantation. Identifying best practices around timely hospital discharge and treatment of modifiable risk factors are potential avenues of further study to develop cost‐effective strategies in this complex population.
Sources of Funding
The PediMACS database is funded by a contract grant (HHSN268201100025C) from the National Heart, Lung, and Blood Institute.
Disclosures
Rossano reports consulting for HeartWare. The remaining authors have no disclosures to report.
(J Am Heart Assoc. 2018;7:e008380 DOI: 10.1161/JAHA.117.008380.)29858364
This article was handled independently by John S. Ikonomidis, MD, PhD, as a guest editor. The editors had no role in the evaluation of the manuscript or in the decision about its acceptance.
References
- 1. Heidenreich PA, Albert NM, Allen LA, Bluemke DA, Butler J, Fonarow GC, Ikonomidis JS, Khavjou O, Konstam MA, Maddox TM, Nichol G, Pham M, Pina IL, Trogdon JG; American Heart Association Advocacy Coordinating Committee, Council on Arteriosclerosis, Thrombosis, and Vascular Biology, Council on Cardiovascular Radiation and Intervention, Council on Clinical Cardiology, Council on Epidemiology and Prevention, Stroke Council . Forecasting the impact of heart failure in the United States: a policy statement from the American Heart Association. Circ Heart Fail. 2013;6:606–619. [DOI] [PMC free article] [PubMed] [Google Scholar]
- 2. Cook C, Cole G, Asaria P, Jabbour R, Francis DP. The annual global economic burden of heart failure. Int J Cardiol. 2014;171:368–376. [DOI] [PubMed] [Google Scholar]
- 3. Baras Shreibati J, Goldhaber‐Fiebert JD, Banerjee D, Owens DK, Hlatky MA. Cost‐effectiveness of left ventricular assist devices in ambulatory patients with advanced heart failure. JACC Heart Fail. 2017;5:110–119. [DOI] [PubMed] [Google Scholar]
- 4. Shah N, Agarwal V, Patel N, Deshmukh A, Chothani A, Garg J, Badheka A, Martinez M, Islam N, Freudenberger R. National trends in utilization, mortality, complications, and cost of care after left ventricular assist device implantation from 2005 to 2011. Ann Thorac Surg. 2016;101:1477–1484. [DOI] [PubMed] [Google Scholar]
- 5. Chimanji N, Kilic A, Hasan A, Higgins RS, Whitson BA, Kilic A. Institutional cost comparison between heart transplants and left ventricular assist device implantations. Exp Clin Transplant. 2016;14:656–659. [DOI] [PubMed] [Google Scholar]
- 6. Swartz MF, Angona R, Smith K, Kraenzlin F, Stypula CM, Joshi D, Tchantchaleishvili V, Hicks GL, Massey HT. Costs and outcomes in the care of bi‐ventricular support as a bridge to cardiac transplant. ASAIO J. 2016;62:513–517. [DOI] [PubMed] [Google Scholar]
- 7. Blume ED, Rosenthal DN, Rossano JW, Baldwin JT, Eghtesady P, Morales DL, Cantor RS, Conway J, Lorts A, Almond CS, Naftel DC, Kirklin JK, Pedi MI. Outcomes of children implanted with ventricular assist devices in the United States: first analysis of the Pediatric Interagency Registry for Mechanical Circulatory Support (PediMACS). J Heart Lung Transplant. 2016;35:578–584. [DOI] [PubMed] [Google Scholar]
- 8. Mansfield RT, Lin KY, Zaoutis T, Mott AR, Mohamad Z, Luan X, Kaufman BD, Ravishankar C, Gaynor JW, Shaddy RE, Rossano JW. The use of pediatric ventricular assist devices in children's hospitals from 2000 to 2010: morbidity, mortality, and hospital charges. Pediatr Crit Care Med. 2015;16:522–528. [DOI] [PubMed] [Google Scholar]
- 9. Rossano JW, Dipchand AI, Edwards LB, Goldfarb S, Kucheryavaya AY, Levvey BJ, Lund LH, Meiser B, Yusen RD, Stehlik J; International Society for Heart and Lung Transplantation . The Registry of the International Society for Heart and Lung Transplantation: Nineteenth Pediatric Heart Transplantation Report‐2016; Focus Theme: Primary Diagnostic Indications for Transplant. J Heart Lung Transplant. 2016;35:1185–1195. [DOI] [PubMed] [Google Scholar]
- 10. Rossano JW, Lorts A, VanderPluym CJ, Jeewa A, Guleserian KJ, Bleiweis MS, Reinhartz O, Blume ED, Rosenthal DN, Naftel DC, Cantor RS, Kirklin JK. Outcomes of pediatric patients supported with continuous‐flow ventricular assist devices: a report from the Pediatric Interagency Registry for Mechanical Circulatory Support (PediMACS). J Heart Lung Transplant. 2016;35:585–590. [DOI] [PubMed] [Google Scholar]
- 11. Morales DL, Zafar F, Rossano JW, Salazar JD, Jefferies JL, Graves DE, Heinle JS, Fraser CD Jr. Use of ventricular assist devices in children across the United States: analysis of 7.5 million pediatric hospitalizations. Ann Thorac Surg. 2010;90:1313–1318; discussion 1318–1319. [DOI] [PubMed] [Google Scholar]
- 12. Mahle WT, Ianucci G, Vincent RN, Kanter KR. Costs associated with ventricular assist device use in children. Ann Thorac Surg. 2008;86:1592–1597. [DOI] [PubMed] [Google Scholar]
- 13. Pasquali SK, Li JS, He X, Jacobs ML, O'Brien SM, Hall M, Jaquiss RD, Welke KF, Peterson ED, Shah SS, Gaynor JW, Jacobs JP. Perioperative methylprednisolone and outcome in neonates undergoing heart surgery. Pediatrics. 2012;129:e385–e391. [DOI] [PMC free article] [PubMed] [Google Scholar]
- 14. The Society of Thoracic Surgeons . STS research center. Available at: https://www.sts.org/registries-research-center/sts-research-center. Accessed April 26, 2018.
- 15. Kirklin JK, Naftel DC, Pagani FD, Kormos RL, Stevenson LW, Blume ED, Myers SL, Miller MA, Baldwin JT, Young JB. Seventh INTERMACS annual report: 15,000 patients and counting. J Heart Lung Transplant. 2015;34:1495–1504. [DOI] [PubMed] [Google Scholar]
- 16. Children's Hospital Association . Available at: http://www.chca.com. Accessed June 6, 2017.
- 17. Mongelluzzo J, Mohamad Z, Ten Have TR, Shah SS. Corticosteroids and mortality in children with bacterial meningitis. JAMA. 2008;299:2048–2055. [DOI] [PubMed] [Google Scholar]
- 18. Li Y, Hall M, Fisher BT, Seif AE, Huang YS, Bagatell R, Getz KD, Alonzo TA, Gerbing RB, Sung L, Adamson PC, Gamis A, Aplenc R. Merging Children's Oncology Group Data with an External Administrative Database Using Indirect Patient Identifiers: A Report from the Children's Oncology Group. PLoS One. 2015;10:e0143480. [DOI] [PMC free article] [PubMed] [Google Scholar]
- 19. Feudtner C, Feinstein JA, Zhong W, Hall M, Dai D. Pediatric complex chronic conditions classification system version 2: updated for ICD‐10 and complex medical technology dependence and transplantation. BMC Pediatr. 2014;14:199. [DOI] [PMC free article] [PubMed] [Google Scholar]
- 20. Rosenthal DN, Almond CS, Jaquiss RD, Peyton CE, Auerbach SR, Morales DR, Epstein DJ, Cantor RS, Kormos RL, Naftel DC, Butts RJ, Ghanayem NS, Kirklin JK, Blume ED. Adverse events in children implanted with ventricular assist devices in the United States: data from the Pediatric Interagency Registry for Mechanical Circulatory Support (PediMACS). J Heart Lung Transplant. 2016;35:569–577. [DOI] [PMC free article] [PubMed] [Google Scholar]
- 21. US Bureau of Labor Statistics . Consumer Price Index. Available at: http://www.bls.gov/cpi/. Accessed June 6, 2017.
- 22. Ohye RG, Sleeper LA, Mahony L, Newburger JW, Pearson GD, Lu M, Goldberg CS, Tabbutt S, Frommelt PC, Ghanayem NS, Laussen PC, Rhodes JF, Lewis AB, Mital S, Ravishankar C, Williams IA, Dunbar‐Masterson C, Atz AM, Colan S, Minich LL, Pizarro C, Kanter KR, Jaggers J, Jacobs JP, Krawczeski CD, Pike N, McCrindle BW, Virzi L, Gaynor JW; Pediatric Heart Network Investigators . Comparison of shunt types in the Norwood procedure for single‐ventricle lesions. N Engl J Med. 2010;362:1980–1992. [DOI] [PMC free article] [PubMed] [Google Scholar]
- 23. Nandi D, Lin KY, O'Connor MJ, Elci OU, Kim JJ, Decker JA, Price JF, Zafar F, Morales DL, Denfield SW, Dreyer WJ, Jefferies JL, Rossano JW. Hospital charges for pediatric heart failure‐related hospitalizations from 2000 to 2009. Pediatr Cardiol. 2016;37:512–518. [DOI] [PMC free article] [PubMed] [Google Scholar]
- 24. Nandi D, Rossano JW. Epidemiology and cost of heart failure in children. Cardiol Young. 2015;25:1460–1468. [DOI] [PMC free article] [PubMed] [Google Scholar]
- 25. Wittlieb‐Weber CA, Lin KY, Zaoutis TE, O'Connor MJ, Gerald K, Paridon SM, Shaddy RE, Rossano JW. Pediatric versus adult cardiomyopathy and heart failure‐related hospitalizations: a value‐based analysis. J Card Fail. 2015;21:76–82. [DOI] [PubMed] [Google Scholar]
- 26. Rossano JW, Kim JJ, Decker JA, Price JF, Zafar F, Graves DE, Morales DL, Heinle JS, Bozkurt B, Towbin JA, Denfield SW, Dreyer WJ, Jefferies JL. Prevalence, morbidity, and mortality of heart failure‐related hospitalizations in children in the United States: a population‐based study. J Card Fail. 2012;18:459–470. [DOI] [PubMed] [Google Scholar]
- 27. Burstein DS, Shamszad P, Almond CS, Price JF, Lin KY, O'Connor MJ, Shaddy RE, Mascio CE, Rossano JW. Hospitalization‐related resource utilization in congenital heart disease with advanced heart failure (abstract). J Heart Lung Transplant. 2017;36:S262. [Google Scholar]
- 28. Vogeli C, Shields AE, Lee TA, Gibson TB, Marder WD, Weiss KB, Blumenthal D. Multiple chronic conditions: prevalence, health consequences, and implications for quality, care management, and costs. J Gen Intern Med. 2007;22(suppl 3):391–395. [DOI] [PMC free article] [PubMed] [Google Scholar]
- 29. Chan T, Rodean J, Richardson T, Farris RW, Bratton SL, Di Gennaro JL, Simon TD. Pediatric critical care resource use by children with medical complexity. J Pediatr. 2016;177:197–203.e191. [DOI] [PubMed] [Google Scholar]
- 30. Mentz RJ, Mi X, Sharma PP, Qualls LG, DeVore AD, Johnson KW, Fonarow GC, Curtis LH, Hernandez AF. Relation of dyspnea severity on admission for acute heart failure with outcomes and costs. Am J Cardiol. 2015;115:75–81. [DOI] [PMC free article] [PubMed] [Google Scholar]
- 31. Herrmann N, Tam DY, Balshaw R, Sambrook R, Lesnikova N, Lanctot KL; Canadian Outcomes Study in Dementia I . The relation between disease severity and cost of caring for patients with Alzheimer disease in Canada. Can J Psychiatry. 2010;55:768–775. [DOI] [PubMed] [Google Scholar]
- 32. Vonlanthen R, Slankamenac K, Breitenstein S, Puhan MA, Muller MK, Hahnloser D, Hauri D, Graf R, Clavien PA. The impact of complications on costs of major surgical procedures: a cost analysis of 1200 patients. Ann Surg. 2011;254:907–913. [DOI] [PubMed] [Google Scholar]
- 33. McHugh KE, Pasquali SK, Hall MA, Scheurer MA. Impact of postoperative complications on hospital costs following the Norwood operation. Cardiol Young. 2016;26:1303–1309. [DOI] [PMC free article] [PubMed] [Google Scholar]
- 34. Miller TP, Li Y, Kavcic M, Troxel AB, Huang YS, Sung L, Alonzo TA, Gerbing R, Hall M, Daves MH, Horton TM, Pulsipher MA, Pollard JA, Bagatell R, Seif AE, Fisher BT, Luger S, Gamis AS, Adamson PC, Aplenc R. Accuracy of adverse event ascertainment in clinical trials for pediatric acute myeloid leukemia. J Clin Oncol. 2016;34:1537–1543. [DOI] [PMC free article] [PubMed] [Google Scholar]
- 35. Kittle K, Currier K, Dyk L, Newman K. Using a pediatric database to drive quality improvement. Semin Pediatr Surg. 2002;11:60–63. [DOI] [PubMed] [Google Scholar]
- 36. Godebu E, Palazzi K, Bush R, Marietti S, Chiang G. National risk factors and estimated costs for redo ureteroneocystostomy after pediatric renal transplant. Pediatr Transplant. 2015;19:484–491. [DOI] [PubMed] [Google Scholar]
- 37. Lautz TB, Thurm CW, Rothstein DH. Delayed repeat enemas are safe and cost‐effective in the management of pediatric intussusception. J Pediatr Surg. 2015;50:423–427. [DOI] [PubMed] [Google Scholar]
- 38. Getz KD, Li Y, Alonzo TA, Hall M, Gerbing RB, Sung L, Huang YS, Arnold S, Seif AE, Miller TP, Bagatell R, Fisher BT, Adamson PC, Gamis A, Keren R, Aplenc R. Comparison of in‐patient costs for children treated on the AAML0531 clinical trial: a report from the Children's Oncology Group. Pediatr Blood Cancer. 2015;62:1775–1781. [DOI] [PMC free article] [PubMed] [Google Scholar]