

Abstract
Background
Frailty predicts poorer outcomes and decreased anticoagulation use in patients with nonvalvular atrial fibrillation. We sought to assess the effectiveness and safety of apixaban, dabigatran and rivaroxaban versus warfarin in frail nonvalvular atrial fibrillation patients.
Methods and Results
Using US MarketScan claims data from November 2011 to December 2016, we identified frail oral anticoagulant‐naïve nonvalvular atrial fibrillation patients with ≥12 months of continuous insurance coverage before oral anticoagulant initiation. Frailty status was determined using the Johns Hopkins Claims‐based Frailty Indicator score (≥0.20 indicating frailty). Users of apixaban, dabigatran, or rivaroxaban were separately 1:1 matched to warfarin users via propensity‐scores, with residual absolute standardized differences <0.1 being achieved for all covariates after matching. Patients were followed for up to 2 years or until an event, insurance disenrollment or end of follow‐up. Rates of stroke or systemic embolism and major bleeding were compared using Cox regression and reported as hazard ratios (HRs) and 95% confidence intervals (CIs). In total, 2700, 2784, and 5270 patients were included in the apixaban, dabigatran, and rivaroxaban 1:1 matched analyses to warfarin. At 2 years, neither apixaban nor dabigatran were associated with differences in the hazard of stroke or systemic embolism (HR=0.78; 95% CI=0.46–1.35 and HR=0.94; 0.60–1.45) or major bleeding (HR=0.72; 95% CI=0.49–1.06 and HR=0.87; 95% CI=0.63–1.19) versus warfarin. Rivaroxaban was associated with reduced stroke or systemic embolism at 2 years (HR=0.68; 95% CI=0.49–0.95) without significantly altering major bleeding risk (HR=1.07; 95% CI=0.81–1.32).
Conclusions
Our study found rivaroxaban but not apixaban or dabigatran to be associated with reduced SSE versus warfarin in frail nonvalvular atrial fibrillation patients. No direct‐acting oral anticoagulants demonstrated a significant difference in major bleeding versus warfarin.
Keywords: anticoagulants, atrial fibrillation, direct‐acting oral anticoagulants, frailty, warfarin
Subject Categories: Atrial Fibrillation, Ischemic Stroke, Anticoagulants, Pharmacology, Thrombosis
Clinical Perspective
What Is New?
At 2‐years follow‐up, apixaban and dabigatran were not associated with a significant hazard reduction in stroke or systemic embolism or ischemic stroke versus warfarin in frail nonvalvular atrial fibrillation patients.
Rivaroxaban reduced the hazard of developing stroke or systemic embolism and ischemic stroke versus warfarin by 32% and 31%, respectively.
No significant differences were observed between the direct‐acting oral anticoagulants and warfarin in rates of major bleeding at 2 years.
What Are the Clinical Implications?
Our study results suggest direct‐acting oral anticoagulants are reasonable alternatives to warfarin for stroke prevention in frail patients with nonvalvular atrial fibrillation managed in routine practice.
While a standardized definition has yet to be agreed upon by experts, frailty has been described as a clinical syndrome associated with a patient's decreased ability to recover from a stressor event because of decline in multiple physiological systems, ultimately resulting in poorer health outcomes.1, 2 It has been posited that frailty is the product of aging, interaction between multiple acute and chronic disease states, and patients’ genetic predisposition.2
Nonvalvular atrial fibrillation (NVAF) is commonly associated with both advanced age (≈70% of NVAF patients are 65 to 85 years old and 10% are >80 years)3 and multiple concomitant acute and chronic health conditions. For this reason, it is estimated NVAF patients have as high as a 4‐fold increased odds of being classified as frail compared with non‐NVAF patients.1 Despite being at an increased risk of thromboembolic events because of NVAF, frail patients appear less likely to receive adequate oral anticoagulation (OAC) compared with non‐frail patients.4, 5, 6 Some clinicians have advocated for the use of certain OACs, or doses of OAC, based on advanced age and/or the presence of various comorbid disease states (eg, >75 years old, renal impairment, prior history of bleeding), but not based on a comprehensive definition of frailty.7 There is a paucity of data evaluating the direct‐acting oral anticoagulants (DOACs) to warfarin in frail NVAF patients (particularly studies using a validated and comprehensive frailty definition). Therefore, we sought to assess the effectiveness and safety of apixaban, dabigatran, and rivaroxaban versus warfarin in frail NVAF patients treated in routine practice.
Methods
The data, analytic methods, and study materials will not be made available to other researchers for purposes of reproducing the results or replicating the procedure.
This study was designed in compliance with the RECORD (Reporting of studies Conducted using Observational Routinely‐collected health Data) statement.8 We performed a retrospective claims database analysis using US Truven MarketScan data from November 2011 to December 2016. MarketScan combines 2 separate databases, a commercial and a Medicare supplemental database, to cover all age groups; and as of March 2017, contains claims from 260 contributing employers, 40 health plans and government and public organizations representing ≈240 million lives.9 Truven MarketScan captures enrollment records, demographics, International Classification of Diseases, Ninth‐ and Tenth‐Revision (ICD‐9 and ICD‐10) diagnosis codes, procedure codes, admission and discharge dates, inpatient mortality data, outpatient medical services data and prescription dispensing records. All Truven MarketScan data are de‐identified and are in compliance with the Health Insurance Portability and Accountability Act of 1996 to preserve participant anonymity and confidentiality. This study was determined to not constitute research involving human subjects according to 45 Code of Federal Regulations 46.102(f), and therefore, deemed exempt from institutional review board oversight.
We included patients who were OAC‐naïve during the 12 months before the day of the first qualifying OAC dispensing (index date), had ≥2 ICD‐9 or ‐10 (427.31; I48) inpatient or outpatient diagnosis code in any position for atrial fibrillation (AF) without codes suggesting valvular disease and ≥12 months of continuous medical and prescription coverage before OAC initiation (baseline period).10 Individuals were excluded if they had a history of venous thromboembolism or orthopedic arthroplasty, were pregnant, had a transient cause of NVAF, or were prescribed >1 OAC. Frail patients were identified using the Johns Hopkins Claims‐based Frailty Indicator scoring algorithm.11 This algorithm weights 21 criteria identifiable in claims data, including demographics, physical and cognitive dysfunction, and the Charlson comorbidity index (Table 1) to identify patients meeting the Fried's Frailty Phenotype.12 A score of ≥0.20 using the Johns Hopkins Claims‐based Frailty Indicator has been shown to be able to accurately identify a population of frail patients (area‐under‐the‐curve=0.75; specificity=91%).11
Table 1.
Johns Hopkins Claims‐based Frailty Indicator Score11
| Beta‐Coefficient | Variables |
|---|---|
| 1.24 | Impaired mobility |
| 0.54 | Depression |
| 0.50 | Congestive heart failure |
| 0.50 | Parkinson disease |
| −0.49 | White race |
| 0.43 | Arthritis (any type) |
| 0.33 | Cognitive impairment |
| 0.31 | Charlson comorbidity index (>0, 0) |
| 0.28 | Stroke |
| 0.24 | Paranoia |
| 0.23 | Chronic skin ulcer |
| 0.21 | Pneumonia |
| −0.19 | Male sex |
| 0.18 | Skin and soft tissue infection |
| 0.14 | Mycoses |
| 0.09 | Age (in 5‐y categories) |
| 0.09 | Admission in past 6 mo |
| 0.08 | Gout or other crystal‐induced arthropathy |
| 0.08 | Falls |
| 0.05 | Musculoskeletal problems |
| 0.05 | Urinary tract infection |
Propensity‐scores were calculated using multivariable logistic regression incorporating frequently used variables and potential risk factors for differential OAC exposure, including patient demographics, comorbidities, components of the CHA2DS2‐VASc and modified HAS‐BLED risk stratification scores and concomitant non‐OAC medications assessed during the 12‐month baseline period.13 Variables included in the development of the propensity‐score are provided in Table 2.
Table 2.
Baseline Characteristics of Propensity Score–Matched Frail Direct‐Acting Oral Anticoagulant and Warfarin Patients With Nonvalvular Atrial Fibrillation
| Variable | Apixaban (n=1392) | Warfarin (n=1392) | Absolute Standardized Difference (%) | Dabigatran (n=1350) | Warfarin (n=1350) | Absolute Standardized Difference (%) | Rivaroxaban (n=2635) | Warfarin (n=2635) | Absolute Standardized Difference (%) |
|---|---|---|---|---|---|---|---|---|---|
| Age, y, median (IQR)a | 86 (83, 89) | 86 (83, 89) | 0.00 | 85 (82, 88) | 86 (82, 89) | 0.01 | 85 (82, 89) | 86 (82, 89) | 0.01 |
| 65 to 74 y, % | 1.4 | 1.7 | 0.01 | 2.5 | 2.1 | 0.03 | 2.1 | 2.4 | 0.02 |
| ≥75 y, % | 98.4 | 98.3 | 0.01 | 97.5 | 97.9 | 0.02 | 97.8 | 97.5 | 0.02 |
| Male sex, % | 63.7 | 62.8 | 0.01 | 64.7 | 62.7 | 0.02 | 65.2 | 64.4 | 0.02 |
| JHCFI score, median (IQR) | 0.30 (0.24, 0.40) | 0.30 (0.24, 0.39) | 0.00 | 0.28 (0.23, 0.35) | 0.28 (0.24, 0.37) | 0.00 | 0.28 (0.24, 0.38) | 0.29 (0.24, 0.38) | 0.00 |
| Receiving reduced dose, % | 56.1 | NA | NA | 41.3 | NA | NA | 56.5 | NA | NA |
| Comorbidities | |||||||||
| Heart failure, % | 48.2 | 48.2 | 0.00 | 47.9 | 48.4 | 0.02 | 49.1 | 48.7 | 0.01 |
| Hypertension, % | 88.4 | 88.2 | 0.00 | 83.8 | 81.9 | 0.05 | 86.0 | 86.9 | 0.03 |
| Ischemic stroke, % | 18.2 | 18.0 | 0.00 | 15.2 | 16.8 | 0.04 | 15.0 | 15.7 | 0.02 |
| Diabetes mellitus, % | 29.2 | 29.5 | 0.00 | 27.3 | 27.3 | 0.01 | 27.5 | 27.8 | 0.01 |
| Peripheral vascular disease, % | 30.9 | 31.3 | 0.01 | 26.2 | 26.6 | 0.01 | 28.5 | 29.8 | 0.02 |
| Myocardial infarction, % | 12.1 | 12.1 | 0.00 | 8.4 | 8.5 | 0.00 | 9.5 | 9.4 | 0.01 |
| Percutaneous coronary intervention, % | 3.8 | 4.1 | 0.01 | 1.9 | 2.4 | 0.03 | 2.9 | 3.3 | 0.03 |
| Coronary artery bypass grafting, % | 11.3 | 11.6 | 0.01 | 11.4 | 12.4 | 0.03 | 11.4 | 11.7 | 0.01 |
| History of major bleeding, % | 3.4 | 3.1 | 0.04 | 1.3 | 1.4 | 0.02 | 2.7 | 2.4 | 0.00 |
| Gastrointestinal bleeding, % | 3.1 | 2.7 | 0.02 | 1.0 | 1.0 | 0.00 | 2.2 | 2.2 | 0.00 |
| Intracranial hemorrhage, % | 0.1 | 0.2 | 0.04 | 0.1 | 0.0 | 0.04 | 0.2 | 0.1 | 0.02 |
| Acute kidney injury, % | 13.9 | 14.2 | 0.01 | 8.7 | 10.1 | 0.05 | 11.7 | 11.2 | 0.02 |
| Chronic kidney disease, % | 33.2 | 31.3 | 0.01 | 24.4 | 25.8 | 0.04 | 28.1 | 26.1 | 0.01 |
| End‐stage renal disease, % | 22.6 | 20.6 | 0.02 | 14.3 | 14.6 | 0.02 | 17.4 | 16.2 | 0.03 |
| Liver disease, % | 3.5 | 3.7 | 0.02 | 2.6 | 2.7 | 0.00 | 3.1 | 3.1 | 0.00 |
| Coagulopathy, % | 5.2 | 4.9 | 0.01 | 3.5 | 4.7 | 0.06 | 4.6 | 4.9 | 0.01 |
| Gastroesophageal reflux disease, % | 17.0 | 16.6 | 0.01 | 12.1 | 12.5 | 0.01 | 15.0 | 14.2 | 0.02 |
| Upper gastrointestinal testing, % | 6.5 | 6.8 | 0.01 | 6.4 | 5.3 | 0.05 | 6.1 | 5.8 | 0.01 |
| Anemia, % | 26.4 | 27.4 | 0.02 | 21.5 | 21.6 | 0.00 | 25.1 | 24.5 | 0.01 |
| Asthma, % | 6.4 | 7.2 | 0.03 | 5.9 | 6.7 | 0.03 | 6.9 | 7.7 | 0.03 |
| Chronic obstructive pulmonary disease, % | 22.3 | 22.6 | 0.01 | 22.5 | 21.9 | 0.01 | 22.7 | 22.9 | 0.00 |
| Sleep apnea, % | 7.3 | 7.3 | 0.00 | 6.5 | 6.8 | 0.01 | 7.3 | 7.1 | 0.01 |
| Smoker, % | 3.0 | 2.7 | 0.01 | 2.2 | 1.9 | 0.02 | 2.7 | 2.7 | 0.00 |
| Hemorrhoids, % | 2.9 | 2.8 | 0.00 | 2.7 | 2.3 | 0.02 | 2.6 | 2.7 | 0.01 |
| Alcohol abuse, % | 0.9 | 0.9 | 0.01 | 0.8 | 0.5 | 0.04 | 1.0 | 1.1 | 0.01 |
| Anxiety, % | 13.2 | 13.0 | 0.00 | 8.2 | 6.6 | 0.06 | 11.5 | 11.8 | 0.01 |
| Depression, % | 17.8 | 16.8 | 0.03 | 13.9 | 13.2 | 0.02 | 16.6 | 15.8 | 0.02 |
| Psychosis, % | 7.0 | 6.8 | 0.01 | 6.6 | 6.6 | 0.00 | 7.2 | 7.6 | 0.01 |
| Obesity, % | 7.3 | 8.1 | 0.03 | 5.1 | 5.7 | 0.03 | 7.1 | 7.2 | 0.00 |
| Osteoarthritis, % | 34.6 | 35.1 | 0.01 | 33.7 | 33.9 | 0.00 | 38.1 | 36.5 | 0.03 |
| Back pain, % | 20.6 | 21.9 | 0.03 | 19.6 | 20.2 | 0.01 | 22.1 | 22.0 | 0.00 |
| Joint pain and stiffness, % | 49.3 | 50.5 | 0.02 | 47.4 | 48.7 | 0.03 | 47.9 | 48.7 | 0.02 |
| Headache, % | 9.8 | 9.0 | 0.03 | 9.0 | 10.0 | 0.03 | 9.2 | 9.8 | 0.02 |
| Diverticulitis, % | 8.0 | 8.2 | 0.01 | 7.2 | 7.3 | 0.01 | 8.2 | 8.1 | 0.00 |
| Crohns or ulcerative colitis, % | 1.9 | 2.2 | 0.02 | 2.0 | 1.6 | 0.03 | 2.1 | 2.4 | 0.02 |
| Helicobacter pylori, % | 0.1 | 0.1 | 0.00 | 0.4 | 0.3 | 0.01 | 0.2 | 0.1 | 0.01 |
| Hypothyroidism, % | 23.3 | 23.3 | 0.00 | 21.6 | 19.3 | 0.06 | 21.8 | 21.5 | 0.00 |
| Solid tumor, % | 14.7 | 14.2 | 0.01 | 12.8 | 14.0 | 0.03 | 14.4 | 14.4 | 0.00 |
| Lymphoma, % | 1.5 | 1.7 | 0.01 | 1.3 | 1.6 | 0.03 | 1.8 | 2.0 | 0.02 |
| Metastatic cancer, % | 1.9 | 1.8 | 0.01 | 0.9 | 1.1 | 0.02 | 2.0 | 2.3 | 0.02 |
| Medication use | |||||||||
| Antiplatelet drugs, % | 17.1 | 17.3 | 0.01 | 16.7 | 16.1 | 0.02 | 16.1 | 15.8 | 0.01 |
| NSAIDs, % | 17.7 | 18.3 | 0.02 | 19.2 | 17.6 | 0.01 | 19.2 | 18.4 | 0.01 |
| COX‐2‐specific NSAIDs, % | 3.4 | 3.3 | 0.00 | 4.7 | 3.3 | 0.07 | 4.1 | 3.6 | 0.03 |
| ACE inhibitors or ARBs, % | 49.3 | 47.2 | 0.04 | 46.0 | 46.9 | 0.02 | 56.9 | 56.7 | 0.00 |
| β‐blockers, % | 62.2 | 61.6 | 0.01 | 59.0 | 60.0 | 0.02 | 58.6 | 59.4 | 0.02 |
| Diltiazem, % | 10.8 | 10.6 | 0.00 | 12.9 | 11.6 | 0.04 | 12.4 | 12.4 | 0.00 |
| Verapamil, % | 1.5 | 1.2 | 0.03 | 2.0 | 1.8 | 0.01 | 1.8 | 1.9 | 0.01 |
| Dihydropyridine calcium channel blockers, % | 29.4 | 30.2 | 0.01 | 23.1 | 23.7 | 0.01 | 30.0 | 31.5 | 0.03 |
| Loop diuretic, % | 36.5 | 34.3 | 0.04 | 34.2 | 33.8 | 0.01 | 33.8 | 34.7 | 0.02 |
| Thiazide diuretic, % | 14.8 | 14.7 | 0.00 | 14.6 | 15.0 | 0.01 | 28.1 | 28.1 | 0.00 |
| Digoxin, % | 7.1 | 6.7 | 0.01 | 10.9 | 9.9 | 0.03 | 8.9 | 8.2 | 0.03 |
| Amiodarone, % | 6.2 | 6.9 | 0.03 | 6.1 | 4.8 | 0.06 | 6.2 | 6.2 | 0.00 |
| Dronedarone, % | 0.4 | 0.4 | 0.01 | 1.2 | 0.7 | 0.05 | 0.8 | 0.8 | 0.01 |
| Other antiarrhythmic drugs, % | 3.8 | 3.5 | 0.02 | 4.0 | 3.0 | 0.05 | 4.1 | 4.0 | 0.01 |
| Statins, % | 53.1 | 53.6 | 0.01 | 49.0 | 51.3 | 0.05 | 52.6 | 63.4 | 0.02 |
| Other cholesterol lowering drugs, % | 6.5 | 6.7 | 0.01 | 6.4 | 6.5 | 0.01 | 7.2 | 7.1 | 0.00 |
| Metformin, % | 8.8 | 9.2 | 0.01 | 8.0 | 9.3 | 0.05 | 10.0 | 9.7 | 0.01 |
| Sulfonylureas or glinides, % | 8.5 | 8.6 | 0.00 | 8.5 | 9.2 | 0.02 | 8.3 | 8.4 | 0.00 |
| Thiazolidinediones, % | 1.3 | 0.9 | 0.04 | 2.5 | 2.8 | 0.02 | 1.2 | 1.5 | 0.02 |
| Dipeptidyl peptidase‐ 4 inhibitors, % | 3.5 | 3.5 | 0.00 | 3.3 | 3.3 | 0.00 | 3.4 | 3.1 | 0.02 |
| Glucagon‐like peptide‐1 agonists, % | 0.3 | 0.4 | 0.02 | 0.4 | 0.5 | 0.01 | 0.3 | 0.3 | 0.00 |
| Insulin, % | 5.9 | 5.8 | 0.00 | 5.9 | 6.0 | 0.01 | 5.8 | 5.5 | 0.01 |
| Benzodiazepines, % | 16.0 | 16.5 | 0.01 | 16.2 | 15.3 | 0.03 | 17.0 | 16.9 | 0.00 |
| SSRIs or SNRIs, % | 18.8 | 18.2 | 0.02 | 17.7 | 16.7 | 0.02 | 19.0 | 18.0 | 0.02 |
| Other antidepressants, % | 11.4 | 10.7 | 0.02 | 8.6 | 8.6 | 0.00 | 10.0 | 9.8 | 0.01 |
| Proton pump inhibitors, % | 30.8 | 30.7 | 0.00 | 23.5 | 25.0 | 0.03 | 28.1 | 27.2 | 0.02 |
| Histamine‐2 receptor antagonists, % | 6.0 | 5.7 | 0.01 | 4.6 | 4.2 | 0.02 | 5.5 | 5.2 | 0.01 |
| Systemic corticosteroids, % | 21.6 | 21.7 | 0.00 | 20.0 | 20.4 | 0.01 | 22.2 | 22.0 | 0.00 |
| Warfarin inducer, % | 31.0 | 31.5 | 0.01 | 29.5 | 30.9 | 0.03 | 30.3 | 29.6 | 0.01 |
| Warfarin inhibitor, % | 70.2 | 70.5 | 0.01 | 66.7 | 64.9 | 0.04 | 71.6 | 71.8 | 0.00 |
| Risk stratification scores | |||||||||
| CHADS2a , b, median (IQR), % | 3 (2, 3) | 3 (2, 3) | 0.00 | 3 (2, 3) | 3 (2, 3) | 0.00 | 3 (2, 3) | 3 (2, 3) | 0.00 |
| CHA2DS2‐VASca , c, median (IQR), % | 4 (4, 5) | 4 (4, 5) | 0.00 | 4 (4, 5) | 4 (4, 5) | 0.00 | 4 (4, 5) | 4 (4, 5) | 0.00 |
| Modified HAS‐BLEDa , d, median (IQR), % | 2 (2, 3) | 2 (2, 3) | 0.00 | 2 (2, 3) | 2 (2, 3) | 0.00 | 2 (2, 3) | 2 (2, 3) | 0.00 |
ACE indicates angiotensin‐converting enzyme; ARB, angiotensin receptor blocker; COX‐2, Cyclooxygenase‐2; IQR, interquartile range; JHCFI, John Hopkins Claims‐Based Frailty Indicator; NA, not applicable; NSAIDs, nonsteroidal anti‐inflammatory drugs; SNRI, Serotonin–norepinephrine reuptake inhibitor; SSRI, Selective serotonin reuptake inhibitor.
Median age and CHADS2, CHA2DS2‐VASc, and modified HASBLED risk scores were not included in the propensity‐score model; instead individual components of CHA2DS2‐VASc, and modified HASBLED were used.
CHADS2=congestive heart failure, 1 point; hypertension, 1 point; ≥75 years, 1 point; diabetes mellitus, 1 point; previous stroke or transient ischemic attack, 2 points.
CHA2DS2‐VASc=congestive heart failure, 1 point; hypertension, 1 point; ≥75 years old, 2 points; diabetes mellitus, 1 point; previous stroke, transient ischemic attack or thromboembolism, 2 points; vascular disease, 1 point; 65 to 74 years old, 1 point; female sex, 1 point.
Modified HASBLED=hypertension, 1 point; >65 years old, 1 point; stroke history, 1 point; bleeding history or predisposition, 1 point; liable international normalized ratio, not assessed; ethanol or drug abuse, 1 point; drug predisposing to bleeding, 1 point.
Each eligible apixaban, dabigatran, and rivaroxaban user was separately 1:1 propensity‐score matched, using greedy nearest‐neighbor matching without replacement and a caliper=1%, to a warfarin user (with an initiation date within 90 days of the DOAC patient) to minimize the presence of baseline differences between cohorts. Residual differences in characteristics between matched cohorts were assessed by calculating absolute standardized differences (<0.1 considered well‐balanced).13
The primary effectiveness outcome for this study was stroke or systemic embolism (SSE) including ischemic stroke (ICD‐10=I63; I64.9), hemorrhagic stroke (ICD‐10=I60‐I62), or systemic embolism (ICD‐10=I74).14 The occurrence of SSE during the observation period was determined by the presence of an appropriate inpatient discharge diagnosis code in the primary position. Major bleeding was our primary safety outcome and was determined using the validated Cunningham algorithm for detection of bleeding‐related hospitalizations.15 Patients were followed for a maximum of 2 years or until the occurrence of a thrombotic or major bleeding outcome, insurance disenrollment or end of study follow‐up (intention‐to‐treat analysis).
Baseline patient characteristics were analyzed using descriptive statistics. Categorical data are reported as proportions; while continuous data were reported as medians with interquartile ranges (IQRs). The rates of end points were reported as events per 100 patient‐years (PYs). Cox proportional hazards regression was performed on matched cohorts and results reported as hazard ratios (HRs) and 95% confidence intervals (CIs). Because all baseline covariates for patients included in each DOAC versus warfarin analysis were balanced after propensity‐score matching, regression only included OAC initiated as a covariate. The proportional hazards assumption was checked using statistical tests and graphical diagnostics based on Schoenfeld residuals and was found to be met for all outcomes. Statistical analyses were performed using PROC PHREG in SAS version 9.4 (SAS Inc., Cary, NC) and a P<0.05 was considered significant in all cases.
Results
In total, 2700, 2784, and 5270 patients were included in the apixaban, dabigatran, and rivaroxaban propensity‐score matched analyses to warfarin (Figure). Median (IQR) follow up was 0.9 (0.4, 1.6), 1.8 (0.8, 2.0) and 1.4 (0.7, 2.0) years. Median CHA2Ds2‐VASc and modified HAS‐BLED scores were 4 (4, 5) and 2 (2, 3) in each individual DOAC versus warfarin analysis. For each DOAC versus warfarin comparison, residual absolute standardized differences ≤0.07 were achieved for all covariates after propensity‐score matching.
Figure 1.
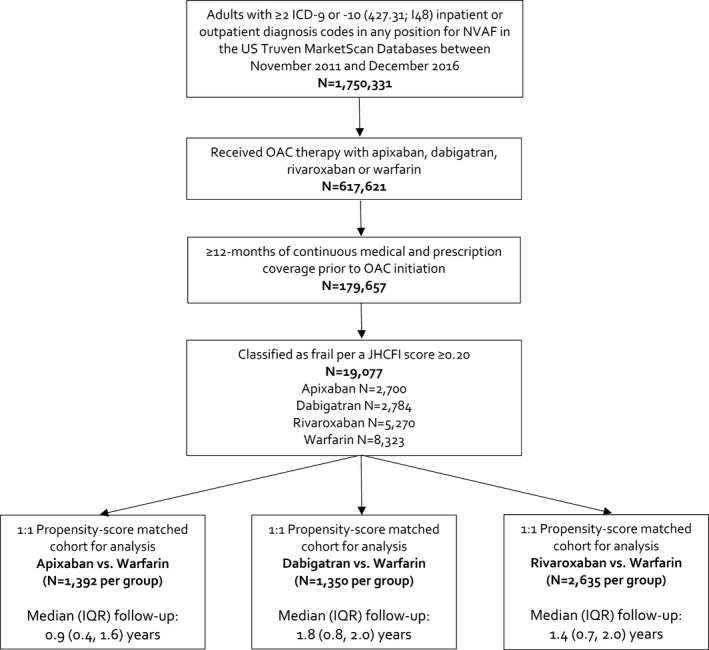
Study flow diagram. ICD indicates International Classification of Diseases; IQR, interquartile range; JHCFI, John Hopkins Claims‐Based Frailty Indicator; NVAF, nonvalvular atrial fibrillation; OAC, oral anticoagulants; US, United States.
Table 3 depicts end point event rates at 1‐ and 2‐years of follow‐up. At 1 year, no DOAC was associated with a significantly lower risk of SSE or ischemic stroke alone versus warfarin. Apixaban was associated with a reduced hazard of major bleeding by 39% versus warfarin; while both dabigatran and rivaroxaban were associated with similar major bleeding rates as warfarin but significantly lower rates of intracranial hemorrhage (HRs=0.18 and 0.37, respectively).
Table 3.
Number of Events, Event Rates, and Hazard Ratios According to Treatment
| Apixaban (n=1392) | Warfarin (n=1392) | HR (95% CI) | |||
|---|---|---|---|---|---|
| n Events | Event Rate (Events/100‐Patient‐Years) | n Events | Event Rate (Events/100‐Patient‐Years) | ||
| 1‐y follow‐up | |||||
| SSE | 16 | 1.57 | 22 | 2.25 | 0.71 (0.37–1.35) |
| Ischemic stroke | 12 | 1.18 | 20 | 2.04 | 0.58 (0.29–1.19) |
| Major bleed | 34 | 3.38 | 54 | 5.62 | 0.61 (0.39–0.93) |
| Hemorrhagic stroke | 4 | 0.39 | 2 | 0.20 | 1.93 (0.35–10.55) |
| Intracranial hemorrhage | 5 | 0.49 | 5 | 0.51 | 0.97 (0.28–3.33) |
| Gastrointestinal bleed | 25 | 2.48 | 37 | 3.82 | 0.65 (0.39–1.08) |
| 2‐y follow‐up | |||||
| SSE | 24 | 1.68 | 29 | 2.15 | 0.78 (0.46–1.35) |
| Ischemic stroke | 20 | 1.40 | 27 | 2.00 | 0.70 (0.39–1.25) |
| Major bleed | 44 | 3.11 | 58 | 4.41 | 0.72 (0.49–1.06) |
| Hemorrhagic stroke | 4 | 0.28 | 2 | 0.15 | 1.93 (0.35–10.55) |
| Intracranial hemorrhage | 5 | 0.35 | 5 | 0.37 | 0.97 (0.28–3.33) |
| Gastrointestinal bleed | 33 | 2.33 | 41 | 3.09 | 0.76 (0.48–1.21) |
| Dabigatran (n=1350) | Warfarin (n=1350) | HR (95% CI) | |||
|---|---|---|---|---|---|
| n Events | Event Rate (Events/100‐Patient‐Years) | n Events | Event Rate (Events/100‐Patient‐Years) | ||
| 1‐y follow‐up | |||||
| SSE | 25 | 2.21 | 26 | 2.31 | 0.96 (0.55–1.66) |
| Ischemic stroke | 22 | 1.94 | 21 | 1.86 | 1.04 (0.57–1.90) |
| Major bleed | 48 | 4.30 | 52 | 4.68 | 0.92 (0.62–1.37) |
| Hemorrhagic stroke | 2 | 0.18 | 5 | 0.44 | 0.40 (0.08–2.06) |
| Intracranial hemorrhage | 2 | 0.18 | 9 | 0.80 | 0.18 (0.04–0.81) |
| Gastrointestinal bleed | 38 | 3.39 | 35 | 3.13 | 1.09 (0.69–1.72) |
| 2‐y follow‐up | |||||
| SSE | 39 | 2.06 | 41 | 2.20 | 0.94 (0.60–1.45) |
| Ischemic stroke | 33 | 1.73 | 36 | 1.93 | 0.90 (0.56–1.45) |
| Major bleed | 71 | 3.82 | 81 | 4.44 | 0.87 (0.63–1.19) |
| Hemorrhagic stroke | 2 | 0.10 | 6 | 0.32 | 0.33 (0.07–1.64) |
| Intracranial hemorrhage | 2 | 0.10 | 11 | 0.59 | 0.14 (0.02–1.11) |
| Gastrointestinal bleed | 58 | 3.10 | 61 | 3.31 | 0.94 (0.66–1.35) |
| Rivaroxaban (n=2635) | Warfarin (n=2635) | HR (95% CI) | |||
|---|---|---|---|---|---|
| n Events | Event Rate (Events/100‐Patient‐Years) | n Events | Event Rate (Events/100‐Patient‐Years) | ||
| 1‐y follow‐up | |||||
| SSE | 39 | 1.85 | 49 | 2.35 | 0.79 (0.52–1.20) |
| Ischemic stroke | 32 | 1.51 | 38 | 1.82 | 0.83 (0.52–1.34) |
| Major bleed | 107 | 5.15 | 100 | 4.86 | 1.06 (0.81–1.39) |
| Hemorrhagic stroke | 6 | 0.28 | 9 | 0.43 | 0.66 (0.24–1.85) |
| Intracranial hemorrhage | 6 | 0.28 | 16 | 0.76 | 0.37 (0.15–0.94) |
| Gastrointestinal bleed | 92 | 4.41 | 66 | 3.18 | 1.39 (1.01–1.90) |
| 2‐y follow‐up | |||||
| SSE | 60 | 1.78 | 86 | 2.61 | 0.68 (0.49–0.95) |
| Ischemic stroke | 51 | 1.51 | 72 | 2.18 | 0.69 (0.48–0.99) |
| Major bleed | 136 | 4.13 | 129 | 4.01 | 1.04 (0.81–1.32) |
| Hemorrhagic stroke | 9 | 0.26 | 12 | 0.36 | 0.74 (0.31–1.75) |
| Intracranial hemorrhage | 10 | 0.29 | 20 | 0.60 | 0.49 (0.23–1.04) |
| Gastrointestinal bleed | 113 | 3.41 | 88 | 2.70 | 1.27 (0.96–1.68) |
CI indicates confidence interval; HR, hazard ratio; SSE, stroke/systemic embolism.
At 2 years, neither apixaban nor dabigatran were associated with differences in the hazard of SSE (HR=0.78; 95% CI=0.46–1.35 and HR=0.94; 0.60–1.45) or major bleeding (HR=0.72; 95% CI=0.49–1.06 and HR=0.87; 95% CI=0.63–1.19) versus warfarin. Rivaroxaban was associated with a reduced hazard of SSE at 2 years (HR=0.68; 95% CI=0.49–0.95) and ischemic stroke alone (HR=0.69, 95% CI=0.48–0.99) without significantly altering major bleeding risk (HR=1.07; 95% CI=0.81–1.32). Upon comparing each DOAC to warfarin, no significant difference was noted in any major bleeding subtype including hemorrhagic stroke, intracranial hemorrhage, or gastrointestinal bleeding.
Discussion
This study in the US MarketScan administrative claims databases evaluated NVAF patients with frailty, identified by the Johns Hopkins Claims‐based Frailty Indicator.11 Our analysis demonstrated that apixaban, dabigatran and rivaroxaban were associated with non‐significantly reduced hazards of developing SSE or ischemic stroke at 1 year compared with warfarin. Apixaban significantly reduced patients’ hazard of major bleeding at 1 year versus warfarin. Dabigatran‐ and rivaroxaban‐treated patients experienced similar rates of major bleeding, as well as, a significant reduction in intracranial hemorrhage compared with warfarin at 1 year of follow‐up. At 2 years, apixaban and dabigatran were not associated with a significant hazard reduction in SSE or ischemic stroke versus warfarin. Rivaroxaban, however, significantly reduced the hazard of developing SSE and ischemic stroke versus warfarin by 32% and 31%, respectively. No significant differences were observed between any DOAC and warfarin in rates of major bleeding or in any major bleeding subtype including hemorrhagic stroke, intracranial hemorrhage and gastrointestinal bleeding at 2 years in this frail population.
Frailty is a clinical state of vulnerability caused by an age‐related decline in the body's physiological systems’ ability to respond to stressor events.16 Frailty definitions in broad patient populations have included age, nutritional deficits, decreased mobility, social withdrawal, low income, number of prior hospitalizations and cognitive impairment;4 and more recently, anticoagulation trials have defined frailty as the presence of >75 years old, creatinine clearance <50 mL/min or body weight <50 kg.17 However, the 2 most commonly accepted approaches to defining frailty are the Frailty Index18 and the Frailty Phenotype.12 The Frailty Index defines frailty as a syndrome that arises as a result of the accumulation of health deficits.16 The Frailty Index is derived using a pre‐specified list of health conditions to calculate a ratio to quantify the level of frailty.16 The Frailty Index offers a precise measurement of frailty, but the level of information required for calculation make it complicated to utilize in clinical situations. The Frailty Phenotype developed by Fried et al12 identifies frailty by the presence of ≥3 of the following components: unintentional weight loss of 10 pounds in the past year, self‐reported exhaustion, weakness as measured with grip strength, slow walking speed and low physical activity (patients can be consider pre‐frail if 1 or 2 criteria are met, and are considered non‐frail if none of the criteria are met).10 Fried's Frailty Phenotype12 has shown to have the ability to predict poor health outcomes including incident of falls, worsening mobility, hospitalization, and death. Moreover, it has been extensively validated.19 The Frailty Phenotype is the most commonly used tool for assessing frailty and was the reference standard used by Segal and colleagues to develop the Johns Hopkins Claims‐based Frailty Indicator utilized in the present study.11
Frail patients with NVAF are less likely to receive anticoagulation than non‐frail patients.4, 5, 6 Perera and colleagues4 demonstrated frailty, identified using the Edmonton Frail Scale, was among the strongest predictors of anticoagulation use in older patients with NVAF admitted to the hospital. In their prospective study of 220 acute inpatients ≥70 years old with NVAF, they found frail patients were significantly less likely to receive warfarin than non‐frail patients on admission and at hospital discharge (odds ratio=0.34, 95% CI=0.17–0.68). This is despite the fact that frailty trended towards being a predictor of increased stroke occurrence at 6 months (odds ratio=3.39, 95% CI=0.96–12.02; P=0.06).4 Similarly, the Frailty, Stroke Risk and Bleeding Risk on Anticoagulation in the Elderly With Atrial Fibrillation (FRAIL‐AF) study showed that patients classified as non‐to‐moderately frail using the Clinical Frailty Scale (CFS) were 3.4‐fold (P<0.0001) more likely to receive anticoagulation therapy than patients classified as severely frail (CFS ≥7).6 Studies have shown cognitive dysfunction or dementia, perceived fall risk and advancing age, each of which are included in the Johns Hopkins Claims‐based Frailty Indicator, to be associated with a significant reduction in the odds of anticoagulation use in NVAF patients.20, 21 Furthermore, some clinicians have supported utilizing certain OACs, or reduced doses of OACs in various clinical scenarios often associated with a frail state (eg, >75 years old, renal impairment).7 The fact that our evaluations of DOACs in frail NVAF patients are generally consistent with the overall study population findings from phase III randomized trials of DOACs versus warfarin,22 may provide clinicians with added confidence in anticoagulating frail patients with NVAF.
As a retrospective analysis of claims data, this study has limitations worthy of discussion. First, both misclassification (measurement error) and selection bias (selection of patients in a nonrandomized fashion) are always important limitations in claims database studies and may impact a study's internal validity.23 Second, we used US claims data (both commercial and Medicare Advantage), and therefore, our results are most generalizable (externally valid) to a US population.9 Third, because the 110 mg twice daily dose of dabigatran is not approved in the United States (only a 75 mg twice daily dose), we were not able to determine the effectiveness or safety of the 110 mg dose which is used in other countries. Fourth, although propensity score matching13 can generate cohorts that are comparable in key characteristics, only those variables measured in MarketScan databases could be used for matching in this analysis. Therefore, regardless of the sophistication of the methodology and the number of variables used in developing propensity scores, residual confounding cannot be excluded. Fifth, we were only able to match ≈50% of DOAC users to warfarin users in our analysis. This is because of the small propensity score caliper (1%) we used. Using a small caliper makes it more difficult to match patients, but likely results in a higher quality of matching. Sixth, it is possible that some analyses were underpowered to detect differences between treatment cohorts because of our analysis’ smaller sample size (at least compared with corresponding clinical trials), varying size of effect/event frequency observed and varying durations of follow‐up across DOACs (because of the differential timing of DOAC approval in the United States, with apixaban being the last). Finally, the derivation paper for the Johns Hopkins Claims‐based Frailty Indicator provides data supporting a cut‐off of 0.12 and 0.20 for identifying patients as frail.11 While the 0.12 cut‐off maximized both sensitivity and specificity (66% and 73%, respectively), we opted to use the more conservative 0.20 cut‐off (sensitivity and specificity of 35% and 91%, respectively) as it was our desire to assure the most accurate identification of frail patients (where as a lower cut‐off would more inclusively identify frail patients but at a higher chance of misclassification).
Conclusion
Our study found rivaroxaban but not apixaban or dabigatran to be associated with reduced SSE versus warfarin in frail NVAF patients at 2‐years follow‐up. No DOAC demonstrated a significant difference in bleeding versus warfarin. The relative effectiveness and safety of DOACs compared with warfarin appears maintained in frail NVAF patients treated in routine US clinical practice.
Sources of Funding
This study was supported by Bayer AG, Berlin, Germany. The sponsor had no role in study design; in the collection, analysis and interpretation of data; in the writing of the report; or in the decision to submit the article for publication.
Disclosures
Dr Coleman has received grant funding and consultancy honorarium from Bayer AG, Janssen Scientific Affairs LLC and Boehringer Ingelheim Pharmaceuticals Inc. The remaining authors have no disclosures to report.
Author Contributions
Dr Coleman had full access to all of the data in this study and take responsibility for the integrity of the data and the accuracy of the data analysis. Concept and design: All authors. Acquisition, analysis, or interpretation of data: All authors. Drafting of the article: Martinez, Coleman. Critical revision of the article for important intellectual content: All authors. Statistical analysis: Martinez, Bunz, Coleman. Obtained funding: Coleman.
(J Am Heart Assoc. 2018;7:e008643 DOI: 10.1161/JAHA.118.008643.)29654196
References
- 1. Polidoro A, Stefanelli F, Ciacciarelli M, Pacelli A, Di Sanzo D, Alessandri C. Frailty in patients affected by atrial fibrillation. Arch Gerontol Geriatr. 2013;57:325–327. [DOI] [PubMed] [Google Scholar]
- 2. Villacampa‐Fernández P, Navarro‐Pardo E, Tarín JJ, Cano A. Frailty and multimorbidity: two related yet different concepts. Maturitas. 2017;95:31–35. [DOI] [PubMed] [Google Scholar]
- 3. Go AS, Hylek EM, Phillips KA, Chang Y, Henault LE, Selby JV, Singer DE. Prevalence of diagnosed atrial fibrillation in adults: national implications for rhythm management and stroke prevention: the AnTicoagulation and Risk Factors in Atrial Fibrillation (ATRIA) study. JAMA. 2001;285:2370–2375. [DOI] [PubMed] [Google Scholar]
- 4. Perera V, Bajorek BV, Matthews S, Hilmer SN. The impact of frailty on the utilisation of antithrombotic therapy in older patients with atrial fibrillation. Age Ageing. 2009;38:156–162. [DOI] [PubMed] [Google Scholar]
- 5. Induruwa I, Evans NR, Aziz A, Reddy S, Khadjooi K, Romero‐Ortuno R. Clinical frailty is independently associated with non‐prescription of anticoagulants in older patients with atrial fibrillation. Geriatr Gerontol Int. 2017;17:2178–2183. [DOI] [PubMed] [Google Scholar]
- 6. Lefebvre MC, St‐Onge M, Glazer‐Cavanagh M, Bell L, Kha Nguyen JN, Viet‐Quoc Nguyen P, Tannenbaum C. The effect of bleeding risk and frailty status on anticoagulation patterns in octogenarians with atrial fibrillation: the FRAIL‐AF study. Can J Cardiol. 2016;32:169–176. [DOI] [PubMed] [Google Scholar]
- 7. Diener HC, Aisenberg J, Ansell J, Atar D, Breithardt G, Eikelboom J, Ezekowitz MD, Granger CB, Halperin JL, Hohnloser SH, Hylek EM, Kirchhof P, Lane DA, Verheugt FWA, Veltkamp R, Lip GYH. Choosing a particular oral anticoagulant and dose for stroke prevention in individual patients with non‐valvular atrial fibrillation: part 2. Eur Heart J. 2017;38:860–868. [DOI] [PMC free article] [PubMed] [Google Scholar]
- 8. Benchimol EI, Smeeth L, Guttmann A, Harron K, Moher D, Petersen I, Sorensen HT, von Elm E, Langan SM; RECORD Working Committee . The REporting of studies Conducted using Observational Routinely‐collected health Data (RECORD) Statement. PLoS Med. 2015;12:e1001885. [DOI] [PMC free article] [PubMed] [Google Scholar]
- 9. Hansen L. The Truven Health MarketScan Databases for life sciences researchers. Available at: https://truvenhealth.com/Portals/0/Assets/2017-MarketScan-Databases-Life-Sciences-Researchers-WP.pdf. Accessed December 25, 2017.
- 10. Jensen PN, Johnson K, Floyd J, Heckbert SR, Carnahan R, Dublin S. Identifying atrial fibrillation from electronic medical data: a systematic review. Pharmacoepidemiol Drug Saf. 2012;21:141–147. [DOI] [PMC free article] [PubMed] [Google Scholar]
- 11. Segal JB, Chang H‐Y, Du Y, Walston JD, Carlson MC, Varadhan R. Development of a claims‐based frailty indicator anchored to a well‐established frailty phenotype. Med Care. 2017;55:716–722. [DOI] [PMC free article] [PubMed] [Google Scholar]
- 12. Fried LP, Tangen CM, Walston J, Newman AB, Hirsch C, Gottdiener J, Seeman T, Tracy R, Kop WJ, Burke G, McBurnie MA; Cardiovascular Health Study Collaborative Research Group . Frailty in older adults: evidence for a phenotype. J Gerontol A Biol Sci Med Sci. 2001;56:M146–M156. [DOI] [PubMed] [Google Scholar]
- 13. Austin PC. An introduction to propensity score methods for reducing the effects of confounding in observational studies. Multivariate Behav Res. 2011;46:399–424. [DOI] [PMC free article] [PubMed] [Google Scholar]
- 14. Lip GYH, Skjøth F, Nielsen PB, Kjældgaard JN, Larsen TB. Effectiveness and safety of standard‐dose nonvitamin K antagonist oral anticoagulants and warfarin among patients with atrial fibrillation with a single stroke risk factor: a nationwide cohort study. JAMA Cardiol. 2017;2:872–881. [DOI] [PMC free article] [PubMed] [Google Scholar]
- 15. Cunningham A, Stein CM, Chung CP, Daugherty JR, Smalley WE, Ray WA. An automated database case definition for serious bleeding related to oral anticoagulant use. Pharmacoepidemiol Drug Saf. 2011;20:560–566. [DOI] [PMC free article] [PubMed] [Google Scholar]
- 16. Clegg A, Young J, Iliffe S, Rikkert MO, Rockwood K. Frailty in elderly people. Lancet. 2013;381:752–762. [DOI] [PMC free article] [PubMed] [Google Scholar]
- 17. Prins MH, Lensing AW, Bauersachs R, van Bellen B, Bounameaux H, Brighton TA, Cohen AT, Davidson BL, Decousus H, Raskob GE, Berkowitz SD, Wells PS; EINSTEIN Investigators . Oral rivaroxaban versus standard therapy for the treatment of symptomatic venous thromboembolism: a pooled analysis of the EINSTEIN‐DVT and PE randomized studies. Thromb J. 2013;11:21. [DOI] [PMC free article] [PubMed] [Google Scholar]
- 18. Mitnitski AB, Mogilner AJ, Rockwood K. Accumulation of deficits as a proxy measure of aging. Sci World J. 2001;1:323–336. [DOI] [PMC free article] [PubMed] [Google Scholar]
- 19. Bandeen‐Roche K, Xue QL, Ferrucci L, Walston J, Guralnik JM, Caves P, Zeger SL, Fried LP. Phenotype of frailty: characterization in the women's health and aging studies. J Gerontol A Biol Sci Med Sci. 2006;61:262–266. [DOI] [PubMed] [Google Scholar]
- 20. Kakkar AK, Mueller I, Bassand JP, Fitzmaurice DA, Goldhaber SZ, Goto S, Haas S, Hacke W, Lip GY, Mantovani LG, Turpie AG, van Eickels M, Misselwitz F, Rushton‐Smith S, Kayani G, Wilkinson P, Verheugt FW; GARFIELD Registry Investigators . Risk profiles and antithrombotic treatment of patients newly diagnosed with atrial fibrillation at risk of stroke: perspectives from the international, observational, prospective GARFIELD registry. PLoS One 2013;8:e63479. [DOI] [PMC free article] [PubMed] [Google Scholar]
- 21. Baczek VL, Chen WT, Kluger J, Coleman CI. Predictors of warfarin use in atrial fibrillation in the United States: a systematic review and meta‐analysis. BMC Fam Pract. 2012;13:5. [DOI] [PMC free article] [PubMed] [Google Scholar]
- 22. Ruff CT, Giugliano RP, Braunwald E, Hoffman EB, Deenadayalu N, Ezekowitz MD, Camm AJ, Weitz JI, Lewis BS, Parkhomenko A, Yamashita T, Antman EM. Comparison of the efficacy and safety of new oral anticoagulants with warfarin in patients with atrial fibrillation: a meta‐analysis of randomised trials. Lancet. 2014;383:955–962. [DOI] [PubMed] [Google Scholar]
- 23. Gandhi SK, Salmon W, Kong SX, Zhao SZ. Administrative databases and outcomes assessment: an overview of issues and potential utility. J Manag Care Pharm. 1999;5:215–222. [Google Scholar]