

Abstract
Metastatic cancer patients experience a severe loss of skeletal muscle mass and function known as cachexia. Cachexia is associated with poor prognosis and accelerated death in cancer patients, yet its underlying mechanisms remain poorly understood. Here, we identify the metal transporter ZIP14 as a critical mediator of cancer-induced cachexia. ZIP14 is upregulated in cachectic muscles from mice and patients with metastatic cancer and can be induced by TNF-α and TGF-β cytokines.
Strikingly, in vivo manipulation of Zip14 expression has profound impact on muscle atrophy in experimental models of metastasis.
We find that ZIP14-mediated zinc uptake in muscle progenitor cells represses the expression of the key myogenic factors MyoD and Mef2c, and blocks muscle-cell differentiation. Importantly, ZIP14-mediated zinc accumulation in differentiated muscle cells induces myosin heavy chain loss. These results highlight a previously unrecognized role for altered zinc homeostasis in muscle during metastatic-cancer-induced cachexia, and implicate ZIP14 as a therapeutic target for its treatment.
INTRODUCTION
The vast majority of cancer-related deaths occur due to metastasis1,2. Lethality from metastasis can be attributed to two distinct factors. First, the invasion and growth of metastatic cancer cells within different organs can disrupt their normal physiological functions. Second, metastatic tumors release soluble proteins, exosomes, and metabolites3–5 that can systemically affect organs that are otherwise cancer-free. For instance, cancer cells rarely metastasize to skeletal muscle, but tumor-secreted factors induce extensive muscle wasting3 resulting in a syndrome known as cachexia6,7. Cachectic cancer patients often become too weak to tolerate standard doses of anti-cancer therapies, and those with wasting of diaphragm and cardiac muscles often die prematurely due to respiratory and cardiac failure6,8. Notably, cachexia shortens the survival of cancer patients with no approved drugs that can effectively alleviate this condition9.
A characteristic feature of cancer cachexia is a reduction in muscle size also known as muscle atrophy, a process characterized by marked deterioration of cellular organelles, cytoplasm and proteins in muscles10,11. Indeed, enhanced breakdown of muscle proteins often accompanied by decreased synthesis contribute to the altered muscle homeostasis and muscle mass loss in cancer cachexia6. Although cachexia is a key indicator of poor prognosis in cancer patients, the underlying molecular mechanisms of muscle wasting remain poorly understood.
Cachexia is predominantly observed in advanced cancer patients with metastasis3,12,13. To identify new potential mediators and drivers of metastatic-cancer-induced cachexia, we analyzed five independent metastatic models of colon, breast and lung cancer, that gradually develop cachexia during metastatic progression. These analyses identified a zinc transporter, solute carrier family 39, member 14 (Slc39a14, also known as Zip14), that was significantly upregulated in the cachectic muscles from metastatic cancer mouse models and patients.
Zinc is essential for normal growth and immune functions as well as the activity of many transcription factors and enzymes14,15. Interestingly, excess zinc accumulation has been observed in cachectic muscles in animal models and patients16,17, but the mechanism driving this accumulation and the consequence of muscle zinc overload during cancer metastasis has not been studied. By manipulating Zip14 expression in vivo using metastatic cancer mouse models, we demonstrate that ZIP14-mediated zinc influx in muscle cells is critical for the development of cancer-induced cachexia. Our findings uncover a novel role for ZIP14 in promoting muscle atrophy and potentially blocking muscle regeneration in metastatic cancer.
RESULTS
Development of cachexia in metastatic cancer models
To investigate the mechanisms that drive muscle wasting during the advanced stages of cancer7,12, we performed allografts using 4T1 cells, a murine metastatic breast cancer cell line, and C26m2 cells, a metastatic subline of C26 murine colon cancer cells that we generated (Fig. 1a, Supplementary Fig. 1a,b) by in vivo selection18. To test whether C26m2 and 4T1 cells induce cachexia during metastatic progression, we used a modified tumor-resection-and-relapse approach19 for metastasis development (Supplementary Fig. 1c). To this end, we engineered each cell line to express luciferase and implanted them subcutaneously. Resulting tumors were resected two to three weeks later, after which bioluminescence imaging confirmed no detectable signal at the implanted site (Supplementary Fig. 1d). Two to three weeks following tumor removal, we detected distant metastases in C26m2- and 4T1-implanted mice (Supplementary Fig. 1d) as well as a concomitant reduction in body weight and grip strength (Fig. 1a, b). Morphometric analysis of tibialis anterior muscle sections revealed that fiber diameters were markedly reduced compared to control muscles from non-tumor-bearing mice (Fig. 1c, d and Supplementary Fig. 1e). Importantly, marker genes of muscle atrophy (Trim63/MuRF1, MAFbx/Atrogin1/Fbxo32, Fbxo31, and Musa1/Fbxo30) that encode ubiquitin ligases10,11 were transcriptionally upregulated in the cachectic tibialis anterior and diaphragm muscles from the 4T1 and C26m2 metastasis models (Fig. 1e). The following muscle groups also showed induction of the muscle atrophy genes: i) extensor digitorum longus (EDL) muscles with a predominance of fast-twitch, glycolytic fibers, ii) soleus muscles with a predominance of slow-twitch, oxidative fibers, iii) gastrocnemius and quadriceps with mixed-fiber types, and iv) cardiac muscles (Supplementary Fig. 1f-g). Notably, cachectic symptoms were not due to anorexia in either model (Supplementary Fig. 1h, i). These results indicate that, similar to human cancers12,20,21, metastatic C26m2 and 4T1 cancer cells systemically induce cachexia in muscle groups of diverse fiber types. Furthermore, these metastatic models eliminate the physical complications of a large tumor burden12,22 and create a protracted therapeutic window for testing potential anti-cachexia treatments in the future.
Figure 1. Characterization of metastasis-induced cachexia models.
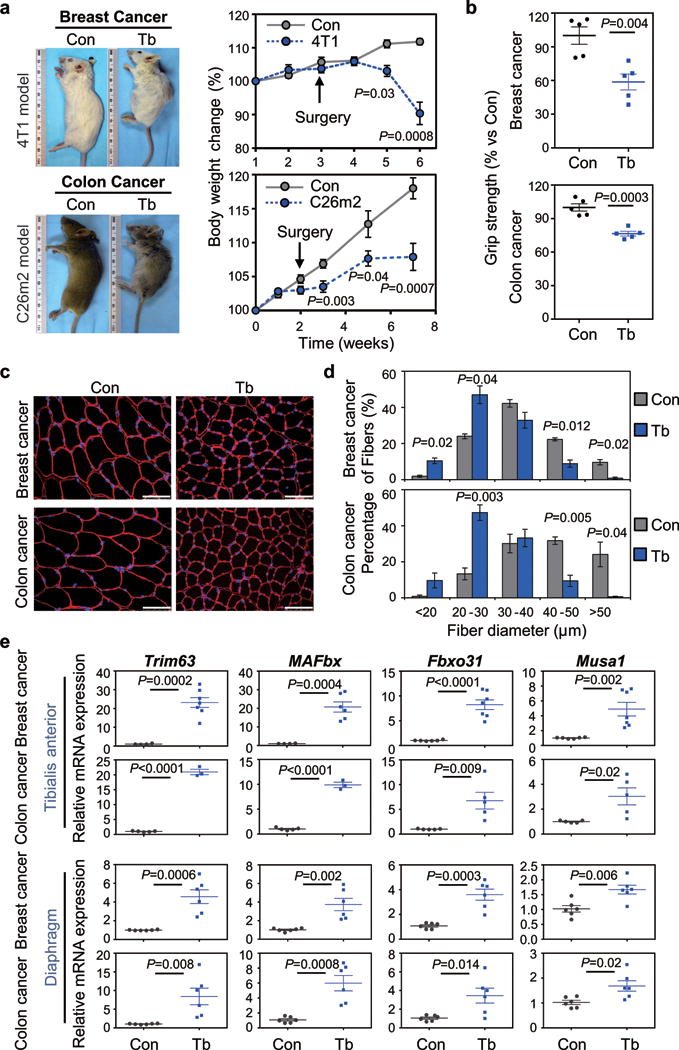
(a) Mouse images (left) and body weight analysis (right) of tumor-bearing mice (Tb) and non-tumor- bearing control (Con) mice. Using the tumor-resection-and-relapse approach for spontaneous metastasis assay, luciferase-labeled 4T1 or C26m2 cancer cells (derivation in Supplementary Fig. 1a,b) were implanted subcutaneously and after 2-3 weeks of tumor growth, tumors were surgically removed (as indicated by arrow). Metastasis was monitored by bioluminescence imaging (see Supplementary Fig. 1c,d). Mice were euthanized with cachectic symptoms such as a body condition score <1.5, reduced body weight and hunched posture. n=9 for Tb (4T1), n=6 for Balb/c (Con); n=9 for Tb (C26m2), n=10 for CD2F1 (Con).
(b) Hind-limb grip strength measurements of mice bearing 4T1 or C26m2 metastases at 5 weeks post tumor-cell injection (n=5 mice per group). Values were normalized to control.
(c,d) Representative immunofluorescence images (c) and associated morphometric analysis (d) of cross- sections from tibialis anterior (TA) muscles harvested from mice at 5 weeks post tumor-cell injection (see panel a), compared to their respective non-tumor-bearing controls. (c) Sections immunostained with antibody against laminin (shown in red) and stained with DAPI (shown in blue). Scale bars, 50 μm. (d) Morphometric analysis is depicted as the distribution frequency of fiber size categorized by fiber diameter. n=3 mice per group for control and tumor-bearing mice for 4T1 model; n=4 controls and n=3 tumor bearing mice for C26m2 model.
(e) Quantitative RT-PCR (qRT-PCR) analysis of muscle atrophy markers Trim63, MAFbx, Fbxo31, Musa1 in TA and diaphragm muscles. For TA muscles, n=4 controls and n=7 mice bearing 4T1 for Trim63 expression, n=4 controls and n=6 mice bearing 4T1 for MAFbx expression, n=6 controls and n=7 mice bearing 4T1 for Fbxo31 and Musa1 expression; n=5 controls and n=3 mice bearing C26m2 for Trim63 and MAFbx expression, n=5 controls and n=5 mice bearing C26m2 for Fbxo31 and Musa1 expression. For diaphragm muscles, n=6 mice per group for both 4T1 and C26m2 models.
Error bars represent SEM and all data were represented by mean ± SEM. P values were determined by two-tailed, unpaired Student’s t-test (a,b,e), and two-sided Welch’s t-test (d).
ZIP14 is upregulated in the cachectic muscles from metastatic models
To identify potential mechanisms mediating the development of cachexia in the C26m2 and 4T1 metastatic models, we analyzed the transcriptome of their cachectic tibialis anterior muscles by RNA sequencing (Fig. 2a). Unsupervised principal component analysis showed that gene expression profiles from cachectic muscles segregated independently from their respective controls (Supplementary Fig. 2a). Notably, we observed significantly concordant transcriptional changes in the C26m2 and 4T1 models with 3140 common differentially expressed genes, indicative of overlapping mechanisms (Supplementary Fig. 2b). Functional annotation clustering of the common genes (Supplementary Table 1) using DAVID (Database for Annotation, Visualization and Integrated Discovery) identified 5 clusters with upregulated genes (Fig. 2a and Supplementary Table 2a) and 4 clusters with downregulated genes (Supplementary Table 2b) with enrichment scores (ES) ≥ 5.0 (p < 0.05). Consistent with previous studies23,24, a marked enrichment in pathways associated with protein degradation (autophagy and proteasome) was observed in cachectic muscles by the following three independent analyses: i) functional annotation clustering using DAVID (Fig. 2a, Supplementary Table 2a), ii) Gene Set Enrichment Analysis (GSEA) using KEGG pathway gene sets (Supplementary Fig. 2c), and iii) quantitative RT-PCR for genes associated with ubiquitination, ubiquitin-proteasome and autophagy-lysosomal systems (Supplementary Fig. 2d-e). Unexpectedly, genes associated with zinc binding and zinc transport were significantly enriched in the cachectic muscles from the 4T1 and C26m2 metastasis models (ES = 12.08, p < 0.00001, Fig. 2a and Supplementary Table 2a). In particular, the zinc transporter Slc39a14 (also known as Zip14) was highly upregulated in the cachectic tibialis anterior and diaphragm muscles and uniquely upregulated among multiple zinc transporters (Fig. 2b-d, Supplementary Fig. 2f-g and Supplementary Table 1). Zip14 upregulation was also observed in the cachectic gastrocnemius, quadriceps, soleus, EDL and cardiac muscles (Supplementary Fig. 2h), indicative of Zip14 upregulation in multiple muscle groups during cachexia development.
Figure 2. The metal ion transporter gene Zip14 is upregulated in cachectic muscles from both 4T1 and C26m2 metastatic mouse models.
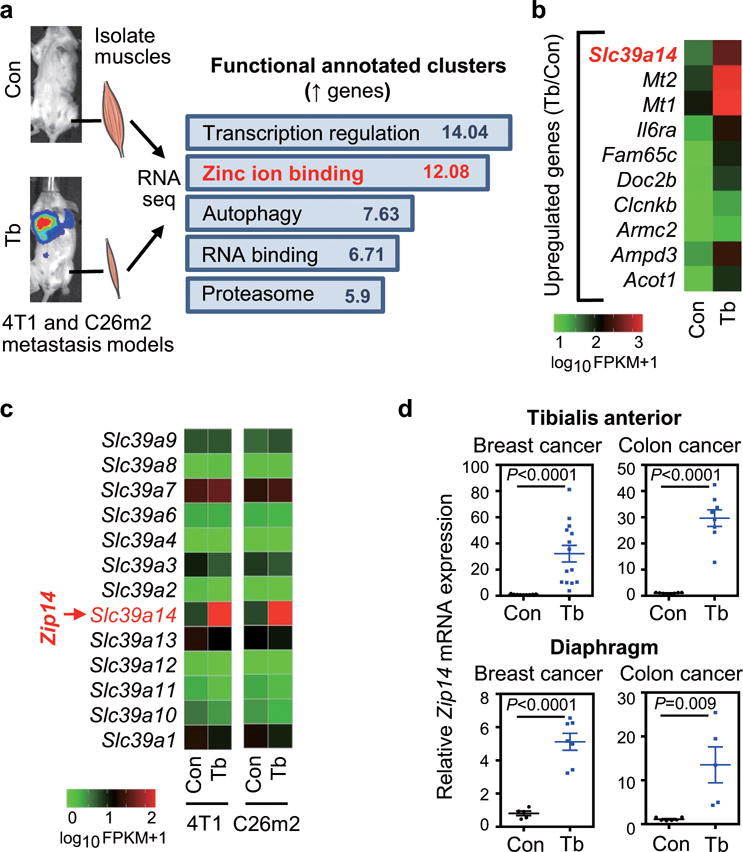
(a) Transcriptomic profiling by RNA-Seq analysis of tibialis anterior (TA) muscles collected from mice with 4T1 or C26m2 metastases (Tb) or non-tumor-bearing, age-matched controls (Con) at five weeks post tumor-cell injection (see Fig. 1a). Supplementary Table 1 contains the full list of differentially expressed genes common between the two models with significant p values and q values (cutoff=0.05), sorted by decreasing log2 fold change in C26m2 data. Functionally annotated clusters were determined by DAVID (Database for Annotation, Visualization and Integrated Discovery) analysis using the common differentially expressed genes between the 4T1 and C26m2 models, with a cutoff of log2 fold change of 1.0 and significant p and q values (see Supplementary Table 2). Significant functional clusters of upregulated genes with an enrichment score (ES) >5.0 and p value <0.05 are shown in (a). n=2 controls and n=2 mice bearing 4T1 metastases; n=2 controls and n=2 mice bearing C26m2 metastases were used for transcriptomic profiling and subsequent analysis.
(b) Top 10 upregulated genes in cachectic muscles from 4T1 and C26m2 metastasis models (from analysis in panel a) sorted by decreasing log2 fold change (in C26m2 data) with q-value cutoff of 0.05 are shown as an alphabetically ordered heatmap.
(c) Expression levels of the Slc39 family of zinc influx transporter genes in cachectic muscles from RNA-Seq analysis (from panel a) are shown relative to their respective controls. Slc39a14 (Zrt- and Irt-like protein 14, also known as Zip14) is highlighted in red on the heatmaps (b, c).
(d) qRT-PCR analysis of Zip14 in TA muscles and diaphragm muscles from Control (Con) or 4T1 and C26m2 tumor-bearing (Tb) mice. For TA muscles, n=9 control mice and n=14 mice using the 4T1 model; n=8 control mice and n=8 mice using the C26m2 model. For diaphragm muscles, n=5 control mice and n=7 mice using the 4T1 model; n=6 control mice and n=5 mice using the C26m2 model.
Error bars represent SEM and all data were represented by mean ± SEM. P-values in (a) were determined by one-tailed Fisher’s exact test, and P-values were further corrected using the Benjamini-Hochberg’s procedure. P values in (d) were determined by two-tailed, unpaired Student’s t test.
ZIP14 expression is associated with cachexia development in metastatic patients and mouse models and can be upregulated by TGF-β and TNF-α cytokines
To explore whether Zip14 upregulation is a common phenomenon during metastasis-induced cachexia, we analyzed genetically-engineered mouse models (GEMMs), xenograft and allograft models of metastatic lung cancer25 (Fig. 3a and Supplementary Fig. 3a). GEMMs of metastatic lung cancer driven by conditional expression of KrasG12D combined with either p53 or Lkb1 deletion25, and a xenograft model of EGFR-mutant PC9-BrM3 human lung cancer26, showed body weight loss and signs of muscle atrophy (Fig. 3a-b). Notably, Zip14 was also induced in the cachectic muscles of these metastatic models (Fig. 3b). In contrast, upon conditional deletion of Pten and Lkb1 in a lung cancer GEMM27, which developed significant primary tumor burden but no detectable metastases, there was no marked weight loss or changes in the expression of muscle atrophy markers or Zip14 at this timepoint (Supplementary Fig. 3a-c). To test whether Zip14 expression can be induced by metastasis in the absence of cachexia, we analyzed an allograft mouse model of metastatic small cell lung cancer (SCLC) driven by conditional deletion of Rb and p53 that fails to induce cancer-associated muscle wasting (Fig. 3b and Supplementary Fig. 3a, 3d-e). Our results (Fig. 2d and 3a-b) indicate that upregulation of Zip14 in muscle is specifically associated with cachexia in diverse metastatic models across several cancer types.
Figure 3. ZIP14 is upregulated in cachectic muscles from metastatic mouse models and patients, and is induced by TNF-α and TGF-β.
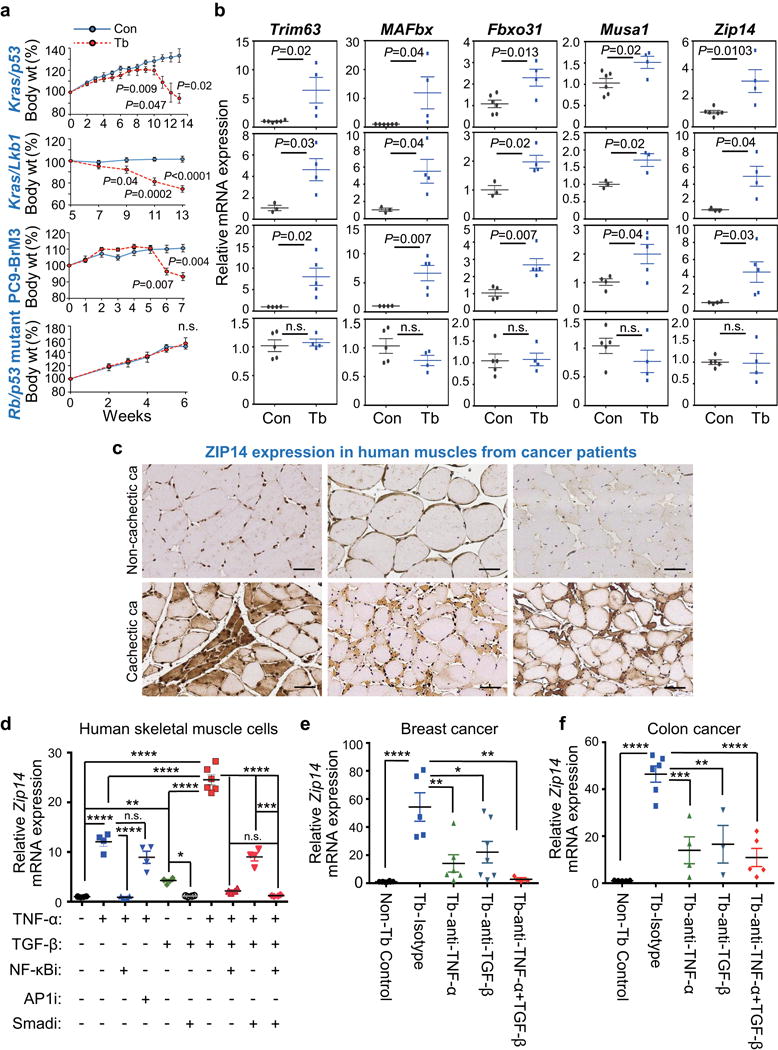
(a,b) Body weight measurements (a) and qRT-PCR analysis of Trim63, MAFbx, Fbxo31, Musa1 and Zip14 in TA muscles (b) derived from four independent metastatic lung cancer models, compared to respective age-matched controls. Metastatic models include conditional Kras/p53 mutant (KrasLSL-G12D/+-p53fl/fl) and Kras/Lkb1 mutant (KrasLSL-G12D/+-Lkb1fl/fl) in which muscles were collected at 13 weeks post adeno-Cre induction, PC9-BrM3 xenograft in which muscles were collected at 7 weeks post tumor-cell injection, and Rb/p53 mutant allografts in which muscles were collected at 6 weeks post tumor resection (see also Supplementary Fig. 3a). For body weight analysis in (a), n=4 controls and n=8 Kras/p53 conditional mutant mice, n=3 controls and n=6 Kras/Lkb1 conditional mutant mice, n=3 controls and n=10 PC9-BrM3 xenograft mice, and n=3 controls and n=10 Rb/p53 mutant allograft mice. For qRT-PCR analysis in (b), n=6 controls and n=4 Kras/p53 conditional mutant mice, n=3 controls and n=4 Kras/Lkb1 conditional mutant mice, n=4 controls and n=5 PC9-BrM3 xenograft mice, and n=5 controls and n=4 Rb/p53 mutant allograft model mice.
(c) Representative images of ZIP14 immunohistochemistry on human muscle cross-sections from non-cachectic (upper panel) and cachectic (lower panel) metastatic cancer patients. ZIP14 antibody details are shown in Supplementary Fig. 3f-h. Scale bars, 50 μm. ca, cancer. Patient details are listed in Supplementary Table 3. Data is representative of three independent experiments.
(d) qRT-PCR analysis of Zip14 in human skeletal primary muscle cells treated with either vehicle, TNF-α (50 ng/ml), TGF-β (10 ng/ml), or both TNF-α (50 ng/ml) + TGF-β (10 ng/ml), either alone (vehicle) or in the presence of 10 μM of the indicated inhibitors. Cells were pretreated with either vehicle or the indicated inhibitors for 1 hour prior to adding the cytokines (TGF-β for 9 hours, and TNF-α for 3 hours before harvest). Cells from all groups were harvested at the same time. n=6 samples for cells treated with vehicle, TGF-β alone or TNF-α together with TGFβ; n=4 samples for all the other groups. Inhibitors: NF-κBi = NF-κB inhibitor (BAY 11-7085); AP1i = AP1 inhibitor (CC401); Smadi = TGFβ receptor I inhibitor (SB431542).
(e,f) qRT-PCR analysis of Zip14 in TA muscles after neutralizing antibody treatment. Following the tumor-resection-and-relapse approach (see Fig. 1a and Supplementary Fig. 1c), mice injected with either 4T1 (e) or C26m2 tumor cells (f) were treated with either an isotype control antibody, or a neutralizing antibody against TNF-α, TGF-β, or both (200 μg antibody per mouse treated three times a week) starting one week after surgery, for a period of one week. For 4T1 model, n=8 non-tumor bearing control mice, n=5 tumor bearing mice treated with isotype control, n=6 tumor bearing mice treated with TNF-α antibody, n=7 tumor bearing mice treated with TGF-β antibody, and n=3 tumor bearing mice treated with both TNF-α and TGF-β antibodies. For C26m2 model, n=5 non-tumor bearing control mice, n=6 tumor bearing mice treated with isotype control, n=4 tumor bearing mice treated with TNF-α antibody, n=3 tumor bearing mice treated with TGF-β antibody, and n=5 tumor bearing mice treated with both TNF-α and TGF-β antibodies.
Error bars represent SEM and all data were represented by mean ± SEM. P values were determined by two-tailed, unpaired Student’s t test in (a, b) and with one-way ANOVA with post-hoc Tukey’s test in (d-f) with F value (DFn, DFb) for d F(9, 36) = 161.9, e F(4, 24) = 10.3, and f F(4, 18) = 20.7. n.s., not significant. *P<0.05, **P<0.01, ***P<0.001 and ****P<0.0001. Con, non-tumor bearing control; Tb, tumor-bearing.
To next evaluate the clinical relevance of Zip14 upregulation in human cancer cachexia, we performed immunohistochemical analyses on muscle sections from advanced cancer patients with metastatic disease. Blinded pathological examination revealed that 19 of 43 cancer patients with cachexia showed specific ZIP14 staining in atrophic muscle fibers compared to 8 of 53 non-cachectic cancer patients (Pearson’s Chi-square test, P= 0.002, Fig. 3c, Supplementary Fig. 3f-h, Supplementary Table 3). Importantly, ZIP14 staining was low in the non-atrophic fibers in muscles from both non-cachectic and cachectic cancer patients (Fig. 3c). Two additional anti-ZIP14 antibodies validated these findings (Supplementary Fig. 3i). Thus, ZIP14 protein is significantly elevated in the atrophic muscles of metastatic cancer patients with cachexia.
To identify soluble factors that can upregulate Zip14 during cachexia, we analyzed the upstream signaling pathways in cachectic muscles by Ingenuity pathway analysis (IPA). We queried the list of differentially expressed genes (Supplementary Table 1) in cachectic muscles common to the 4T1 and C26m2 metastasis models for upstream transcriptional regulators (Supplementary Fig. 3j and Supplementary Table 4, 5). We tested candidate pathways and found that treatment of human primary muscle cells and murine C2C12 myoblasts with recombinant TNF-α and TGF-β proteins significantly induced Zip14 expression (Fig. 3d and Supplementary Fig. 3k). Importantly, Zip14 expression was blocked in both human primary muscle cells and murine C2C12 cells by inhibition of TNF-α -induced NF-κB activation with Bay11-7085 (but not by inhibition of TNF-α -induced c-Jun/AP1 activation with CC-401) and by inhibition of TGF-β-induced Smad phosphorylation with the TGF-βRI Kinase inhibitor SB431542 (Fig. 3d and Supplementary Fig. 3k-m). TNF-α and TGF-β cytokines are intricately linked to cancer metastasis28,29 and were detected in the C26m2 and 4T1 metastatic tumor microenvironments (Supplementary Fig. 3n-o). Moreover, elevated levels of TNF-α and TGF-β cytokines have been reported in the serum of mouse models and patients with advanced cancers and are known to activate many cachexia-promoting signaling pathways3,28,30,31. Importantly, neutralization of TGF-β and TNF-α cytokines using a pan-TGF-β neutralizing antibody (clone 1D11) or TNF-α neutralizing antibody (clone XT3.11) reduced Zip14 expression in the tibialis anterior muscles in 4T1 and C26m2 metastasis models (Fig. 3e-f) and was associated with a concomitant reduction in Smad2 phosphorylation and NF-κB activation (Supplementary Fig. 3p-q). These findings suggest that TGF-β and TNF-α cytokines contribute to ZIP14 upregulation in cachectic muscles in metastatic cancer.
ZIP14 upregulation and zinc accumulation in muscle mediates cancer-induced cachexia
To determine whether ZIP14 is required for the development of cancer-induced cachexia, we implanted cancer cells subcutaneously into Zip14 germline knockout and wild-type mice and evaluated the effects of ZIP14 loss (Fig. 4a-c, Supplementary Fig. 4a). Zip14 knockout mice are viable but display dwarfism, scoliosis, shortened bones, defective cartilage formation and behavioral problems32. Upon tumor implantation, Zip14 knockout and wild-type mice developed metastasis with similar tumor growth (Supplementary Fig. 4b). Notably, Zip14-deficient mice were significantly resistant to cancer-induced muscle wasting (Fig. 4a-c and Supplementary Fig. 4c-d). Examination of gastrocnemius, tibialis anterior and EDL muscles revealed no change in the distribution of oxidative and glycolytic fibers, fiber- type switching, or vascularization between wild-type and Zip14-knockout mice in the presence or absence of tumor burden, as determined by succinate dehydrogenase (SDH) staining, immunostaining analysis using antibodies against myosin heavy chain isoforms, and quantitation of CD31+ capillaries/fiber by immunostaining analysis, respectively (Supplementary Fig. 4e-h and data not shown). These results suggest that ZIP14 mediates cancer-induced muscle wasting.
Figure 4. ZIP14-mediated zinc uptake in muscles promotes metastatic-cancer-induced cachexia.
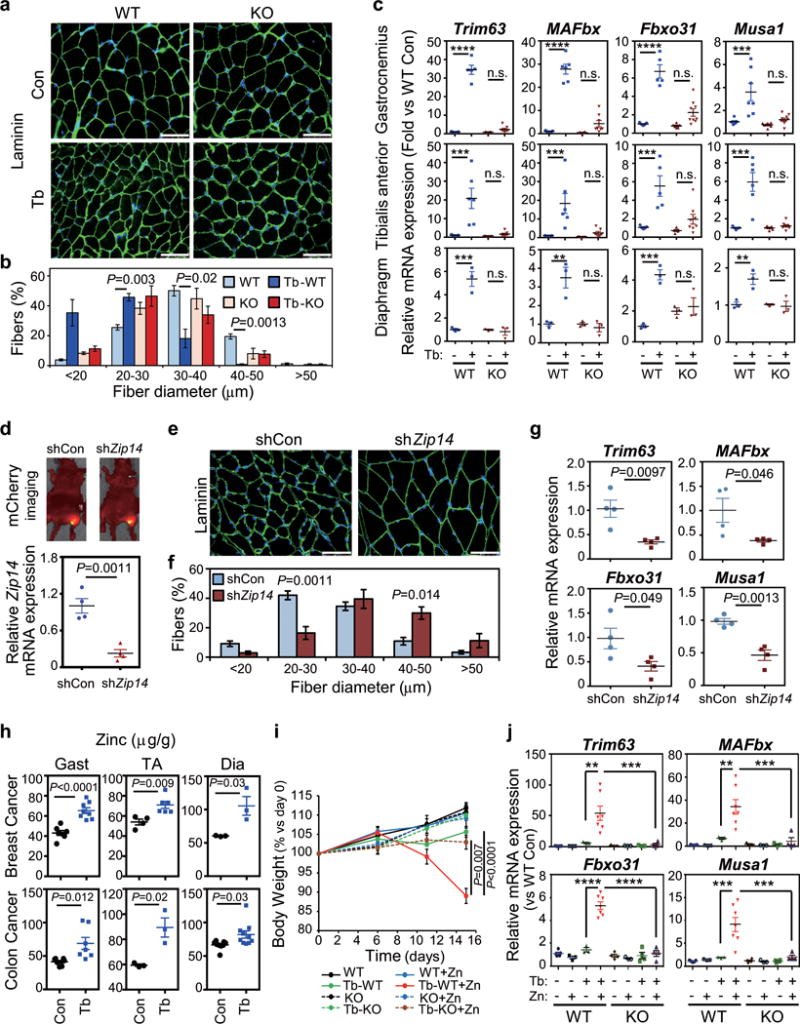
(a,b) Representative immunofluorescence images (a) and associated morphometric analysis (b) of cross- sections of gastrocnemius muscles harvested from mice at 5 weeks post 4T1-cell injection. (a) Sections immunostained with antibody against laminin (shown in green) and stained with DAPI (shown in blue). Scale bars, 50 μm. (b) Morphometric analysis is depicted as the distribution frequency of fiber size categorized by fiber diameter. n=4 WT control mice, and n=3 mice for all other groups.
(c) qRT-PCR analysis of the indicated atrophy markers in gastrocnemius, tibialis anterior or diaphragm muscles from Zip14 wild-type (WT) and Zip14-knockout (KO) mice, with or without 4T1 tumor-cell injection, collected five weeks post injection. For gastrocnemius muscles, n=7 WT controls, n=5 WT mice bearing 4T1, n=6 KO mice and n=7 KO mice bearing 4T1 for analyzing Trim63 expression; n=7 WT controls, n=6 WT mice bearing 4T1, n=6 KO mice and n=8 KO mice bearing 4T1 for MAFbx expression; n=7 WT controls, n=5 WT mice bearing 4T1, n=6 KO mice and n=9 KO mice for Fbxo31 expression, n=7 WT controls, n=7 WT mice bearing 4T1, n=6 KO mice and n=10 KO mice bearing 4T1 for Musa1 expression. For TA muscles, n=7 WT controls, n=6 WT mice bearing 4T1, n=5 KO mice and n=7 KO mice bearing 4T1 for Trim63 and MAFbx expression; n=5 WT controls, n=5 WT mice bearing 4T1, n=5 KO mice and n=8 KO mice for Fbxo31 expression, n=5 WT controls, n=6 WT mice bearing 4T1, n=5 KO mice and n=8 KO mice bearing 4T1 for Musa1 expression. For diaphragm muscles, n=3 per group. Data were normalized to non-tumor- bearing Zip14 WT mice.
(d) AAV vectors expressing mCherry and a shRNA targeting either a scrambled sequence (shCon) or Zip14 (shZip14) were injected intramuscularly into the gastrocnemius muscles and monitored by fluorescence imaging. A representative image taken five weeks after injection of AAV particles intramuscularly is shown in the upper panel. C26m2 cancer cells were then subcutaneously injected, and metastasis was monitored as previously described (see Fig. 1a and Supplementary Fig. 1c). Muscles were collected five weeks after tumor-cell injection, and Zip14 expression was determined by qRT-PCR analysis (lower panel). n=4 mice per group. Data were normalized to shCon.
(e,f) Representative immunofluorescence staining images of laminin (e) and morphometric analysis of muscle size in gastrocnemius muscles from C26m2 tumor-bearing (Tb) mice injected with either shCon or shZip14 (f). (e) Sections immunostained with antibody against laminin (shown in green) and stained with DAPI (shown in blue). Scale bars, 50 μm. (f) Morphometric analysis is depicted as the distribution frequency of fiber size categorized by fiber diameter. n=3 mice for shCon, and n=4 mice for shZip14.
(g) qRT-PCR analysis of the indicated genes in gastrocnemius muscles from C26m2 tumor-bearing (Tb) mice shown in (d), n=4 mice per group. Data were normalized to shCon.
(h) Zinc levels in gastrocnemius (gast), TA and diaphragm (dia) muscles (μg/g of dry weight) determined by inductively-coupled-plasma-mass-spectrometry (ICP/MS) analysis from either non-tumor-bearing control mice or mice bearing either 4T1 or C26m2 metastases collected at 5 weeks post tumor-cell injection. For 4T1 model, n=7 controls and n=8 tumor bearing mice for gastrocnemius muscles; n=4 controls and n=6 tumor bearing mice for TA muscles; n=3 mice per group for diaphragm muscles. For C26m2 model, n=7 mice per group for gastrocnemius muscles; n=3 mice per group for TA muscles; n=8 controls and n=10 tumor bearing mice for diaphragm muscles.
(i,j) Body weight analysis (i) and qRT-PCR analysis of the indicated genes in TA muscles (j) of Zip14 wild-type (WT) and Zip14 knockout (KO) mice, either injected with C26m2 cancer cells or left uninjected as non-tumor-bearing controls. Mice were subdivided into two groups on the day of tumor cell injection and treated with either normal or zinc-supplemented drinking water for the indicated number of days in (i). TA muscles were harvested for qRT-PCR analysis after 15 days on zinc-supplemented water in (j). For body weight analysis (i), n=8 mice for WT, Tb-WT and Tb-WT+Zn; n=7 mice for WT+Zn; n=4 mice for KO, KO+Zn and Tb-KO; n=5 for Tb-KO+Zn. For gene expression analysis (j), n=5 WT mice, n=3 WT+Zn mice, n=3 Tb-WT mice, n=7 Tb-WT+Zn mice, n=3 KO mice, n=3 KO+Zn mice, n=3 Tb-KO mice and n=4 Tb-KO+Zn mice for analyzing Trim63 and MAFbx; n=5 WT mice, n=3 WT+Zn mice, n=3 Tb-WT mice, n=7 Tb-WT+Zn, n=4 KO mice, n=3 KO+Zn mice, n=4 Tb-KO mice and n=4 Tb-KO+Zn mice for analyzing Fbxo31 and Musa1. Data in (j) were normalized to non-tumor- bearing Zip14 WT mice on regular water without zinc supplementation.
Error bars represent SEM and all data were represented by mean ± SEM. P values were determined by two-tailed, unpaired Student’s t-test in (d, g, h and i), two-sided Welch’s t-test in (b and f), and one-way ANOVA with post-hoc Tukey’s test in (c and j) with F value (DFn, DFd) for c Trim63-Gastrocnemius F(3, 21) = 221.0, c Trim63-TA F(3, 21) = 13.7, c Trim63-Diaphragm F(3, 8) = 39.1, c MAFbx-Gastrocnemius F(3, 23) = 101.0, c MAFbx-TA F(3, 21) = 10.4, c MAFbx-Diaphragm F(3, 8) = 17.3, c Fbxo31-Gastrocnemius F(3, 23) = 41.2, c Fbxo31-TA F(3, 19) = 11.6, c Fbxo31-Diaphragm F(3, 8) = 16.3, c Musa1-Gastrocnemius F(3, 26) = 12.3, c Musa1-TA F(3, 20) = 22.2, c Musa1-Diaphragm F(3, 8) = 11.2, j Trim63 F(7, 23) = 8.5, j MAFbx F(7, 23) = 10.0, j Fbxo31 F(7, 25) = 51.5, j Musa1 F(7, 25) = 10.7. n.s., not significant. **P<0.01, ***P<0.001 and **** P<0.0001. Con, control; Tb, tumor-bearing.
To rule out secondary effects of germline Zip14 loss, we depleted Zip14 levels in muscles by short-hairpin (sh), RNA-mediated knockdown and determined its effect on cancer-induced cachexia. To this end, we transduced gastrocnemius muscles with an adeno-associated virus (AAV) expressing mCherry (to confirm successful transduction) in combination with either a shRNA targeting Zip14 (shZip14), or a scrambled control (shCon, Fig. 4d). We injected a group of these mice with C26m2 cancer cells and monitored metastasis and cachexia development (as shown in Fig. 1a and Supplementary Fig. 1c) while remaining mice were used as non-tumor-bearing controls. We confirmed Zip14 knockdown in muscles by both qRT-PCR and immunostaining analysis (Fig. 4d and Supplementary Fig. 4i, respectively). Consistent with the Zip14 knockout findings (Fig. 4a-c), Zip14 knockdown in muscles was also associated with a significant rescue of cancer-induced muscle atrophy (Fig. 4e-g and Supplementary Fig. 4j). No differences in tumor burden (Supplementary Fig. 4k), distribution of oxidative and glycolytic fibers, fiber-type, and vascularization were observed between the shCon and sh-Zip14 groups (Supplementary Fig. 4l-n). In contrast, Zip14 depletion in the muscles of normal mice had no prominent phenotype without any tumor burden (Supplementary Fig. 4o-s). These findings support that muscle-specific Zip14 expression is required for muscle wasting in the context of metastatic cancer.
Based on the induction of genes encoding zinc-binding proteins in cachectic muscles (Fig. 2a-b) and the ability of ZIP14 to transport zinc in other tissues33, we asked whether ZIP14 imports zinc into muscle cells. Indeed, mice harboring C26m2 and 4T1 metastases showed aberrant accumulation of zinc in the cachectic muscles (gastrocnemius, tibialis anterior, diaphragm, quadriceps, soleus, EDL, and cardiac) with a concomitant reduction in the serum zinc levels (Fig. 4h and Supplementary Fig. 4t), as determined by inductively-coupled-plasma mass spectrometry (ICP-MS). Consistent with these findings, higher intracellular zinc levels were detected in single myofibers isolated from cachectic mice, as analyzed by laser-ablation inductively-coupled-plasma mass spectrometry (LA-ICP-MS) (Supplementary Fig. 4u). In contrast, tumor-bearing Zip14-null mice showed no additional zinc accumulation in muscles compared to non-tumor-bearing Zip14-null mice (Supplementary Fig. 4v). To determine whether overexpression of ZIP14 can augment zinc uptake in muscle cells, we expressed either GFP (control) or Zip14 in C2C12 myoblasts (Supplementary Fig. 4w). We next added zinc to the culture media and measured its uptake using a FluoZin-3 fluorescence based assay. Irrespective of differentiation status, Zip14-expressing C2C12 cells showed a marked increase in zinc uptake, as measured by its reduction in culture media (Supplementary Fig. 4w). These results demonstrate that ZIP14 likely functions as a zinc transporter in muscle cells.
We next reasoned that if ZIP14-mediated zinc uptake promotes the development of cancer-induced cachexia, then excess zinc should exacerbate muscle wasting in the context of cancer. In the absence of tumors, zinc supplementation had no detrimental effect on the growth kinetics of Zip14-wild-type and knockout mice (Fig. 4i). Strikingly, excess zinc induced a substantial acceleration in body weight loss and an increase in muscle atrophy in Zip14-wild-type, but not Zip14-knockout, tumor-bearing mice (Fig. 4i-j). No changes in food or water intake, behavior, liver or kidney function were observed in tumor-bearing mice with excess zinc supplementation thereby ruling out acute toxicity effects (Supplementary Fig. 4x). The Zip14/zinc-mediated cachexia was also not secondary to altered tumor burden since tumor volume was comparable between Zip14 WT and KO mice (Supplementary Fig. 4y). These results indicate that excess zinc promotes muscle wasting in mice specifically in the presence of Zip14 and cachexia- inducing metastatic tumors.
ZIP14-mediated zinc uptake blocks muscle-cell differentiation and induces myosin heavy chain loss
To understand how excess zinc might perturb muscle homeostasis and mediate muscle atrophy, we first examined which cell types in cachectic muscles express ZIP14. To this end, we purified progenitor subpopulations in muscles34 by magnetic and flow-cytometry-assisted sorting (Fig. 5a and Supplementary Fig. 5a). In muscles from both C26m2 and 4T1 metastasis models, Zip14 was specifically induced in CD45−/CD31−/Sca1−/CD34+/α7-integrin+ cells (Fig. 5a), which comprise the muscle satellite-cell population associated with cachexia34, and confirmed this finding in human muscle satellite cells expressing PAX7 (Supplementary Fig. 5b). We also observed ZIP14 expression in mature, differentiated myofibers from cachectic muscles in the C26m2 metastasis model (Fig. 5b). Therefore, ZIP14-mediated zinc accumulation may negatively impact both the process of muscle-cell differentiation and the function of differentiated muscle fibers.
Figure 5. ZIP14-mediated zinc accumulation blocks muscle-cell differentiation and induces myosin heavy chain loss.
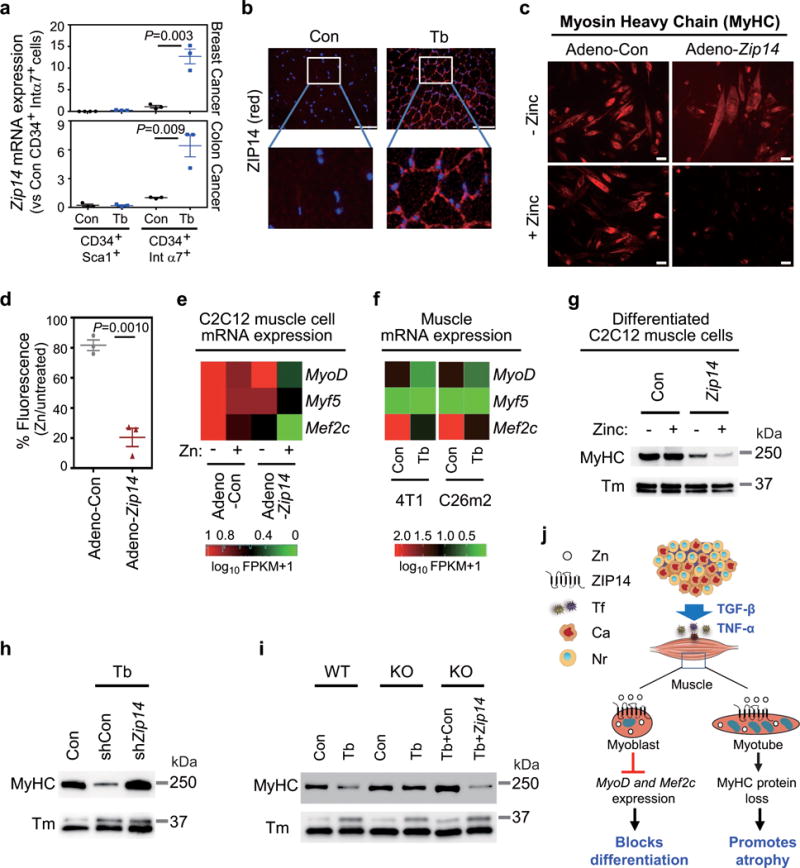
(a) qRT-PCR analysis of Zip14 expression in purified muscle progenitor subpopulations from either non-tumor-bearing control mice (Con) or mice bearing 4T1 or C26m2 metastases (Tb) harvested five weeks after tumor-cell injection (see Fig. 1a and Supplementary Fig. 1c). CD45−CD31−CD34+Sca1+and CD45−CD31−CD34+integrin-α7+cells were purified from gastrocnemius muscles using a combination of magnetic and flow-cytometry-assisted sorting (see Supplementary Fig. 5a). For 4T1 model, n=4 control mice for isolated CD34+Sca1+ cells and n=3 mice for the other groups. For C26m2 model, n=3 mice per group.
(b) ZIP14 immunofluorescence analysis using muscle sections from either non-tumor-bearing control mice or mice bearing C26m2 metastases five weeks after tumor-cell injection. ZIP14 (red), DAPI (blue). Scale bars, 50 μm. Boxed area in upper panels is magnified in the corresponding lower panels. A representative image from three independent experiments is shown.
(c,d) Immunofluorescence analysis showing myosin heavy chain (MyHC) expression in C2C12 myoblasts infected with adenovirus expressing either control (Adeno-Con) or Zip14 cDNA (Adeno-Zip14) and differentiated for 6 days, either with 0 or 50 μM ZnCl2 (zinc) replenished daily. Representative images and quantitation (d) are shown. Scale bars, 25 μm. Data presented as percentage of MyHC fluorescence signal in corresponding untreated myotubes (d). Data representative of three independent experiments (c,d).
(e) qRT-PCR analysis of MyoD, Myf5 and Mef2c expression in untreated and zinc-treated C2C12 cells expressing either Adeno-Con or Adeno-Zip14, represented as a heatmap. Adenovirus-infected C2C12 cells were differentiated for 2 days and then treated with either 0 or 50 μM ZnCl2 (zinc) for 24 hours. Data is representative of four independent experiments.
(f) RNA-Seq analysis of MyoD, Myf5 and Mef2c expression shown as heatmap (RNA seq shown in Fig. 2 and Supplementary Table 1) comparing TA muscles from non-tumor-bearing control mice to mice bearing 4T1 or C26m2 metastases, collected 5 weeks post tumor-cell injection.
(g) MyHC and tropomyosin (Tm) protein expression by immunoblot analysis in C2C12 cells infected with adenovirus expressing either control or Zip14 cDNA and differentiated for 3 days followed by treatment with either 0 or 50 μM ZnCl2 for 24 hours. Data is representative of three independent experiments. Uncropped immunoblot images are shown in Supplementary Fig. 6.
(h) Immunoblot analysis probing for MyHC and Tm in gastrocnemius muscles from mice intramuscularly injected with adeno-associated virus expressing either shCon or shZip14 and subsequently injected with C26m2 cancer cells (see Fig. 4d). Age-matched, non-tumor-bearing mice were used as a control. Data is representative of three independent experiments. Uncropped immunoblot images are shown in Supplementary Fig. 6.
(i) Immunoblot analysis probing for MyHC and Tm in gastrocnemius muscles from the indicated groups. Muscles were isolated from Zip14 WT and KO mice with (Tb) or without (Con) 4T1 metastases. Another cohort of Zip14 KO mice were injected intramuscularly with AAV-Con (mCherry) or AAV-Zip14 in the gastrocnemius muscle and injected four weeks later with 4T1 tumor cells. All mice were harvested 5 weeks post tumor-cell injection. Data is representative of three independent experiments. Uncropped immunoblot images are shown in Supplementary Fig. 6. Error bars represent SEM and all data were represented by mean ± SEM. P values in (a,d) were determined by two-tailed, unpaired Student’s t test. Con, control; Tb, tumor-bearing; Tm, Tropomyosin.
(j) Working model: During cancer progression and metastasis development, cytokines such as TNF-α and TGF-β upregulate the expression of Zip14, a metal ion transporter, in muscle progenitor and mature muscle cells. This causes an aberrant accumulation of zinc in these muscle cells. ZIP14 expression and zinc uptake in muscle progenitor cells represses key myogenic genes such as MyoD and Mef2c, and blocks muscle differentiation. ZIP14 expression in mature muscle cells causes myosin heavy chain loss, which promotes cancer-induced muscle atrophy in metastatic cancers. Tf, tumor factors; Ca, cancer cells; Nr, normal cells.
Normal muscles respond to muscle injury by activation and proliferation of muscle progenitor cells into myoblasts that differentiate to regenerate new muscle fibers35 (Supplementary Fig. 5c). In contrast, in conditions associated with muscle atrophy including in cancer, muscles are damaged followed by proliferation of muscle progenitor cells, which eventually fail to differentiate34,36 (Supplementary Fig. 5c). We first tested whether aberrant Zip14 upregulation and consequent zinc influx in muscle progenitor cells affects normal differentiation using C2C12 myoblasts and primary myoblasts (Fig. 5c-d and Supplementary Fig. 5d-f). Both cell types were infected with adenovirus expressing either GFP (Adeno-Con) or Zip14 (Adeno-Zip14), (Supplementary Figs. 4w and 5e). Each group differentiated normally in the absence of zinc as assessed by expression of myosin heavy chain (MyHC, Fig. 5c-d and Supplementary Fig. 5e) and cellular morphology (Supplementary Fig. 5f). In contrast, in the presence of zinc, the differentiation of Zip14-expressing myoblasts was selectively blocked (Fig. 5c-d and Supplementary Fig. 5e-f) with no loss in viability (Supplementary Fig. 5g-h). These findings suggest that ZIP14-mediated zinc uptake in muscle progenitor cells interferes with muscle-cell differentiation.
Myoblasts deficient in the myogenic transcription factors MyoD and Mef2 can proliferate, but are unable to differentiate35,37. We therefore considered the possibility that excess zinc could repress the levels, or activity of, myogenic transcription factors to block muscle-cell differentiation. Indeed, treatment of Zip14-expressing C2C12 myoblasts with zinc led to transcriptional repression of MyoD, Mef2c, and Myf5 (Fig. 5e) but not Cyclin D1 (Supplementary Fig. 5i), which controls proliferation and cell-cycle exit of myoblasts38,39. Furthermore, GSEA using HALLMARK-MYOGENESIS gene sets querying the cachexia signature derived from C26m2 and 4T1 metastasis models (Supplementary Table 1, Supplementary Fig. 5j) was supportive of repressed myogenesis in cachectic muscles31. Consistently, MyoD and Mef2c expression was downregulated (Fig. 5f) in cachectic muscles from C26m2 and 4T1 metastasis models, compared to non-tumor bearing controls (Supplementary Table 1). These findings identified a potential link between ZIP14-induced zinc accumulation in muscle progenitor cells and impaired muscle regeneration in the context of metastatic cancer.
Finally, we questioned whether ZIP14-mediated zinc accumulation in the mature muscle fibers (Fig. 5b) of cachectic muscles mediates cancer-induced muscle atrophy. Myofibrils constitute the organizational units in muscle with aligned thick and thin filaments that facilitate muscle contraction10. Myofibrillar proteins comprise over 70% of muscle proteins, and their reduced synthesis or loss negatively affects fiber size and function6,40. We therefore asked whether ZIP14-mediated zinc influx affects myofibrillar protein levels. To this end, we first differentiated Zip14-expressing and control myoblasts into myotubes. Myotubes were treated with zinc for 24 hours and myofibrillar proteins were extracted using high-salt lysis method41. A striking loss in MyHC protein was observed in Zip14-expressing myotubes treated with zinc by immunoblot analysis (Fig. 5g), which was confirmed by immunofluorescence analysis (Supplementary Fig. 5k-l). In contrast, no major reduction in the thin filament proteins skeletal actin, tropomyosin and troponin, the intermediate filament protein desmin, and the thick filament protein myosin light chain (MyLC) were detected under these conditions (Fig. 5g, Supplementary Figs. 5k-m and 6). Furthermore, fractionation of muscle proteins showed that both the soluble and myofibrillar fractions of MyHC predominantly decreased in Zip14-expressing myotubes with zinc treatment over other myofibrillar proteins (Supplementary Fig. 5n). These results suggest that ZIP14-mediated zinc accumulation induces the loss of both soluble and sarcomeric MyHC in mature muscle cells.
The ubiquitin-proteasome system (UPS) is one of the central pathways that regulate MyHC turnover in muscle atrophy states10,40,42,43, and loss of MyHC is associated with loss of muscle mass and function during cancer cachexia44. Therefore, we asked whether ubiquitin-mediated proteosomal degradation promotes MyHC loss in the context of ZIP14-mediated zinc influx and cancer-induced muscle wasting. Indeed, MyHC loss in differentiated C2C12 cells was associated with upregulation of Trim63, Psma1, Psmc4, Psmd11 and Ubc UPS pathway genes (Supplementary Fig. 5o) and could be blocked by the proteasome inhibitor, MG132 (Supplementary Fig. 5p). Consistent with our in-vitro studies, MyHC levels in cachectic muscles from the metastasis models were restored to normal in response to either Zip14 knockdown (C26m2 model, Fig. 5h) or loss (4T1 model, Fig. 5i) with no reduction in the expression of the other myofibrillar proteins examined (Supplementary Figs. 5q). To confirm the specificity of MyHC regulation in vivo by Zip14, we re-expressed Zip14 in Zip14-deficient muscles. To this end, we transduced the gastrocnemius muscles of Zip14 germline knockout mice with AAV-expressing Zip14 or mCherry as a control (Supplementary Fig. 5r). We implanted 4T1 cancer cells subcutaneously and evaluated the effects of Zip14 re-expression in muscle during cancer-induced cachexia. Importantly, expression of Zip14 in muscles reestablished the muscle atrophy phenotype in tumor-bearing Zip14-deficient mice (Supplementary Fig. 5s-u) resulting in significant MyHC loss (Fig. 5i). No changes in the other myofibrillar proteins, fiber type or vascularization were observed (Fig. 5i, Supplementary Fig. 5v-w). In addition, MyHC levels did not change with Zip14 expression in the muscles from non-tumor-bearing mice, which underline the importance of the tumor-context in Zip14 function (Supplementary Fig. 5x-y). These results suggest that Zip14 mediates muscle atrophy through MyHC loss in metastatic cancer.
DISCUSSION
Our understanding of cancer has expanded from a focus on strictly cell-autonomous processes to a complex interplay involving cell-extrinsic, reciprocal interactions with the tumor microenvironment1. It is now clear that cancer evolves as a systemic disease, where the influence of the tumor extends far beyond the site of tumor growth and invasion4,5. Our study was designed to identify essential molecules or signaling pathways that could potentially be targeted to alleviate this devastating side effect of metastatic cancer. We demonstrate that zinc accumulates in the skeletal muscles, far from the actual site of metastatic tumor growth, through aberrant upregulation of the ZIP14 metal-ion transporter, and this phenomenon is a critical mediator of metastasis-induced cachexia (Fig. 5j). Our studies could provide a basis for the design of anti-cachexia therapies that target ZIP14 in patients with metastatic cancers.
Zinc homeostasis is perturbed in many advanced human cancers. For instance, serum zinc levels were significantly reduced in metastatic cancer patients45, but whether this correlated with an increase in zinc uptake by other tissues was not explored. In a pilot clinical study, muscle zinc levels nearly doubled in cachectic cancer patients with >9.5% body weight loss17, although these clinical observations were not further investigated. Excess zinc accumulation in muscles has also been previously reported in animal models of cancer-induced cachexia16,17,46. Interestingly, redistribution of zinc has been reported in response to administration of IL-1α, glucagon and epinephrine, and six hours following IL-1α administration in mice, a transient reduction (up to 25%) in plasma zinc levels correlated with a dramatic increase in zinc uptake in liver, bone marrow and thymus47. However, the kinetics of zinc tissue redistribution in the context of tumor progression has not yet been studied. This information will be key to understanding how the systemic regulation of ZIP14 expression affects metastasis-induced muscle atrophy. Aberrant zinc regulation may also be an underlying cause of other muscle-wasting pathologies such as dexamethasone-induced muscle atrophy48 and muscular dystrophy49, but whether upregulation of ZIP14 also contributes to the development of these muscle-wasting conditions remains to be further explored. It is well established that metallothioneins (MT), which are cysteine-rich metal binding proteins, function in cellular zinc homeostasis15. Interestingly, Mt1 and Mt2 are upregulated in muscle atrophic conditions, and their loss promotes muscle hypertrophy48,50. Moreover, metallothionein deficiency can protect from glucocorticoid-induced atrophy48. In line with these findings, our studies show a robust induction of Mt1 and Mt2 in cachectic muscles from metastasis mouse models (Fig. 2b), which is supportive of the perturbed zinc homeostasis in these muscles. It will be interesting to further investigate the contribution of metallothioneins and other molecules involved in zinc regulation to the development of metastasis-induced cachexia. Therefore, the ability to manipulate zinc influx into muscle cells therefore has potentially far-reaching implications for a number of muscle diseases.
Since we found that ZIP14 is upregulated in cachectic muscles in both mouse models and metastatic cancer patients across multiple cancer types, it is likely that common metastasis-associated factors regulate its expression. Previous studies showed that Zip14 is induced in liver cells in response to infection, tissue injury, inflammation and chronic diseases by pro-inflammatory cytokines such as IL-6 and IL1-β15,33. Here, we identify TGF-β and TNF-α, two cytokines that are associated with metastatic cancers3,28,51, as likely inducers of Zip14 expression in muscle. However, since neutralization of TGF-β and/or TNF-α cytokines in metastatic models significantly reduced but did not completely abrogate Zip14 expression, it is possible that additional as-yet-unidentified metastasis-associated factors contribute to its upregulation in muscles.
Our study suggests that ZIP14 upregulation in muscle cells serves as a driver of metastasis-induced muscle atrophy rather than arising as an indirect consequence of muscle wasting. The key findings that are supportive of this notion are that loss of Zip14 dramatically reduced muscle atrophy in our metastatic cancer models and its re-expression restored it. It is important to note, however, that in the absence of tumor burden, overexpression of Zip14 in muscle is not sufficient to induce muscle wasting, which implies that zinc, and potentially other metastasis-induced co-factors, collaborate with ZIP14 to induce cachexia. It is also likely that other minerals such as calcium, magnesium, manganese and/or iron impact the process of cachexia development. Interestingly, ZIP14 has been implicated in iron and manganese transport in liver and brain, respectively15,52, however this function of ZIP14 has not yet been explored in muscle. In the context of bone metastases, calcium mishandling through the TGF-β-Nox4/RyR1 axis has been shown to reduce force generation and promote muscle weakness3. These studies suggest that cachexia development is likely regulated by multiple factors in metastatic cancers.
A prominent characteristic of muscle atrophy is a cellular shift toward protein catabolism, which is largely mediated by the activation of the ubiquitin-mediated proteasome and autophagy pathways10,40,53. Consistent with previous studies43,44,53, we found that cachectic muscles from metastatic mouse models showed robust transcriptional upregulation of atrophy-associated genes of the ubiquitin- proteasome and autophagy-lysosome degradation pathways along with a reduction in the myofibrillar protein, MyHC. Importantly, MyHC loss in muscles has been observed in cachectic patients and animal models41,44,54,55, suggesting that this typically abundant myofibrillar protein greatly impacts muscle size and function. In particular, its loss in diaphragm muscles may underlie respiratory failure in cancer patients41. MyHC loss can be triggered in response to several atrophy-inducing factors such as TNF-α and IFN-γ cytokines44, the glucocorticoid dexamethasone43 and as presented here, with aberrant ZIP14 upregulation and zinc accumulation in muscle. It is interesting to note that in denervation-induced atrophy, the degradation of thick filament proteins, such as Myosin Binding Protein C (MyBP-C) and MyLC 1 and 2, occurs prior to MyHC loss in a Trim63-dependent manner42. In the context of our studies demonstrating the loss of MyHC in zinc-treated Zip14-expressing myotubes in vitro and in metastasis-induced cachectic muscles in vivo, the events that mediate MyHC loss, the order of disassembly of the other myofibrillar components, and the specific role of the UPS/autophagy components in this regulation remains to be further investigated.
Zinc can serve as an intracellular signaling molecule56, and 10% of the encoded proteins in the human genome are predicted to bind zinc through zinc finger motifs57. Moreover, zinc functions as a structural and catalytic component of over 300 enzymes and transcription factors. Interestingly, the E3 ubiquitin ligase Trim63 is a member of the zinc-finger family of proteins that has been shown to physically bind to MyHC to induce its proteolysis43. In our study, Trim63 mRNA levels increased in cachectic muscles in metastatic models and in Zip14-expressing myotubes when exposed to excess zinc. Interestingly, it has been reported that increased activity of E3 ubiquitin ligases during catabolic conditions triggers their auto-ubiquitination and subsequent degradation and that transcriptional induction of these ligases during atrophy could replenish their levels during enhanced protein breakdown11.
The upregulation of Zip14 in muscle satellite cells in response to tumor factors has therapeutic implications. Normal muscle responds to injury by stimulating the activation and proliferation of satellite cells, which ultimately fuse to regenerate new muscle37,58. Muscle atrophy in response to tumor burden also triggers membrane damage and activation of the muscle satellite cells34,36, however subsequent regeneration of muscle is thought to be impaired59. This aberrant response to muscle injury differs from muscular dystrophies where muscle necrosis overtakes regenerative capacity and results in non-functional fatty and fibrous tissue60. Whether impaired regeneration represents an indirect consequence or a contributing factor to cancer-induced cachexia remains to be further investigated. However, it is likely that if muscle regeneration can be restored in atrophic muscles with simultaneous inhibition of muscle degradation, the cachexia phenotype could be significantly ameliorated in cancer. Since ZIP14 and zinc influx in satellite cells repress muscle differentiation through the downregulation of MyoD and Mef2c, inactivation of ZIP14 may also represent a means to restore normal muscle regeneration in metastatic cancer.
Zinc is indispensable for cellular functions and is tightly regulated at both systemic and cellular levels15. Indeed, we observed normal growth and body weight gain in healthy mice treated with zinc- supplemented water while tumor-bearing mice showed accelerated body weight loss and muscle wasting in a Zip14-dependent manner. Our present findings in animal models therefore suggest that the practice of administering supplemental zinc to cancer patients with low serum zinc levels needs cautious reconsideration. Close monitoring of zinc levels and consumption in patients, and the development of strategies to block ZIP14, could potentially prevent or reverse cachexia development. Our study highlights the possibility of effectively addressing this often overlooked but debilitating side-effect of advanced cancer to improve both the survival and quality of life of metastatic cancer patients.
ONLINE METHODS
Cell culture
KP161, C26 (parental), 4T1, PC9-BrM3 cells were kindly provided by Julien Sage (Stanford University), NCI-Frederick DCI Tumor depository, Yibin Kang (Princeton University) and Joan Massague (Memorial Sloan Kettering Cancer Center), respectively. C26m2 cells were derived from C26 parental cells by in vivo selection18. Human primary skeletal myoblasts were purchased from Lonza. C2C12 and 293T were purchased from ATCC. C26 and its derivative, C26m2, 4T1, and PC9-BrM3 cells were cultured in RPMI (Life Technologies) containing 10% FBS (Sigma)26,62,63. KP1 cells61 were cultured in RPMI containing iron supplemented 10% bovine growth serum (Hyclone). 293T and C2C12 cells were cultured in DMEM (Life Technologies) containing 10% FBS. Mouse primary myoblasts were cultured in Hams F-10 (Life Technologies) containing 20% FBS and 2.5 ng/ml of bFGF. All the media were supplemented with 1x Pen/Strep (100 IU/ml of Penicillin and 100 μg/ml of Streptomycin from Life Technologies). Human primary skeletal myoblasts were cultured in SKGM-2 Bullet kit media (Lonza) following manufacturer’s instructions.
Adenoviral Infection
C2C12 cells or mouse primary myoblasts were cultured overnight with 180,000 cells/well in 6-well plate or 35mm dish. C2C12 cells were infected with adenovirus expressing either GFP control (Adeno-Con) or mouse Zip14 (Adeno-Zip14) (Vector Biolabs) at 250 MOI using serum-free DMEM containing 8 μg/ml of polybrene (Sigma) for 4 hours. Primary myoblasts were infected with (Adeno-Con) or Adeno-Zip14 at 50 MOI for 2 hours in serum-free Ham’s F10 containing 8 μg/ml of polybrene, which was repeated twice in 24 hours. The infected cells were then cultured in growth medium.
Muscle differentiation assays
Differentiation was initiated after adenoviral infection by switching the growth medium to differentiation medium (DMEM containing 2% horse serum and 5 μg/ml of insulin for C2C12 cells; DMEM containing 2% horse serum without insulin for primary myoblasts) the day after infection. Differentiation medium was changed every day for the indicated time-points in the figures.
Zinc and MG132 treatment of muscle cells
3-day differentiated C2C12 cells were cultured with 50μM ZnCl2 in differentiation medium for 24 hours. Cells were then used for immunofluorescence staining, gene expression analysis and immunoblot analysis. For MG132 treatment following Polge et al, 201164, 3-day differentiated C2C12 cells expressing Zip14 (Adeno-Zip14) were treated with 50μM ZnCl2 for 24 hours, and then treated with either vehicle (DMSO) or MG132 (50μM) for 3 hours prior to harvest for immunoblot analysis.
Cell viability assay
Viability of C2C12 cells was determined by MTS assay using Promega CellTiter 96® AQueous One Solution Cell Proliferation Assay kit containing tetrazolium compound following manufacturer’s instructions. Briefly, 10,000 C2C12 cells infected with Adeno-GFP control (Adeno-Con) or Adeno-Zip14 were plated in 100 μl of growth media per well in 96-well plates and differentiated as indicated in the figures. Cells were treated with 50 μM of ZnCl2 for 24h. Cell viability was measured by adding 100 μl of growth medium without phenol red to each well after aspirating media from the wells. 20 μl of CellTiter 96 AQueous One Solution Reagent was added to each well. After 1 hour of incubation at 37°C in CO2 incubator, the amount of soluble formazan was determined by absorbance at 450 nm. Undifferentiated and differentiated C2C12 cells were collected for immunoblot analysis probing for cleaved-caspase-3 expression to assess cell-death. C2C12 cells treated with the indicated doses of doxorubicin (doxo) (purchased from Sigma) served as positive control for both types of viability assays.
Treatment with cytokines and signaling pathway inhibitors
Murine C2C12 myoblasts and human primary skeletal myoblasts were serum-starved overnight, and then treated with or without inhibitors of the TGF-β/Smad, NF-ĸB and c-Jun/AP1 pathways, which are SB431542 (Thermo Fisher), CC401 (ThermoFisher) and BAY 11-7085 (Enzo), respectively, followed by treatment with recombinant cytokines purchased from R&D Systems (recombinant mouse TNF-α and TGF-β1 at 50 ng/ml and 10 ng/ml, respectively, for C2C12, recombinant human TNF-α and TGF-β1 at 50 ng/ml and 10 ng/ml, respectively, for human primary skeletal myoblasts). In brief, cells were pretreated with either vehicle (DMSO) control, or 10 μM of the respective pathway inhibitors for 1 hour, and then treated with TGF-β1 for 9 hours or TNF-α for 3 hours before harvest. Cells with different treatments were harvested together for subsequent analysis.
Zinc Uptake Assay
Control or Zip14-expressing C2C12 cells were cultured in 96-well plate and were washed twice with serum-free and phenol red-free DMEM. Cells were then incubated with 30 μl of the same DMEM containing 0.5 μM of ZnCl2 in 5% CO2 cell culture incubator at 37°C. ZnCl2 levels remaining in the culture medium at 0, 1, 2, and 3 hours were determined with FluoZin-3 (Thermo Fisher), a zinc-specific fluorescent chelator65. Specifically, 10 μl of medium was taken out from the plate at the designated time points and mixed with 90 μl of FluoZin-3 in PBS to give final FluoZin-3 of 3 μM. The mixture was incubated for 5 mins at room temperature in the dark, and fluorescence was detected by a plate reader (Promega) at Ex494nm/Em516nm. The linear standard curve of fluorescence signal was determined by ZnCl2 with known concentrations between 0 to 10 μM.
Generation and validation of antibodies against human and mouse ZIP14
Codon optimized synthetic cDNA fragment (IDT g-Block) encoding soluble cytoplasmic domain of human (amino acids 246-352) and mouse (amino acids 243-349) ZIP14 were cloned into the pET28b+ vector. Constructs were verified by DNA sequencing and transformed into Rosetta 2(DE3) pLysS cells (Novagen). Protein expression was induced with 1 mM of IPTG and purified by FPLC with HisTrap HP column (GE Healthcare Life Sciences). The purity of the proteins was tested on 15% SDS-PAGE, indicating that purified ZIP14 domains from mouse and human were greater than 90% pure. Polyclonal antibodies against both purified human and mouse ZIP14 domains were produced in New Zealand White rabbits at Pacific Immunology Corp. To validate antibodies, western blot was performed on crude bacterial lysates (uninduced and induced) using these immunized sera. Immunized sera against human or mouse ZIP14 only detected ZIP14 domains in the induced crude lysates, confirming antibody specificity. As expected from the significantly high amino acid sequence identity between human and mouse ZIP14 domains, each of these immune sera detected both human and mouse ZIP14 domains by western blot. For immunofluorescence and immunohistochemistry, we purified IgG fraction from the immunized sera and pre-immunized sera from these rabbits by affinity chromatography using HiTrap Protein G column in FPLC system. The specificity of the purified IgGs were validated by immunohistochemical analyses using liver sections from human patients, Zip14 KO mice (negative control) and from Zip14 WT mice (positive control).
Immunohistochemical staining
Paraffin-embedded tissues were sectioned at 5 μm thickness. Slides were baked at 60°C for 1 hour and de-paraffinized, rehydrated, and treated with 1% hydrogen peroxide for 10 mins (except for TGF-β staining, which was treated with 0.6% hydrogen peroxide in methanol for 1 hour 66). Antigen retrieval was performed in citrate buffer, pH 6.0 (Vector laboratories) in a steamer with the exception of TGF-β immunostaining, in which 1 mg/ml of hyaluronidase (Sigma) in 0.1 M of sodium acetate buffer, pH 5.5, was used for 30 mins digestion at 37°C. Endogenous avidin/biotin were blocked, and for TGF-β, endogenous mouse IgG was also blocked. After the slides were further blocked with 3% BSA in PBS containing 10% goat serum, tissue sections were incubated with primary antibody including rabbit polyclonal antibodies against ZIP14 (1:250 of 06-1022 from Millipore, and 1:1000 of HPA016508 from Sigma), rabbit polyclonal antibodies against human ZIP14 (1:500) or mouse ZIP14 (1:2500) developed in our laboratory, rabbit polyclonal antibody against TNF-α (1:100 of 210-401-321 from Rockland), and mouse monoclonal antibody against TGF-β (15 μg/ml of clone 1D11.16.8 from BioXCell), followed by corresponding biotinylated secondary antibodies. ABC kit and DAB kit (Vector laboratories) were used for detection following manufacturer’s instructions. Sections were subsequently counterstained with Hematoxylin, dehydrated and mounted using Cryoseal XYL (Richard-Allan Scientific) for subsequent histological analysis.
Mouse studies
Treatment of mice was in accordance with the institutional guidelines of Columbia University Institute of Comparative Medicine and approved by The Columbia University Institutional Animal Care and Use Committee (IACUC). All animal experiments were conducted in compliance with relevant ethical regulations. Mice were housed in the animal facility at Columbia University Medical Center (CUMC) under conventional conditions with constant temperature and humidity and fed a standard diet (Labdiet 5053). Balb/c and C57Bl/6 mice were obtained from Jackson Laboratories. Athymic nude, DBA/2 and 129P2/Ola mice were obtained from Envigo. Zip14 knockout (KO) mice generated by Hojyo and Fukada laboratory32 and were obtained on a congenic Balb/c background from the Knutson Laboratory67 (University of Florida). Balb/c mice were used for 4T1 murine breast cancer cell line implantation; C57Bl/6 were crossed with 129P2/Ola to generate 129P2/Ola – C57Bl/6 mice for KP1 cell line implantation; Balb/c were crossed with DBA/2 to generate CD2F1 mice for C26 and C26m2 implantation. Zip14 mice in Balb/c background were crossed with DBA/2 to generate Zip14 knockout mice in CD2F1 background.
K-rasLSL-G12D/+, p53fl/fl, Ptenfl/fl and Lkb1fl/fl mice were obtained from the NCI Mouse Repository. K-rasLSL- G12D/+ were crossed with p53fl/fl to generate K-rasLSL-G12D/+-p53fl/fl mice, K-rasLSL-G12D/+ were crossed with Lkb1fl/fl to generate K-rasLSL-G12D/+-Lkb1fl/fl and Ptenfl/fl were crossed with Lkb1fl/fl to generate Ptenfl/fl-Lkb1fl/fl mice. Genotyping for all the strains were performed using primers listed in Supplementary table 6. Mice were weighed weekly. Food and water intake was measured by weighing food and measuring water in a graduated cylinder weekly. Mouse body condition as a measure of cachexia was assessed using a body condition scoring system as previously reported68.
Adenoviral delivery of Cre-recombinase for tumorigenesis in genetic models of lung cancer
About 2-3 month-old K-rasLSL-G12D/+-p53fl/fl, K-rasLSL-G12D/+-Lkb1fl/fl and Ptenfl/fl-Lkb1fl/fl mice were anesthetized with ketamine (100 mg/kg) and xylazine (10 mg/kg) for adenoviral infection. 2.5 × 10⁷ PFU Ad5CMVCre was added to MEM media with 0.5% CaCl2 for a total volume of 125 μl. The viruses were inhaled slowly by adding 62.5 μl at a time in the same nostril, and by waiting at least 10 mins before adding the second 62.5 μl following procedures outlined previously69.
Metastasis assays in mice
Both male and female mice were used in this study. Athymic mice aged 8-9 weeks were injected with 1×10⁵ PC9-BrM3 cells by intracardiac route into arterial circulation for experimental metastasis assays. For tumor studies, mice aged between 5-6 weeks for C26m2, 8-9 weeks for 4T1 and 4-5 weeks for KP1 injections were used. For each model, 1×10⁶ tumor cells were subcutaneously injected in the right flank of syngeneic mice as previously described. Subcutaneous tumor was removed between 2-3 weeks to allow for metastasis formation following the tumor-resection-relapse approach19. In brief, for tumor resection, mice were anesthetized with isoflurane (3-4%) administered with a precision vaporizer, and any large veins were cauterized. Buprenorphine (0.05 mg/kg) was given subcutaneously every 6-12 hours for 48 hours for pain relief after surgery. Zip14 WT or Zip14 KO mice in CD2F1 or Balb/c background at 4-5 weeks of age were subcutaneously injected with 1×10⁶ C26m2 or 4T1 tumor cells, respectively. Tumors were not resected with survival-surgeries in the Zip14 WT and KO mice due to the phenotypic and behavioral abnormalities in the Zip14 KO mice. Spontaneous metastasis was monitored by bioluminescent imaging in the Zip14 WT and Zip14 KO groups at endpoint (5 weeks post-tumor cell injection with C26m2 and 4T1 injections, respectively) and confirmed by histology upon harvest.
Neutralization assay of TNF-α and TGF-β in mice
Athymic nude mice and Balb/c mice of 8-9 weeks of age were subcutaneously injected44 with C26m2 and 4T1 cells, respectively. Mice were randomized for treatment group assignments. Tumors were surgically removed 2-3 weeks after tumor cell injection. One week after tumor removal, InVivoPlus anti-TGF-β (BP0057, Clone: 1D11.16.8), InVivoPlus anti-TNF-α (BP0058, Clone: XT3.11) or InVivoPlus Mouse IgG1 Isotype control (BP0083, Clone: MOPC-21) from BioXCell were intraperitoneally injected into mice with a dose of 200 μg/mouse three times a week for one week.
Tissue collection
After euthanasia, tibialis anterior, gastrocnemius, quadriceps, soleus, EDL, heart and diaphragm muscles, livers and lungs were collected for histology or snap frozen for molecular analysis. Metastatic tumors were collected in formalin for histological analysis and a part of the C26 metastases was used for derivation of cell lines for C26m2. For cell derivation, tumors were dissociated in 3 mg/ml of Collagenase I (Worthington Biochemical Corp.) and 2 U/ml of Dispase II (Roche) for 1 hour at 37°C with gentle rocking and then filtered through a 70μm mesh. Cells were briefly centrifuged, resuspended in culture medium and grown to confluence.
Generation of stable cell lines expressing luciferase
All cancer cell lines used in this study were stably infected with lentivirus expressing luciferase enzyme and hygromycin resistance marker. Briefly, cells were plated at 30% confluency (adherent cells) or at a density of 1×10⁵/ml (suspension cells). Lentivirus was produced using pLVX-Hygro vector expressing luciferase gene (a kind gift from Zvika Granot, Hebrew University of Jerusalem). Target cells were transduced with the viral supernatant for 3 hours. After 48 hours post-infection, stable cells integrated with the vector were selected by 100 μg/ml of hygromycin B (Invitrogen) for a week.
Bioluminescence and fluorescence by in-vivo Imaging
Tumor growth was measured by digital calipers and spontaneous metastasis was monitored by bioluminescent imaging using IVIS (Perkin Elmer). Briefly, mice were anesthetized with (3-4%) isoflurane and injected with 150 ng of D-Luciferin (Fisher Scientific) via intraperitoneal injections. Also, pigmented mice were shaved before imaging. The mice were then placed inside the PerkinElmer IVIS Spectrum Optical Imaging System, and scanned for one minute to measure bioluminescence or fluorescence for mCherry imaging.
Zinc-supplemented water treatment for mice
ZnSO4 solution was purchased from Sigma. Zip14 WT and KO mice were given either regular water or zinc-supplemented drinking water (25 mM ZnSO4 in drinking water as described70). Zinc water was started from the day of tumor injection in the tumor-bearing group and in matched uninjected controls, which continued until the animals were euthanized at 15 days. Tumors were not resected because cachectic symptoms started to develop early and were visible between 8-10 days in the tumor-bearing Zip14 WT group of mice on zinc-enriched water.
Behavioral Coordination tests in mice
Rotamex-5 (Columbus Instruments) with a rod diameter of 3cm, was used for testing coordination in mice. In this setup, automatic fall detection is implemented within each lane by a series of photocells placed above the rotating rod. The speed of the rotating rod is programmed for either constant or accelerated modes. Rod speed can be specified in either terms of rotations (RPM) or in linear terms (cm per second). Latency to fall is detected with 0.1 second temporal resolution. Rate of rotation at time of fall is resolved to 0.1 RPM or 0.1cm/second. Both latency and rod speed at time of fall are presented on a display for each of the four lanes. In brief, following manufacturer’s instructions, for each mouse, an average of 3 runs are recorded, with 5 minutes rest between each run. The speed the rod is spinning at when the mouse falls is measured in RPMs. The time it takes for the mouse to fall is measured in seconds. Mice are placed on the rod for 1 minute while the rod spins at 1 RPM so the mouse gets habituated to the rod spinning. When the experiment begins, the rod accelerates at 1 rpm every 10 seconds until the mouse falls off. When the mice fall off, the latency to fall (seconds) is measured.
Virus production, purification and titration
For adeno-associated virus production, we constructed two different AAV vectors, including AAV-CAG-Zip14-IRES-GFP and AAV-CAG-mCherry. pAAV-Ef1a-mCherry- IRES-Cre (Addgene plasmid #55632) was a gift from Karl Deisseroth, and was used as PCR template for cloning mCherry and IRES. AAV-CAG-ChR2-GFP (Addgene plasmid #26929) was a gift from Edward Boyden, and was used as template for cloning GFP. AAV-CAG-ChR2-GFP was also used as backbone AAV vector with CAG promoter after digesting by BamHI (Roche) and BsrGI (Thermo Fisher). By sequential PCR amplification, mCherry alone, Zip14-IRES-GFP amplicons, containing N-terminal BamHI and C-terminal BsrGI digestion sites, were introduced into digested AAV-CAG backbone to get the AAV vectors. The AAV constructs were confirmed by sequencing, and then co-transfected with pDeltaF6 and AAV 2/9 Helper plasmids, in a ratio of 1:2:1.6, into 293T cells by calcium phosphate. 48 hours later, 293T cells containing AAV were collected for virus purification.
Viruses were purified following the protocol as described before71. Briefly, AAV9-producing 293T cells were detached by adding 1/80 volume of 0.5 M EDTA (pH 8.0) for 10 mins incubation at room temperature and collected by centrifugation at 2,000×g for 10 mins at 4°C. Cell pellets were lysed by adding 24 ml of 0.5% Triton X-100 in PBS containing 5μg/ml of RNase A (Sigma) and shaking for 1 h at 37°C. Cell lysates were centrifuged at 10,000×g for 10 mins at 4°C, and 24 ml of supernatant was added into an ultracentrifuge tube. The virus solution was raised up by successive addition of 3 ml of 25% iodixanol, 4 ml of 40% iodixanol and 2 ml of 60% iodixanol to the bottom of the tube. All the iodixanol solutions were prepared in PBS containing 1M NaCl, 1 mM MgCl2, 2.5 mM KCl. The tube was centrifuged at 350,000×g for 1.5 hours at 18°C. 4.5 ml of virus solution at the bottom of tube was collected using 18G needle and filtered through 0.45 μm filter. Virus solution was then concentrated using Amicon Ultra-15 (100K) (Millipore) and washed 3 times with 250 mM NaCl solution. Virus titration was performed with primers targeting at CAG (forward 5’- TTA CGG TAA ACT GCC CAC TTG-3’, reverse 5’- CAT AAG GTC ATG TAC TGG GCA TAA-3’) with AAV-CAG-mCherry plasmid as standard.
AAV9 Injection
AAV9-mCherry-U6-mSLC39A14-shRNA or AAV9-mCherry-U6-scrmb-shRNA, both from Vector Biolabs, were used for knockdown of Zip14 expression or as negative control, respectively, by injecting directly into mouse gastrocnemius muscles. The validated shRNA sequence for knockdown of Zip14 is CCGG- GCAGGCTCTCTTCTTCAACTTCTCGCGAAGTTGAAGAAGAAGAGAGCCTGC-TTTTTG (Vector Biolabs). Zip14 knockdown efficiency was about 90% in Hepa1.6 cells (Vector Biolabs). For knockdown of Zip14 in mouse skeletal muscle, 3×10¹¹ genome copies of AAV9 virus were directly injected into the right gastrocnemius muscle using five injection sites in 7-8 weeks old athymic mice. mCherry expression was monitored weekly by fluorescence imaging, and after confirmation, tumor growth and metastasis assays were performed. Athymic mice were used to avoid additional immune reaction. For overexpression of Zip14, 2.2×10¹⁰ genome copies of AAV9 virus purified above were injected into the gastrocnemius muscle using five injection sites in 5-6 weeks aged Zip14 KO Balb/c mice.
Functional assays of grip strength
Grip strength was measured from mice injected with 4T1 or C26m2 cells or age-matched non-tumor bearing controls using a Digital Grip Strength Meter (Columbus Instruments). A minimum of five measurements was taken from each mouse for hind limb measurements. Grip strength was calculated as the average of the five measurements divided by body weight for each group.
Measurement of zinc metal ion in mouse muscles
Muscles were analyzed at the Diagnostic Center for Population & Animal Health at Michigan State University. Briefly, tissues were dried overnight in a 75°C oven and then digested overnight in approximately 10× the dry tissue mass of nitric acid. The digested samples were diluted with water to 100× the dried tissue mass. Elemental analysis was performed using an Agilent Inductively Coupled Plasma Mass Spectrometer (ICP/MS). Elemental concentrations were calibrated using a 4-point linear curve of the analyte-internal standard response ratio. Standards were from Inorganic Ventures.
Single myofiber isolation and LA-ICP-MS
Single myofiber isolation from EDL muscles was performed following the protocol described before72. Briefly, EDL muscles were dissected and transferred into a pre-warmed horse serum coated Petri dish containing 1.8 ml of DMEM supplemented with 10% FBS, 1× pen/strep antibiotics and 0.11 mg/ml of sodium pyruvate. Then 0.2 ml of 2% collagenase (about 40,000 U/ml) solution was added and muscles were digested at 37°C in a 5% CO2 incubator for 40 to 60 mins, during which a large bore glass pipette for flushing the muscle would help to loosen up the muscle and release single fibers into medium. The released muscle myofibers were transferred into a pre-warmed horse serum coated Petri dish with 4 ml of DMEM containing 10% FBS and 0.11 mg sodium pyruvate to avoid over-digestion. The myofibers were then transferred into pre-warmed, horse-serum coated Petri dish containing wash media (DMEM supplemented with 1× pen/strep and 0.11 mg/ml of sodium pyruvate), and washed for three times to remove dead myofibers and debris. Single myofibers were transferred onto glass slide and air-dried. For subsequent LA-ICP-MS analysis, single muscle fiber mounted on slide were placed in sealed ablation cell and ablated with a new wave UP213 Nd:YAG laser beam at 0.25-0.35 mJ with a 100 μm spot size. Ablation was set at 5μm/sec and 20 Hz. The ablated sample particles were then transferred to a Thermo iCapQ ICP-MS that was optimized using a NIST 612 glass standard prior to every sample run. The isotopes selected for analysis were 64Zn, 66Zn and 31P. Individual muscle fiber data was subtracted from a blank line on the same slide with same dimension, size and parameters as the sample line.
Liver and Kidney function analysis
Liver and kidney function tests were performed using automated clinical chemistry analyzer (VetAce ® Clinical Chemistry System; Alfa Wasserman Diagnostic LLC West Caldwell, New Jersey) for AST (Aspartate aminotransferase), BUN (Blood urea nitrogen) and Creatinine in serum following manufacturer’s instructions. Specifically, 20 μl, 3 μl and 20 μl of serum from mice bearing C26m2 metastases with or without zinc supplemented water treatment were used for assays of AST, BUN and Creatinine, respectively.
Muscle diameter analysis
Images of muscle sections stained with H&E or laminin were taken at 20× magnification. Fiber diameters were quantified as described before62 from a minimum of 500 fibers per five randomly chosen fields for each mouse using ImageJ software, at a minimum of 3 mice per group. For morphometric analysis, percentage of fiber number in each pre-defined group was categorized by fiber diameter from mice bearing 4T1 or C26m2 metastases and their respective controls.
Magnetic Sorting of Muscle Satellite Cells
CD45−CD31−Sca1−Integrin-α7+ skeletal muscle satellite cells were isolated according to the methods described in 34,73. Briefly, all limb skeletal muscles from 1-2 week old mice were combined and minced into a smooth pulp. The muscles were then digested with collagenase (2-5 ml of 0.2% collagenase type 2, based upon muscle mass, in DMEM with 10% FBS) at 37°C for 40 mins. The dissociated single cells were filtered through 70-micron strainer and pelleted by centrifugation at 400×g for 5 mins at 4°C. Cells were washed twice with DMEM containing 2% FBS and suspended in 200-500 μl of DMEM with 2% FBS. Fc blocker (1:100, BD Pharmingen, 553142) was added to the cell suspension and incubated on ice for 10 mins. The following antibodies were then added into the cell suspension: CD31-PE (1:100, eBioscience, 12-0311-81), CD45-PE (1:100, eBioscience, 12-0451-83), Sca1-PE (1:100, eBioscience, 12- 5981-81), integrin-α7 antibody (1:10, Miltenyi Biotec, 130-103-774), and gently rocked at 4°C for 15 mins. Cell pellet was washed twice with DMEM containing 2% FBS, and resuspended in DMEM with 2% FBS. 40-100 μl of anti-PE magnetic beads (Miltenyi Biotec, 130-105-639) was added into the cell suspension and gently rocked at 4°C for 15 mins. Cell pellet was washed twice with MACS buffer (PBS with 0.5% BSA and 2 mM EDTA), resuspended with 0.5 ml of MACS buffer, and applied onto a LD column that was set up on a magnetic board (Miltenyi Biotech). The flow-through cells were collected according to the manufacturer’s protocol, and pelleted by centrifugation. The cells were then resuspended with 80-200 μl of DMEM with 2% FBS, and 20-50 μl of anti-mouse IgG magnetic beads (Miltenyi Biotec, 130-048-402) was added into the cell suspension and gently rocked at 4°C for 15 mins, and the cell pellet was washed twice with MACS buffer. Cells were then resuspended with 0.5 ml of MACS buffer, and applied onto an LS column. After washing with MACS buffer, the cells retained in the LS column were collected according to the manufacturer’s protocol. Isolated muscle satellite cells were cultured in collagen-coated dishes with myoblast growth medium as described73.
Isolation of muscle progenitor cells by flow cytometry
Mouse gastrocnemius muscles were collected and processed for depletion of CD45+ and CD31+ cells by anti-PE magnetic beads using LD column (Miltenyi Biotech) as described under Magnetic Sorting of Muscle Satellite Cells. Cells in the flow-through fraction were pelleted by centrifugation and resuspended with 100 μl of DMEM containing 2% FBS. The following antibodies were then added into the cell suspension: CD34-FITC (1:50, Miltenyi Biotec, 130-105-831), Sca1-PE (1:100), and integrin-α7-APC (1:100, Miltenyi Biotec, 130-103-356), mixed and gently rocked at 4°C for 45 mins in the dark, and then washed twice with FACS buffer (0.5% BSA in PBS). The cells were resuspended in FACS buffer and used for flow cytometric analysis for isolation of CD34+Sca1+ and CD34+integrin-α7+ cells.
RNA extraction for RNA sequencing and qRT-PCR
Total RNA was extracted using Trizol® reagent (Thermo Fisher) as previously described74. RNA was further purified using RNeasy Mini kit including a DNase digest following the manufacturer’s instructions (Qiagen). RNA was quantified using Nanodrop (Thermo Scientific) and RNA-quality was assessed by capillary gel electrophoresis (Agilent 2100 Bioanalyzer; Agilent Technologies, Inc.). Single-end cDNA libraries were prepared for each sample and sequenced using the Illumina TruSeq RNA Sample Preparation Kit by following the manufacturer’s procedures and sequenced using the Illumina HiSeq 2000. Library construction and RNA sequencing were performed in the Columbia Genome Center at CUMC.
For qRT-RCR analysis, 100-500 ng of total RNA was used for cDNA synthesis using transcriptor first strand cDNA synthesis kit (Roche) following the manufacturer’s instructions. 10 ng of cDNA was used for qRT-RCR reactions using SYBR Green or TaqMan PCR master mix (Applied Biosystems) with gene-specific primers. qRT-PCR was run on Applied Biosystems 7500 fast real-time PCR system and analyzed by Applied Biosystems software. GAPDH or B2M was used as internal control when qRT-PCR was performed using SYBR Green or TaqMan PCR master mix, respectively; except for 18s was used as internal control in gene expression analysis of isolated muscle progenitor cells. The normalized fold change of gene expression level was analyzed using 2−∆∆Ct method75. SYBR Green real-time PCR primer sequences are listed in Supplementary table 7. TaqMan real-time PCR primers are: B2M (Hs99999907_m1) and CXCL1 (Hs00236937_m1) from Applied Biosystems.
Human Samples
Human tissues were obtained upon autopsy at New York Presbyterian/Columbia University Medical Center or from Rapid Autopsy Pancreas Program at the University of Nebraska with approved IRB protocols from both institutions. All research was conducted in compliance with ethical regulations. In particular, human psoas muscles fixed in 10% buffered formalin were collected from metastatic cancer patients at New York Presbyterian/Columbia University Medical Center upon autopsy, or from the Rapid Autopsy Pancreas Program at the University of Nebraska. To ensure minimal degradation of tissues, muscles collected at the Rapid Autopsy Program were harvested within two-three hours post mortem and the specimens were fixed in formalin immediately after collection. Presence of cancer and cachexia were based on autopsy report and additionally confirmed by histological analysis by two, independent pathologists at the University of Nebraska Medical Center and Columbia University Medical Center. Description of cancer type and presence of cachexia are listed in Supplementary Table 3.
Subcellular fractionation of differentiated C2C12 muscle cells
Fractionation of soluble and myofibrillar components was performed following the protocol described before76. In brief, differentiated C2C12 muscle cells were collected in cold lysis buffer (20 mM of Tris-HCl pH 7.2, 5 mM of EGTA, 100mM of KCl, 1%Triton X-100, and 1× protease and phosphatase inhibitor cocktail), and lysed by gentle agitation at 4°C for 1h. After centrifugation at 3,000×g for 30 mins at 4°C, the cytosolic fraction (supernatant) was collected and stored in -80°C. The pellet (myofibrils) was washed twice with wash buffer (20mM of Tris-HCl, pH 7.2, 100mM of KCl, and 1mM of DTT). After centrifugation at 3,000×g for 10 mins at 4°C, myofibrillar fraction was extracted in ice- cold extraction buffer (0.6 M of KCl, 1% Triton X-100, 2 mM of EDTA, 1 mM of DTT and 1× protease and phosphatase inhibitor cocktail) with shaking at 4°C. The purified myofibrillar fraction was collected after centrifugation for 3,000×g at 4°C and stored in -80°C until further use.
Immunofluorescence staining and immunoblotting
For immunofluorescence staining of cultured cells, cells were fixed with 2% formaldehyde for 30 mins, permeabilized with 0.5% NP-40 for 5 mins, and blocked with 10% goat serum in PBS containing 3% BSA for 30 mins. Cells were then incubated for 1 hour with primary antibody: rabbit polyclonal antibodies against mouse ZIP14 (1:500 developed in our laboratory), Desmin (1:500 Sigma, D8281), mouse monoclonal antibodies against fast MyHC (1:500 Sigma, clone MY-32) or tropomyosin (1:500 DSHB, CH1) followed by 30 mins incubation with Alexa Fluor 568-labeled secondary antibody (Thermo Fisher). Slides were then mounted using Fluoro-gel II with DAPI (Electron Microscopy Sciences). For immunofluorescence staining of mouse muscle tissues with ZIP14, cryosections of 5 μm thickness were air dried for 1 hour and fixed with 2% PFA in PBS for 10 mins at room temperature, and then washed twice with PBS containing 0.2% Tween-20. PFA neutralization was performed using 1% glycine in PBS for 15 mins, and sections were permeabilized for 15 mins using 1% Triton X-100 in PBS. The sections were treated with 1% H2O2 for 10 mins and sequentially blocked by Avidin/Biotin blocking kit and 3% BSA in PBS containing 10% goat serum, followed by 30 mins incubation of rabbit polyclonal antibody against mouse ZIP14 (1:1000) developed in our laboratory. Sections were then incubated with a biotinylated secondary antibody, and followed by 30 mins incubation with HRP-conjugated streptavidin (PerkinElmer). Signal amplification was performed using biotin-tyramide kit (TSA Biotin System, PerkinElmer) following manufacturer’s instructions. The sections were subsequently incubated with Alexa Fluor 647-conjugated streptavidin (Jackson Laboratories) for 30 mins, and then mounted using Fluoro-gel II with DAPI. For immunofluorescence staining of tissues with Laminin and CD31, the cryosections were air dried for approximately 10 mins and fixed with cold acetone for 10 mins, and then washed with PBS. Sections were blocked with 3% BSA in PBS containing 10% goat serum for 1 hour at room temperature, and then incubated with rabbit polyclonal antibody against Laminin (1:200) (Sigma, L9393) and/or rat monoclonal antibody against CD31 (BD, 557355) for 30 mins at room temperature. After washing with PBS, the sections were then incubated with Alexa Fluor 488 and/or 568 secondary antibody (Thermo Fisher) for 30 mins at room temperature and mounted with Fluoro-gel II with DAPI. For immunofluorescence staining of myosin isoforms in muscle, cryosections were blocked with 3% BSA in PBS containing 10% goat serum, followed by 30 mins incubation with primary monoclonal antibodies (1:1 of myosin heavy chain IIa (DSHB, SC-71) and myosin heavy chain IIb (DSHB, BF-F3), which are mouse IgG1 and IgM isotypes, respectively. After another 30 mins incubation with a mixture of secondary antibodies (1:500 of each goat anti-mouse IgG1 Alexa 488 and goat anti-mouse IgM Alexa 546, all from Thermo Fisher), the sections were washed and mounted using Fluoro-gel II with DAPI. For immunofluorescence staining of PAX7 and ZIP14 on muscle tissues from cancer patients, paraffin-embedded tissues were sectioned at 5 μm thickness, and the slides were de-paraffinized and rehydrated as described above. The muscle sections were blocked with 3% BSA in PBS containing 10% goat serum for 30 mins at room temperature, and then incubated with rabbit polyclonal antibody against human ZIP14 (1:500, developed in our laboratory) and mouse monoclonal antibody against PAX7 (1;200, IgG1 from DSHB) for 30 mins at room temperature. After washing with PBS, the sections were then incubated with goat anti-rabbit Alexa Fluor 568 and goat anti-mouse IgG1 Alexa Fluor 488 secondary antibodies (Thermo Fisher) for 30 mins at room temperature and mounted with Fluoro-gel II with DAPI.
For immunoblot analysis, cells or muscle tissues were lysed or homogenized in the indicated lysis buffers as described before44,76,77. High salt lysis buffer was used for greater solubility of myofibrillar proteins such as myosin41,77, which is composed of 300 mM of NaCl, 0.1 M of NaH22PO4, 0.05 M of Na2HPO4, 0.01 M of Na4P2O7, 1 mM of MgCl2, 10 mM of EDTA, 1 mM of DTT (pH 6.5), and low salt lysis buffer composed of 50 mM of Tris-HCl pH 7.5, 150 mM of NaCl, 0.5% of TritonX-100, 1 mM of EDTA was used for immunoblot analysis of other non-myofibrillar proteins. Both the high and low salt lysis buffers were supplemented with protease inhibitor and phosphatase inhibitor cocktail (Thermo Scientific). Protein concentration was determined by Pierce BCA protein assay kit (Thermo scientific), and proteins were resolved by SDS-PAGE and transferred onto Polyvinylidene difluoride membranes. After blocking with 5% w/v non-fat milk in TBS-T (20 mM of Tris-HCl pH 7.4, 500 mM of NaCl and 0.1% of Tween 20) for 1 hour at room temperature, the membranes were incubated with the following antibodies: rabbit polyclonal antibodies against ZIP14 (1:1000) (Millipore, 06-1022, NRG1830910), p-c-Jun (S63) (1:1000) (Cell signaling, #9261) and Cleaved-caspase 3 (1:1000) (Cell signaling, #9661); rabbit monoclonal antibodies against p-p65 (S536) (#3033), p65 (#8242), c-Jun (#9165), pSmad2 (S465/467) (#3108), Smad2 (#5339 purchased from Cell signaling with a dilution of 1:1000); mouse monoclonal antibodies against fast MyHC (1:5000) (Sigma, clone MY-32), skeletal actin (1:5000) (Sigma, A2172), tubulin (1:5000) (Sigma, T6074), troponin T (1:1000) (DSHB, JLT12), myosin light chain (1:1000) (DSHB, F310), and tropomyosin (1:1000) (DSHB, CH1). The membranes were then incubated with corresponding HRP-conjugated secondary antibodies, developed using ECL substrate (Bio-Rad) and visualized using Bio-Rad ChemiDoc™ Touch Imaging System.
Succinate dehydrogenase (SDH) staining of mouse muscles
Cryosections of mouse muscles were incubated with 1 mg/ml of nitrotetrazolium blue chloride and 100mM of sodium succinate in PBS at 37°C for 30 mins. Slides were washed three times with PBS and mounted with glycerol.
Computational analysis
From RNA sequencing data, reads were generated using RTA (Illumina) for base calling and bcl2fastq (version 1.8.4) was used for converting BCL to fastq format, coupled with adaptor trimming. Reads were mapped to a reference genome (Mouse: NCBIm37) using Tophat2 (version 2.0.11) with very-fast (-D 5 -R 1 -N 0 -L 22 -i S,0,2.50) option resulting in zero 0 (N) mismatches. Reads across junctions were checked and indicated in the supplied GFF (–no-novel-juncs). Bam files obtained from TopHat were used to generate the differential gene using the module Cuffdiff (Cufflinks 2.2.1) with default settings, sorted based on the FDR or q-val. The cutoff for the differential gene list was set as q-val less than 0.05. The expression values obtained using Cuffdiff were checked for data quality using the PCA module of R package CummeRbund 2.20.0. From the differential gene lists of RNA seq of muscles from C26m2 and 4T1 models, a new list was created with common genes from both the models. To prevent spurious results from infinity values, genes with low expression on one condition and/or zero expression on another were excluded from the initial analysis using C26m2 as the base model. Gene Set enrichment Analysis (GSEA) using the GSEAPreranked tool for RNA sequencing data was used for conducting the analysis, where fold change values was used as our criteria for ranking. Pre-ranked GSEA was performed on standalone GSEA (v2.2.2) using the C2_CP_KEGG gene-set, the HALLMARK_MYOGENESIS gene-sets78,79. Functional annotation clustering of the common genes was performed using DAVID (Database for Annotation, Visualization and Integrated Discovery) from https://david.ncifcrf.gov. Upregulated genes (log2 fold change greater than 1 with p and q- values <0.05) or downregulated genes (log2 fold less than -1 with p and q-values <0.05) were used for DAVID analysis. Clusters with an enrichment score ≥5.0 and significant p-value<0.05 were analyzed. IPA Upstream Regulator Analysis (Ingenuity, Qiagen) was performed using the RNA sequencing experimental dataset to identify upstream regulators and to predict whether they are activated or inhibited. IPA analysis was performed using the 1297 common genes between C26m2 and 4T1 with fold-change greater than 1.5 with significant p and q-value<0.05. For heat-map representation of qRT-PCR data, heatmaps were created using the gplots library in R for percentage value relative to control.
Statistical analysis
Statistical significance was determined by unpaired two-tailed Student’s t-test, two sided Welch’s t test, Pearson Chi-Square test or One-way ANOVA with post-hoc Tukey’s test using Prism 6 software (GraphPad Software). All values are mean ± SEM and P-value < 0.05 was considered statistically significant.
Specifically, for analysis using DAVID (Database for Annotation, Visualization and Integrated Discovery) from https://david.ncifcrf.gov, probability values (p-values) from one-tailed Fisher ‘s exact test were used as cutoff criteria. P-values were further corrected using the Benjamini-Hochberg (BH) procedure. For processing of RNA sequencing data using Cuffdiff, the p-value were obtained using Jensen-Shannon divergence statistics. For multiple testing correction q-values are obtained using Benjamini and Hochberg’s approach for controlling FDR. For Ingenuity pathway analysis (IPA) analysis, p-values from Fisher’s exact test were used and corrected using the Benjamini-Hochberg procedure. For gene-set enrichment analysis, a modified form of Kolmogorov-Smirnov (K-S) test was used for calculating Enrichment score. The nominal p-values generated were further corrected for FDR.
Life Sciences Reporting Summary
Further information on experimental design is available in the Life Sciences Reporting Summary.
Data availability and Accession Code availability statements
Supplementary information and source data files are available in the online version of the paper or can be obtained from corresponding author upon request. The uncropped immunoblot images used in the main figures are shown in Supplementary Fig. 6. The RNA-sequencing data was deposited in the Gene Expression Omnibus (GEO) with accession number GSE112204. De-identified patient information with relevant clinical annotation are available in the Supplementary Table, Life Sciences Reporting Summary. Additional de-identified data with clinical annotation are available upon reasonable request from the corresponding author.
Supplementary Material
Acknowledgments
We would like to thank Adolfo Ferrando (CUMC), Gerard Karsenty (CUMC), Julien Sage (Stanford University), Thordur Oskarsson (DKFZ), Denis Guttridge (Ohio State) and Ulf Klein (Leeds, UK) and members of the Acharyya laboratory for helpful insights throughout the study. We would like to thank Keith Macrenaris and Rebecca Sponenburg from Northwestern University Quantitative Bio-element Imaging Center (QBIC) supported by NASA Ames Research Center NNA06CB93G and Yaofang Zhang and Kevin Schey from Vanderbilt University Imaging Mass Spectrometry Center for invaluable help with single fiber mass spectrometry analyses. We would like to thank Leniza Munoz and Tamara Waddell from the Department of Pathology and Cell Biology at New York Presbyterian Hospital Center for muscle collection during autopsies. UNMC Rapid Autopsy Program was supported by NIH P50CA127297, U01CA210240, and 5R50CA211462 (to P.M.G. and M.A.H.). This work was supported by Institutional start-up funds from Columbia University Medical Center to S.A. and by Herbert Irving Comprehensive Cancer Center’s 5P30CA013696-43 Cancer Center Support Grant-Inter-Programmatic Pilot Project to S.A. Establishment of the congenic Balb/c Zip14-knockout mice was supported by DK080706 (to M.D.K.).Schematic models were generated in part using Servier Medical Art, licensed under a Creative Commons Attribution (CC BY) 3.0 License, with further modifications in some instances.
Footnotes
AUTHOR CONTRIBUTIONS
G.W., A.K.B., W.M., C.C. and S.A. designed and performed the experiments. G.W., A.K.B., W.M. and S.A. wrote the manuscript. P.M.G. and M.A.H. provided human muscle samples from the Rapid Autopsy Program (RAP)-Pancreas at the University of Nebraska Medical Center. R.J. assisted with antibody purification. K.T., A.B., and D.H. provided pathological characterization and oversaw muscle samples collection at CUMC. M.K. performed the bioinformatics analysis and was supervised by R.D. S.L-P provided biostatistics consultation. S.H., S.J., M.D.K., and T.F. provided the Zip14 knockout mice and reagents. A.K.B. and S.A. conceived the project. S.A. supervised all research. All authors read the manuscript and approved the study.
COMPETING FINANCIAL INTERESTS STATEMENT
All authors declare no competing financial interests.
References
- 1.Lambert AW, Pattabiraman DR, Weinberg RA. Emerging Biological Principles of Metastasis. Cell. 2017;168:670–691. doi: 10.1016/j.cell.2016.11.037. [DOI] [PMC free article] [PubMed] [Google Scholar]
- 2.Massague J, Obenauf AC. Metastatic colonization by circulating tumour cells. Nature. 2016;529:298–306. doi: 10.1038/nature17038. [DOI] [PMC free article] [PubMed] [Google Scholar]
- 3.Waning DL, et al. Excess TGF-beta mediates muscle weakness associated with bone metastases in mice. Nature medicine. 2015 doi: 10.1038/nm.3961. [DOI] [PMC free article] [PubMed] [Google Scholar]
- 4.Becker A, et al. Extracellular Vesicles in Cancer: Cell-to-Cell Mediators of Metastasis. Cancer cell. 2016;30:836–848. doi: 10.1016/j.ccell.2016.10.009. [DOI] [PMC free article] [PubMed] [Google Scholar]
- 5.McAllister SS, Weinberg RA. The tumour-induced systemic environment as a critical regulator of cancer progression and metastasis. Nature cell biology. 2014;16:717–727. doi: 10.1038/ncb3015. [DOI] [PMC free article] [PubMed] [Google Scholar]
- 6.Argiles JM, Busquets S, Stemmler B, Lopez-Soriano FJ. Cancer cachexia: understanding the molecular basis. Nature reviews. Cancer. 2014;14:754–762. doi: 10.1038/nrc3829. [DOI] [PubMed] [Google Scholar]
- 7.Fearon KC, Glass DJ, Guttridge DC. Cancer cachexia: mediators, signaling, and metabolic pathways. Cell metabolism. 2012;16:153–166. doi: 10.1016/j.cmet.2012.06.011. [DOI] [PubMed] [Google Scholar]
- 8.Fearon K, Arends J, Baracos V. Understanding the mechanisms and treatment options in cancer cachexia. Nature reviews. Clinical oncology. 2013;10:90–99. doi: 10.1038/nrclinonc.2012.209. [DOI] [PubMed] [Google Scholar]
- 9.Baracos VE, Martin L, Korc M, Guttridge DC, Fearon KCH. Cancer-associated cachexia. Nat Rev Dis Primers. 2018;4:17105. doi: 10.1038/nrdp.2017.105. [DOI] [PubMed] [Google Scholar]
- 10.Cohen S, Nathan JA, Goldberg AL. Muscle wasting in disease: molecular mechanisms and promising therapies. Nat Rev Drug Discov. 2015;14:58–74. doi: 10.1038/nrd4467. [DOI] [PubMed] [Google Scholar]
- 11.Sandri M. Protein breakdown in cancer cachexia. Seminars in cell & developmental biology. 2016;54:11–19. doi: 10.1016/j.semcdb.2015.11.002. [DOI] [PubMed] [Google Scholar]
- 12.Penna F, Busquets S, Argiles JM. Experimental cancer cachexia: Evolving strategies for getting closer to the human scenario. Seminars in cell & developmental biology. 2016;54:20–27. doi: 10.1016/j.semcdb.2015.09.002. [DOI] [PubMed] [Google Scholar]
- 13.Dewys WD, et al. Prognostic effect of weight loss prior to chemotherapy in cancer patients. Eastern Cooperative Oncology Group. The American journal of medicine. 1980;69:491–497. doi: 10.1016/s0149-2918(05)80001-3. [DOI] [PubMed] [Google Scholar]
- 14.Finney LA, O’Halloran TV. Transition metal speciation in the cell: insights from the chemistry of metal ion receptors. Science. 2003;300:931–936. doi: 10.1126/science.1085049. [DOI] [PubMed] [Google Scholar]
- 15.Lichten LA, Cousins RJ. Mammalian zinc transporters: nutritional and physiologic regulation. Annu Rev Nutr. 2009;29:153–176. doi: 10.1146/annurev-nutr-033009-083312. [DOI] [PubMed] [Google Scholar]
- 16.Larsson S, Karlberg I, Selin E, Daneryd P, Peterson HI. Trace element changes in serum and skeletal muscle compared to tumour tissue in sarcoma-bearing rats. In Vivo. 1987;1:131–140. [PubMed] [Google Scholar]
- 17.Siren PM, Siren MJ. Systemic zinc redistribution and dyshomeostasis in cancer cachexia. Journal of cachexia, sarcopenia and muscle. 2010;1:23–33. doi: 10.1007/s13539-010-0009-z. [DOI] [PMC free article] [PubMed] [Google Scholar]
- 18.Talmadge JE, Fidler IJ. Enhanced metastatic potential of tumor cells harvested from spontaneous metastases of heterogeneous murine tumors. Journal of the National Cancer Institute. 1982;69:975–980. [PubMed] [Google Scholar]
- 19.Francia G, Cruz-Munoz W, Man S, Xu P, Kerbel RS. Mouse models of advanced spontaneous metastasis for experimental therapeutics. Nature reviews. Cancer. 2011;11:135–141. doi: 10.1038/nrc3001. [DOI] [PMC free article] [PubMed] [Google Scholar]
- 20.Fearon KC. Cancer cachexia: developing multimodal therapy for a multidimensional problem. Eur J Cancer. 2008;44:1124–1132. doi: 10.1016/j.ejca.2008.02.033. [DOI] [PubMed] [Google Scholar]
- 21.Azoulay E, et al. The prognosis of acute respiratory failure in critically ill cancer patients. Medicine (Baltimore) 2004;83:360–370. doi: 10.1097/01.md.0000145370.63676.fb. [DOI] [PubMed] [Google Scholar]
- 22.Iguchi H, Onuma E, Sato K, Sato K, Ogata E. Involvement of parathyroid hormone-related protein in experimental cachexia induced by a human lung cancer-derived cell line established from a bone metastasis specimen. International journal of cancer. Journal international du cancer. 2001;94:24–27. doi: 10.1002/ijc.1425. [DOI] [PubMed] [Google Scholar]
- 23.Shum AM, et al. Cardiac and skeletal muscles show molecularly distinct responses to cancer cachexia. Physiol Genomics. 2015;47:588–599. doi: 10.1152/physiolgenomics.00128.2014. [DOI] [PubMed] [Google Scholar]
- 24.Bonetto A, et al. STAT3 activation in skeletal muscle links muscle wasting and the acute phase response in cancer cachexia. PloS one. 2011;6:e22538. doi: 10.1371/journal.pone.0022538. [DOI] [PMC free article] [PubMed] [Google Scholar]
- 25.Kwon MC, Berns A. Mouse models for lung cancer. Mol Oncol. 2013;7:165–177. doi: 10.1016/j.molonc.2013.02.010. [DOI] [PMC free article] [PubMed] [Google Scholar]
- 26.Nguyen DX, et al. WNT/TCF signaling through LEF1 and HOXB9 mediates lung adenocarcinoma metastasis. Cell. 2009;138:51–62. doi: 10.1016/j.cell.2009.04.030. [DOI] [PMC free article] [PubMed] [Google Scholar]
- 27.Xu C, et al. Loss of Lkb1 and Pten leads to lung squamous cell carcinoma with elevated PD-L1 expression. Cancer cell. 2014;25:590–604. doi: 10.1016/j.ccr.2014.03.033. [DOI] [PMC free article] [PubMed] [Google Scholar]
- 28.Balkwill F. TNF-alpha in promotion and progression of cancer. Cancer metastasis reviews. 2006;25:409–416. doi: 10.1007/s10555-006-9005-3. [DOI] [PubMed] [Google Scholar]
- 29.Esposito M, Guise T, Kang Y. The Biology of Bone Metastasis. Cold Spring Harb Perspect Med. 2017 doi: 10.1101/cshperspect.a031252. [DOI] [PMC free article] [PubMed] [Google Scholar]
- 30.Cai D, et al. IKKbeta/NF-kappaB activation causes severe muscle wasting in mice. Cell. 2004;119:285–298. doi: 10.1016/j.cell.2004.09.027. [DOI] [PubMed] [Google Scholar]
- 31.Guttridge DC, Mayo MW, Madrid LV, Wang CY, Baldwin AS., Jr NF-kappaB-induced loss of MyoD messenger RNA: possible role in muscle decay and cachexia. Science. 2000;289:2363–2366. doi: 10.1126/science.289.5488.2363. [DOI] [PubMed] [Google Scholar]
- 32.Hojyo S, et al. The zinc transporter SLC39A14/ZIP14 controls G-protein coupled receptor-mediated signaling required for systemic growth. PloS one. 2011;6:e18059. doi: 10.1371/journal.pone.0018059. [DOI] [PMC free article] [PubMed] [Google Scholar]
- 33.Liuzzi JP, et al. Interleukin-6 regulates the zinc transporter Zip14 in liver and contributes to the hypozincemia of the acute-phase response. Proceedings of the National Academy of Sciences of the United States of America. 2005;102:6843–6848. doi: 10.1073/pnas.0502257102. [DOI] [PMC free article] [PubMed] [Google Scholar]
- 34.He WA, et al. NF-kappaB-mediated Pax7 dysregulation in the muscle microenvironment promotes cancer cachexia. The Journal of clinical investigation. 2013;123:4821–4835. doi: 10.1172/JCI68523. [DOI] [PMC free article] [PubMed] [Google Scholar]
- 35.Sabourin LA, Rudnicki MA. The molecular regulation of myogenesis. Clin Genet. 2000;57:16–25. doi: 10.1034/j.1399-0004.2000.570103.x. [DOI] [PubMed] [Google Scholar]
- 36.Penna F, et al. Muscle wasting and impaired myogenesis in tumor bearing mice are prevented by ERK inhibition. PloS one. 2010;5:e13604. doi: 10.1371/journal.pone.0013604. [DOI] [PMC free article] [PubMed] [Google Scholar]
- 37.Liu N, et al. Requirement of MEF2A, C, and D for skeletal muscle regeneration. Proceedings of the National Academy of Sciences of the United States of America. 2014;111:4109–4114. doi: 10.1073/pnas.1401732111. [DOI] [PMC free article] [PubMed] [Google Scholar]
- 38.Skapek SX, Rhee J, Spicer DB, Lassar AB. Inhibition of myogenic differentiation in proliferating myoblasts by cyclin D1-dependent kinase. Science. 1995;267:1022–1024. doi: 10.1126/science.7863328. [DOI] [PubMed] [Google Scholar]
- 39.Wei Q, Paterson BM. Regulation of MyoD function in the dividing myoblast. FEBS Lett. 2001;490:171–178. doi: 10.1016/s0014-5793(01)02120-2. [DOI] [PubMed] [Google Scholar]
- 40.Glass DJ. Signaling pathways perturbing muscle mass. Current opinion in clinical nutrition and metabolic care. 2010;13:225–229. doi: 10.1097/mco.0b013e32833862df. [DOI] [PubMed] [Google Scholar]
- 41.Roberts BM, et al. Diaphragm and ventilatory dysfunction during cancer cachexia. FASEB journal : official publication of the Federation of American Societies for Experimental Biology. 2013;27:2600–2610. doi: 10.1096/fj.12-222844. [DOI] [PMC free article] [PubMed] [Google Scholar]
- 42.Cohen S, et al. During muscle atrophy, thick, but not thin, filament components are degraded by MuRF1-dependent ubiquitylation. The Journal of cell biology. 2009;185:1083–1095. doi: 10.1083/jcb.200901052. [DOI] [PMC free article] [PubMed] [Google Scholar]
- 43.Clarke BA, et al. The E3 Ligase MuRF1 degrades myosin heavy chain protein in dexamethasone-treated skeletal muscle. Cell metabolism. 2007;6:376–385. doi: 10.1016/j.cmet.2007.09.009. [DOI] [PubMed] [Google Scholar]
- 44.Acharyya S, et al. Cancer cachexia is regulated by selective targeting of skeletal muscle gene products. The Journal of clinical investigation. 2004;114:370–378. doi: 10.1172/JCI20174. [DOI] [PMC free article] [PubMed] [Google Scholar]
- 45.Gupta SK, Shukla VK, Vaidya MP, Roy SK, Gupta S. Serum and tissue trace elements in colorectal cancer. J Surg Oncol. 1993;52:172–175. doi: 10.1002/jso.2930520311. [DOI] [PubMed] [Google Scholar]
- 46.Russell ST, Siren PM, Siren MJ, Tisdale MJ. The role of zinc in the anti-tumour and anti-cachectic activity of D-myo-inositol 1,2,6-triphosphate. British journal of cancer. 2010;102:833–836. doi: 10.1038/sj.bjc.6605562. [DOI] [PMC free article] [PubMed] [Google Scholar]
- 47.Cousins RJ, Leinart AS. Tissue-specific regulation of zinc metabolism and metallothionein genes by interleukin 1. FASEB journal : official publication of the Federation of American Societies for Experimental Biology. 1988;2:2884–2890. doi: 10.1096/fasebj.2.13.2458983. [DOI] [PubMed] [Google Scholar]
- 48.Summermatter S, et al. Blockade of Metallothioneins 1 and 2 Increases Skeletal Muscle Mass and Strength. Molecular and cellular biology. 2017;37 doi: 10.1128/MCB.00305-16. [DOI] [PMC free article] [PubMed] [Google Scholar]
- 49.Crawford AJ, Bhattacharya SK. Excessive intracellular zinc accumulation in cardiac and skeletal muscles of dystrophic hamsters. Exp Neurol. 1987;95:265–276. doi: 10.1016/0014-4886(87)90137-3. [DOI] [PubMed] [Google Scholar]
- 50.Lecker SH, et al. Multiple types of skeletal muscle atrophy involve a common program of changes in gene expression. FASEB journal : official publication of the Federation of American Societies for Experimental Biology. 2004;18:39–51. doi: 10.1096/fj.03-0610com. [DOI] [PubMed] [Google Scholar]
- 51.Kang Y, et al. Breast cancer bone metastasis mediated by the Smad tumor suppressor pathway. Proceedings of the National Academy of Sciences of the United States of America. 2005;102:13909–13914. doi: 10.1073/pnas.0506517102. [DOI] [PMC free article] [PubMed] [Google Scholar]
- 52.Jenkitkasemwong S, Wang CY, Mackenzie B, Knutson MD. Physiologic implications of metal-ion transport by ZIP14 and ZIP8. Biometals : an international journal on the role of metal ions in biology, biochemistry, and medicine. 2012;25:643–655. doi: 10.1007/s10534-012-9526-x. [DOI] [PMC free article] [PubMed] [Google Scholar]
- 53.Schiaffino S, Dyar KA, Ciciliot S, Blaauw B, Sandri M. Mechanisms regulating skeletal muscle growth and atrophy. FEBS J. 2013;280:4294–4314. doi: 10.1111/febs.12253. [DOI] [PubMed] [Google Scholar]
- 54.Eley HL, Skipworth RJ, Deans DA, Fearon KC, Tisdale MJ. Increased expression of phosphorylated forms of RNA-dependent protein kinase and eukaryotic initiation factor 2alpha may signal skeletal muscle atrophy in weight-losing cancer patients. British journal of cancer. 2008;98:443–449. doi: 10.1038/sj.bjc.6604150. [DOI] [PMC free article] [PubMed] [Google Scholar]
- 55.Schmitt TL, et al. Activity of the Akt-dependent anabolic and catabolic pathways in muscle and liver samples in cancer-related cachexia. J Mol Med (Berl) 2007;85:647–654. doi: 10.1007/s00109-007-0177-2. [DOI] [PubMed] [Google Scholar]
- 56.Yamasaki S, et al. Zinc is a novel intracellular second messenger. The Journal of cell biology. 2007;177:637–645. doi: 10.1083/jcb.200702081. [DOI] [PMC free article] [PubMed] [Google Scholar]
- 57.Andreini C, Bertini I, Rosato A. Metalloproteomes: a bioinformatic approach. Acc Chem Res. 2009;42:1471–1479. doi: 10.1021/ar900015x. [DOI] [PubMed] [Google Scholar]
- 58.Dumont NA, Wang YX, Rudnicki MA. Intrinsic and extrinsic mechanisms regulating satellite cell function. Development. 2015;142:1572–1581. doi: 10.1242/dev.114223. [DOI] [PMC free article] [PubMed] [Google Scholar]
- 59.Talbert EE, Guttridge DC. Impaired regeneration: A role for the muscle microenvironment in cancer cachexia. Seminars in cell & developmental biology. 2016;54:82–91. doi: 10.1016/j.semcdb.2015.09.009. [DOI] [PMC free article] [PubMed] [Google Scholar]
- 60.Wallace GQ, McNally EM. Mechanisms of muscle degeneration, regeneration, and repair in the muscular dystrophies. Annu Rev Physiol. 2009;71:37–57. doi: 10.1146/annurev.physiol.010908.163216. [DOI] [PubMed] [Google Scholar]
- 61.Jahchan NS, et al. A drug repositioning approach identifies tricyclic antidepressants as inhibitors of small cell lung cancer and other neuroendocrine tumors. Cancer discovery. 2013;3:1364–1377. doi: 10.1158/2159-8290.CD-13-0183. [DOI] [PMC free article] [PubMed] [Google Scholar]
- 62.Acharyya S, et al. Dystrophin glycoprotein complex dysfunction: a regulatory link between muscular dystrophy and cancer cachexia. Cancer cell. 2005;8:421–432. doi: 10.1016/j.ccr.2005.10.004. [DOI] [PubMed] [Google Scholar]
- 63.Blanco MA, et al. Global secretome analysis identifies novel mediators of bone metastasis. Cell research. 2012;22:1339–1355. doi: 10.1038/cr.2012.89. [DOI] [PMC free article] [PubMed] [Google Scholar]
- 64.Polge C, et al. Muscle actin is polyubiquitinylated in vitro and in vivo and targeted for breakdown by the E3 ligase MuRF1. FASEB journal : official publication of the Federation of American Societies for Experimental Biology. 2011;25:3790–3802. doi: 10.1096/fj.11-180968. [DOI] [PubMed] [Google Scholar]
- 65.Gee KR, Zhou ZL, Qian WJ, Kennedy R. Detection and imaging of zinc secretion from pancreatic beta-cells using a new fluorescent zinc indicator. Journal of the American Chemical Society. 2002;124:776–778. doi: 10.1021/ja011774y. [DOI] [PubMed] [Google Scholar]
- 66.Dalal BI, Keown PA, Greenberg AH. Immunocytochemical localization of secreted transforming growth factor-beta 1 to the advancing edges of primary tumors and to lymph node metastases of human mammary carcinoma. The American journal of pathology. 1993;143:381–389. [PMC free article] [PubMed] [Google Scholar]
- 67.Jenkitkasemwong S, et al. SLC39A14 Is Required for the Development of Hepatocellular Iron Overload in Murine Models of Hereditary Hemochromatosis. Cell metabolism. 2015;22:138–150. doi: 10.1016/j.cmet.2015.05.002. [DOI] [PMC free article] [PubMed] [Google Scholar]
- 68.Burkholder T, Foltz C, Karlsson E, Linton CG, Smith JM. Health Evaluation of Experimental Laboratory Mice. Curr Protoc Mouse Biol. 2012;2:145–165. doi: 10.1002/9780470942390.mo110217. [DOI] [PMC free article] [PubMed] [Google Scholar]
- 69.DuPage M, Dooley AL, Jacks T. Conditional mouse lung cancer models using adenoviral or lentiviral delivery of Cre recombinase. Nat Protoc. 2009;4:1064–1072. doi: 10.1038/nprot.2009.95. [DOI] [PMC free article] [PubMed] [Google Scholar]
- 70.Ohly P, Dohle C, Abel J, Seissler J, Gleichmann H. Zinc sulphate induces metallothionein in pancreatic islets of mice and protects against diabetes induced by multiple low doses of streptozotocin. Diabetologia. 2000;43:1020–1030. doi: 10.1007/s001250050009. [DOI] [PubMed] [Google Scholar]
- 71.Buclez PO, et al. Rapid, scalable, and low-cost purification of recombinant adeno-associated virus produced by baculovirus expression vector system. Molecular therapy. Methods & clinical development. 2016;3:16035. doi: 10.1038/mtm.2016.35. [DOI] [PMC free article] [PubMed] [Google Scholar]
- 72.Vogler TO, Gadek KE, Cadwallader AB, Elston TL, Olwin BB. Isolation, Culture, Functional Assays, and Immunofluorescence of Myofiber-Associated Satellite Cells. Methods in molecular biology. 2016;1460:141–162. doi: 10.1007/978-1-4939-3810-0_11. [DOI] [PubMed] [Google Scholar]
- 73.Motohashi N, Asakura Y, Asakura A. Isolation, culture, and transplantation of muscle satellite cells. J Vis Exp. 2014 doi: 10.3791/50846. [DOI] [PMC free article] [PubMed] [Google Scholar]
- 74.Acharyya S, et al. A CXCL1 paracrine network links cancer chemoresistance and metastasis. Cell. 2012;150:165–178. doi: 10.1016/j.cell.2012.04.042. [DOI] [PMC free article] [PubMed] [Google Scholar]
- 75.Livak KJ, Schmittgen TD. Analysis of relative gene expression data using real-time quantitative PCR and the 2(-Delta Delta C(T)) Method. Methods. 2001;25:402–408. doi: 10.1006/meth.2001.1262. [DOI] [PubMed] [Google Scholar]
- 76.Volodin A, Kosti I, Goldberg AL, Cohen S. Myofibril breakdown during atrophy is a delayed response requiring the transcription factor PAX4 and desmin depolymerization. Proceedings of the National Academy of Sciences of the United States of America. 2017;114:E1375–E1384. doi: 10.1073/pnas.1612988114. [DOI] [PMC free article] [PubMed] [Google Scholar]
- 77.Cosper PF, Leinwand LA. Cancer causes cardiac atrophy and autophagy in a sexually dimorphic manner. Cancer research. 2011;71:1710–1720. doi: 10.1158/0008-5472.CAN-10-3145. [DOI] [PMC free article] [PubMed] [Google Scholar]
- 78.Liberzon A, et al. The Molecular Signatures Database (MSigDB) hallmark gene set collection. Cell Syst. 2015;1:417–425. doi: 10.1016/j.cels.2015.12.004. [DOI] [PMC free article] [PubMed] [Google Scholar]
- 79.Subramanian A, et al. Gene set enrichment analysis: a knowledge-based approach for interpreting genome-wide expression profiles. Proceedings of the National Academy of Sciences of the United States of America. 2005;102:15545–15550. doi: 10.1073/pnas.0506580102. [DOI] [PMC free article] [PubMed] [Google Scholar]
Associated Data
This section collects any data citations, data availability statements, or supplementary materials included in this article.
Supplementary Materials
Data Availability Statement
Supplementary information and source data files are available in the online version of the paper or can be obtained from corresponding author upon request. The uncropped immunoblot images used in the main figures are shown in Supplementary Fig. 6. The RNA-sequencing data was deposited in the Gene Expression Omnibus (GEO) with accession number GSE112204. De-identified patient information with relevant clinical annotation are available in the Supplementary Table, Life Sciences Reporting Summary. Additional de-identified data with clinical annotation are available upon reasonable request from the corresponding author.