

Summary
Heritability is essential for understanding the biological causes of disease but requires laborious patient recruitment and phenotype ascertainment. Electronic health records (EHR) passively capture a wide range of clinically relevant data and provide a resource for studying the heritability of traits that are not typically accessible. EHRs contain next-of-kin information collected via patient emergency contact forms, but until now, these data have gone unused in research. We mined emergency contact data at three academic medical centers and identified 7.4 million familial relationships while maintaining patient privacy. Identified relationships were consistent with genetically-derived relatedness. We used EHR data to compute heritability estimates for 500 disease phenotypes. Overall, estimates were consistent with the literature and between sites. Inconsistencies were indicative of limitations and opportunities unique to EHR research. These analyses provide a validation of the use of EHRs for genetics and disease research.
Keywords: disease heritability, genetics, electronic health record, observational databases, familial relationships, family history, data mining
Graphical abstract
Introduction
Family history is one of the most important disease risk factors necessary for the implementation of precision medicine in the clinical setting (Aronson and Rehm, 2015; Guttmacher et al., 2004). The predictive value of family history for any given trait is directly related to the fraction of phenotypic variance attributable to genetic factors, called heritability (Tenesa and Haley, 2013; Visscher et al., 2008), as well as to shared environmental factors. Knowledge of disease heritability combined with family history information is clinically useful for identifying risk factors, estimating disease risk, customizing treatment, and tailoring patient care (Chatterjee et al., 2016). Moreover, by quantifying the genetic contribution to a trait, heritability estimation represents the first step in gene mapping efforts for any disease.
Estimating heritability has traditionally required in-depth family studies, with twin studies being the most commonly used method. By their nature these studies can be laborious, limiting their sample sizes and, subsequently, their power. A notable exception, and perhaps the largest single study, used 80,309 monozygotic and 123,382 same-sex dizygotic twins to conclude that there is a significant familial risk for prostate, melanoma, breast, ovary, and uterine cancers (Mucci et al., 2016). Another study brought together 2,748 twin studies conducted since 1955 covering 14.5 million subjects. However, individual data are not available in such a meta-analysis, preventing any study of cross-sections, combinations of traits, or strata that were not analyzed in the original study (Polderman et al., 2015).
Electronic Health Records (EHR) are in broad use and offer an alternative to traditional phenotyping. Every day, the EHR records information for thousands of patients from drug prescriptions and disease diagnosis to clinical pathology results and physician notes. Use of EHR data presents an opportunity to conduct rapid and expansive studies of disease and phenotype heritability. In particular, EHR data enables access to traits that otherwise might not be explored. In addition, data captured by these systems represent the diversity of the patient populations they serve, and, in ethnically diverse regions like New York City, make previously unattainable cohorts available for study (Hripcsak et al., 2016). The caveat is that these data are known to contain issues regarding missingness and accuracy which limits their use (Hripcsak and Albers, 2013; Weiskopf and Weng, 2013). The most critical limitation for genetic studies may be the uncontrolled ascertainment bias (Kaplan et al., 2014). The probability that a particular trait is recorded in the EHR is not uniform across disease conditions or patients. For example, a patient seen for a routine checkup with no symptoms is unlikely to undergo an MRI, regardless of whether or not they have an unruptured brain aneurysm (Bederson et al., 2000). However, a patient that lives nearby may receive much of their care at the hospital and have fairly complete records. A recent study used the first release of the UK Biobank data to estimate hundreds of heritabilities from 130,000 patients’ genotype and EHR data; however, they did not address the issues of ascertainment biases (Ge et al., 2017).
The genetic relatedness between patients is not routinely captured in the EHR during clinical practice. In some hospitals, as is the case for two out of three we represent, a link is made between the mother’s and child’s medical records upon birth. In general, however, familial links are not present. Recent work has identified twins by comparing birth dates and surnames (Mayer et al., 2014), but there is a more comprehensive source of familial relationship data that is available at nearly every hospital across the country – the emergency contact information. Upon admission, each patient is asked to provide contact details to be used in case of emergency as well as the relationship to the individual provided. If accurate, this ubiquitous resource can be used to define a broad network of relatedness across a hospital’s patient population.
In this study, we demonstrate the utility of the EHR as a resource for genetics research, even in the absence of genetic patient data, by using extracted familial data to estimate the heritability of 500 phenotypes, both quantitative and dichotomous. We performed this analysis independently at three large academic medical centers in New York City. We present our algorithm for extracting relationships, called Relationship Inference From The Electronic Health Record (RIFTEHR), and use it to infer 7.4 million familial relationships among our patients. We then compute heritability estimates for every available phenotype. Our derived heritability estimates are consistent with those previously reported, concordant across sites, and we present significant heritability estimates for many traits that may otherwise never have been studied.
Results
Mining familial relationships from the EHR
We obtained the data for this study from the inpatient EHR used at the hospitals of Columbia University Medical Center, Weill Cornell Medical Center, and Mount Sinai Health System. Columbia University Medical Center and Weill Cornell Medical Center operate together as NewYork-Presbyterian Hospital and herein, we will refer to the hospitals and the data associated with them as Columbia, Weill Cornell and Mount Sinai, respectively. The study was approved by Institutional Review Boards independently at each site.
In total, 3,550,598 patients provided 6,587,594 emergency contacts at the three medical centers. Of these, we identified the emergency contact as a patient in 2,191,695 cases (825,880 at Columbia, 573,804 at Weill Cornell, and 792,011 at Mount Sinai). Of those, 1,902,827 provided 1,588,134 family members as emergency contact (488,932 at Columbia, 297,011 at Weill Cornell, and 802,191 at Mount Sinai; Table 1). Using these next-of-kin data, we inferred an additional 2,755,448 relationships at Columbia, 1,237,749 at Weill Cornell and 1,819,581 at Mount Sinai (Figure 1). Including inferences, we identified a total of 3,244,380 unique relationships at Columbia, 1,534,760 at Weill Cornell, and 2,621,772 at Mount Sinai. Inferred relationships include first to fourth-degree relatives as well as spouses and in-laws (Table 1, Table S1). We grouped individuals into families by identifying disconnected subgraphs (Materials and Methods). We found 223,307 families at Columbia containing 2 to 134 members per family. Similarly, we found 155,883 families at Weill Cornell, with up to 129 members per family and 187,473 families at Mount Sinai, with up to 57 family members. These include 4,271 families with fourth-degree relatives (i.e., families that contain first cousin once removed, great-grandaunt/great-granduncle or great-grandnephew/great-grandniece) at Columbia, 1,045 families at Weill Cornell, and 992 families at Mount Sinai.
Table 1.
Demographic data of the electronic health records at Columbia University Medical Center, Weill Cornell Medical Center, and Mount Sinai Health System.
| Variable | Columbia | Weill Cornell | Mount Sinai |
|---|---|---|---|
| N | 682,267 | 437,375 | 783,185 |
| Relationships | 3,244,380 | 1,534,760 | 2,621,772 |
| N provided relationships | 488,932 | 297,011 | 802,191 |
| N inferred relationships | 2,755,448 | 1,237,749 | 1,819,581 |
| Families | 223,307 | 155,811 | 187,473 |
| Gender, Female | 418,657 (61.36%) | 261,482 (59.78%) | 449,878 (57.45%) |
| Age | 40.15 (24.81) | 39.85 (25.02) | 51.44 (23.20) |
| Race/Ethnicity | |||
| Black or African American | 69,506 (10.19%) | 30,975 (7.08%) | 79,854 (10.20%) |
| White | 123,800 (18.15%) | 110,485 (25.26%) | 285,559 (36.46%) |
| Hispanic or Latino | 373,552 (54.75%) | 52,087 (11.91%) | 151,785 (19.38%) |
| Other | 11,438 (1.68%) | 26,687 (6.10%) | 25,864 (3.30%) |
| Unknown/Declined to answer | 103,971 (15.24%) | 217,141 (49.65%) | 240,123 (30.66%) |
| Degree of relationship | |||
| First (i.e. child, parent) | 1,388,858 | 814,650 | 798,440 |
| Second (e.g. grandchild) | 605,922 | 225,796 | 243,434 |
| Third (e.g. great-grandparent) | 432,262 | 137,712 | 136,936 |
| Fourth (e.g. great-great-grandchild) | 215,300 | 61,986 | 58,500 |
| Other | |||
| None (e.g. spouse, in-laws) | 172,158 | 127,748 | 571,250 |
| Unknown (e.g. parent/parent-in-law) | 429,880 | 166,868 | 813,212 |
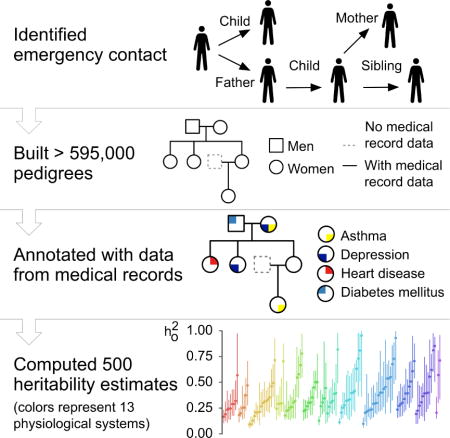
Fig. 1. Inference of familial relationships and estimation of heritability from the electronic health records.
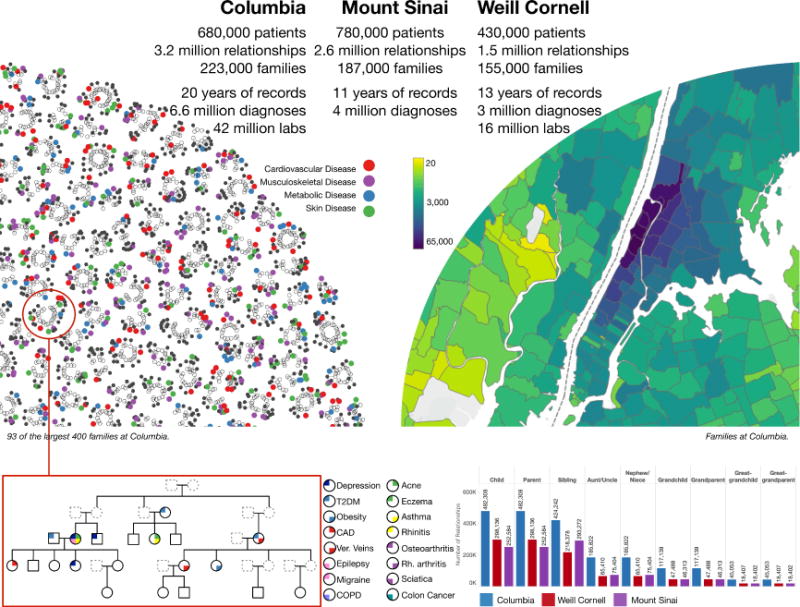
At Columbia, 680,000 reported next-of-kin data were identified in the institutional EHR. Similarly, 430,000 and 780,000 were identified at Weill Cornell and Mount Sinai, respectively. From these initial relationships, we were able to infer additional relationships resulting in 3.2 million patient relationships at Columbia, 1.5 million relationships at Weill Cornell, and 2.6 million relationships at Mount Sinai. A family was identified as a group of patients with no relationships outside of the group. In total, we identified 223,000 families at Columbia, 155,000 families at Weill Cornell, and 187,000 at Mount Sinai. The largest 400 families from Columbia were visualized as a graph using a force layout (Materials and Methods). Each disconnected subgraph is a family. Each node is an individual. Solid nodes represent patients in our respective EHRs. Colored nodes indicate the presence of a disease diagnosis in one of four classes: cardiovascular disease (red), musculoskeletal disease (purple), metabolic disease (blue), and skin disease (green). The top left shows 93 of the top families at Columbia. The largest family shown contains 23 individuals and the smallest, 12. We constructed detailed pedigrees for one family from Columbia (bottom left). The pedigree shown was modified for de-identification purposes. Each node is an individual. Individuals indicated by dashed lines are inferred to exist but did not exist in the EHR. The top right shows a map of the number of individuals from Columbia for whom relationships were identified. The colors represent the number of individuals that live in each ZIP code. The bottom right shows a bar graph shows the number of individuals by relationship type for each institution. We used all disease diagnosis data and clinical pathology report data (laboratory tests) available for patients in our cohort to study genetic heritability. At Columbia, 6.6 million disease diagnoses were used to estimate heritability of dichotomous traits and 42 million laboratory tests were used to estimate heritability of quantitative traits. At Weill Cornell, 3 million disease diagnoses were used and 16 million laboratory tests and at Mount Sinai, 4 million disease diagnosis.
The relationship between mother and child was explicitly documented in the EHR for newborns delivered at Columbia and Weill Cornell. This ‘EHR mother-baby linkage’ provided a reference standard for maternal relationships, allowing us to compute sensitivity and positive predictive value (PPV) of the relationship inference method. For maternal relationships, we obtained 92.9% sensitivity with 95.7% PPV at Columbia and 96.8% sensitivity with 98.3% PPV at Weill Cornell. Similarly, for siblings, we obtained 92.2% sensitivity with 98.3% PPV at Columbia and 96.5% sensitivity with 99.6% PPV at Weill Cornell (Figure 2A). Tables S4 and S5 present the stratified performance of the identified relationships by the number of variables used to match the emergency contact to a patient in a healthcare system, and by the combination of variables (e.g., last name only, first name and last name, etc.) used to perform the match, respectively.
Fig. 2. Validation of familial relationships inferred from the EHR.
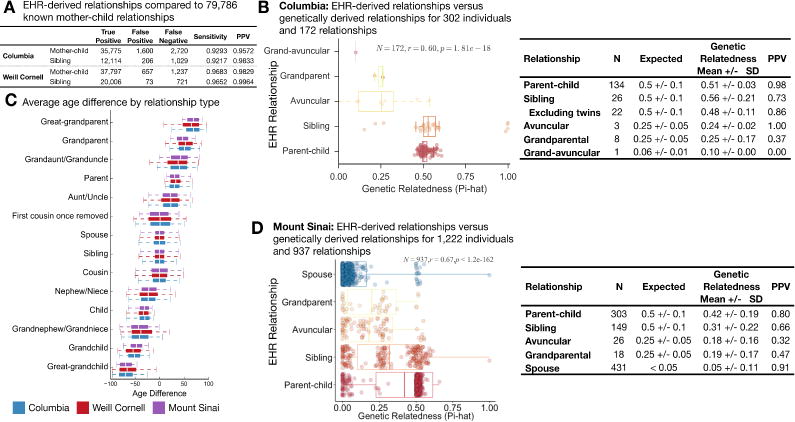
(A) The medical centers at both Columbia and Weill Cornell have implemented a link between the electronic health records of mother and baby at the time of birth. We used these links as a gold standard to evaluate RIFTEHR, our algorithm for automatically inferring relationships from the EHR. We also inferred siblings using the mother-baby link data. (B) Through biobanks at Columbia, 302 of the patients with identified relationships from RIFTEHR also had genetic data available and appropriately consented for use in our study. For these, RIFTEHR predicted a total of 172 relationships. Genetic relatedness was determined for each pair of individuals. Almost all 134 parent/child relationships had the expected genetic relatedness of 50% (51%±3%). Of the siblings predicted by RIFTEHR 19 were full siblings, 3 were half siblings (genetic relatedness of 25%), and 4 were identical twins. The high rate of twins in our small sample is a result of the secondary use of existing data – which was originally collected for genetic studies. Excluding these twins yields a more accurate estimate of RIFTEHR’s performance (PPV=86.4%). Overall the RIFTEHR relationship and the genetic relationship were significantly correlated (r=0.60, p=1.81e-18). (C) Average age differences for each relationship type. We computed the age differences for each pair of individuals at Columbia (blue), Weill Cornell (red) and Mount Sinai (purple). The age differences are consistent across sites. (D) At Mount Sinai, we identified 1,222 patients that had familial relationships from RIFTEHR and also had genetic data available with appropriate consent for use in our study. Among these, RIFTEHR inferred 937 relationships. Genetic relatedness was determined for each individual pair and compared to the relationships inferred by RIFTEHR. RIFTEHR’s performance varied from 32% to 91% PPV, being more accurate in identifying members of the nuclear family. Overall the RIFTEHR relationship and the genetic relationship were significantly correlated (r=0.67, p<1.2e-162).
We validated the identified relationships by comparison to genetically-derived relatedness (Figure 2). We collected data for 1,222 patients from Mount Sinai and 302 patients from Columbia for whom we have EHR-inferred relationships and available genetic data that were consented for reuse. We included spousal relationships as a negative control using a heuristic definition of being genetically unrelated (IBS < 0.1). We estimated relatedness using PLINK (Purcell et al., 2007). At Columbia, almost all 134-predicted parent-offspring relationships had the expected genetic relatedness of 50%, and the three grandparental relationships had the expected relatedness of 25%. All 26 sibling relationships were genetically related, but four were identical twins, and three were half-siblings (Figure 2B). At Mount Sinai, the positive predictive value (PPV) to predict spousal relationships was 91%, 80% for parent-offspring, 66% for sibling, and 47% for grandparental and 32% for avuncular relationships (Figure 2D). Overall, relationships extracted from the EHR significantly correlate with the expected genetic relatedness (r=0.60, p=1.81e-18 at Columbia and r=0.67, p<1.2e-162at Mount Sinai).
Health records-based estimates of heritability
To differentiate heritability estimates derived under uncertain ascertainment conditions, we introduce the concept of “observational h2” or ho2. ho2 is an estimate of the narrow-sense heritability where the phenotypes (traits) come from observational data sources. Observational data are subject to confounding biases from physician and patient behaviors that will affect the probability that a particular trait is ascertained. The differential probability that a given individual will be phenotyped for a study trait is the ascertainment bias. When ascertainment biases vary from family to family, they can produce unstable heritability estimates that will be dependent on the particular families with available data. In an ideal setting, these biases would be identified and the phenotyping corrected. For a single trait, this would be feasible. However, in a systematic evaluation of heritability across all traits and physiological systems, it is not. Therefore, we used repeated subsampling to produce heritability estimates that are robust to this bias. For each sampling, we used SOLAR (Almasy and Blangero, 1998) to estimate the heritability of the trait adjusted for age and sex, in a procedure we call SOLARStrap (Materials and Methods). SOLARStrap involves repeated sub-sampling of families, estimating heritability on each sub-sample using SOLAR, and averaging these results to produce a more robust estimate.
We used simulations of quantitative and dichotomous traits with heritability ranging from 5–95% to validate the accuracy and robustness of SOLARStrap. SOLAR was precise in estimating the heritability of both quantitative (r2 = 0.999) and dichotomous (r2 = 0.994) traits (Figure 3A). We ran SOLARStrap in the simulated quantitative traits, and it accurately estimated the heritabilities regardless of the sampling size (Figure 3B, r2 = 0.986, p = 3.22e-15). For dichotomous traits, we ran SOLARStrap in two scenarios: (1) including all families regardless of the number of cases in the family and (2) including only families with at least one case. In the latter scenario, we randomly chose one of the cases in each family to be the proband. SOLARStrap accurately recapitulated the heritability estimates regardless of the number of families sampled in both cases, with lower accuracy when a proband was assigned than the complete ascertainment (r2 = 0.988, p = 7.57e-15 without proband and r2 = 0.930, p = 2.85e-11 with proband; Figure 3C and 3D). We found that both SOLAR and SOLARStrap produced accurate estimates given complete data and in the presence of random missingness (Figure 3E). However, SOLARStrap produced more accurate estimates in the presence of ascertainment biases that vary from family to family (Figure 3F). As expected, SOLARStrap produced estimates with larger confidence intervals than SOLAR. SOLARStrap becomes more sensitive to bias as the number of families sampled increased towards the total number of families available (Figure 3G); however, the estimate of heritability is not dependent on the number of families sampled (Figure 3H, r=0.02, p=4.1e-8). We used the Proportion of Significant Attempts (POSA) as a quality score for the heritability estimates generated by SOLARStrap. A higher POSA score represents a more accurate heritability estimate from SOLARStrap (Figure 3I). We injected noise into the data by randomly shuffling a subset of the patient diagnoses, simulating misclassification (misdiagnosis or missed diagnosis) in the medical records. Injection of 5% noise reduced the estimate 13% (from ho2 =0.77 to ho2 =0.67) and 10% noise reduced the estimate 30% (from ho2 =0.77 to ho2 =0.53, Figure 3J). Misclassification is one explanation of lower than expected estimates compared to a carefully ascertained study.
Fig. 3. Validation of SOLARStrap accuracy and robustness using simulated data.
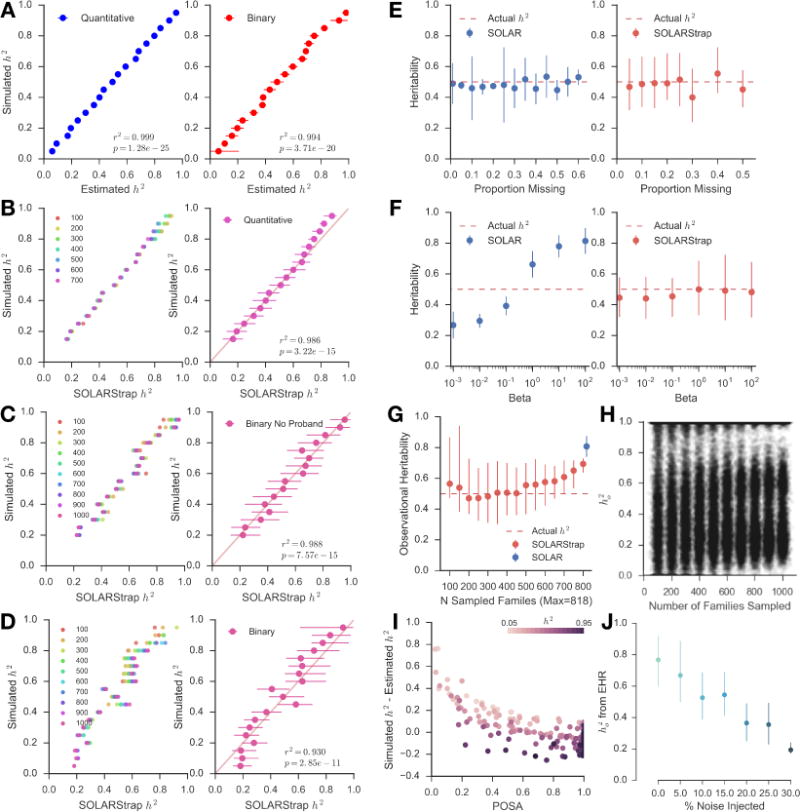
(A) Traits with heritability ranging from 5% to 95% were generated using the SOLAR. We used actual family structures extracted from the EHR by RIFTEHR to generate the simulated traits. We then created dichotomous (binary) versions of the trait by choosing a threshold that would yield a trait with 15% prevalence. SOLAR was very accurate at recapitulating the correct heritability for both quantitative (r2 = 0.999) and binary (r2 = 0.994) traits. In (B), (C) and (D), the number of families varied from 100 to 1000, being represented by different colors. (B) SOLARStrap was run on each of the simulated quantitative traits and was accurate at estimating the true heritability (r2 = 0.986). SOLARStrap was accurate regardless of the number of families that was used in the sampling procedure (left). (C) SOLARStrap was run on each of the binary traits in the setting of complete ascertainment. SOLARStrap achieved equal accuracy as in the quantitative case (r2 = 0.988). (D) SOLARStrap was run on each of the binary traits in the setting of incomplete ascertainment. In this case families without any cases were dropped and a proband was randomly assigned in each family. The accuracy is lower than the case of complete ascertainment (r2 = 0.930). (E) In the presence of randomly missing information, both SOLAR and SOLARStrap produce accurate estimates of the true heritability even when up to 60% of the data are removed. However, in four cases where the proportion removed was 35%, 45%, and above 50% SOLARStrap estimates did not pass our internal quality control criteria. (F) SOLAR is sensitive to this bias and produces inaccurate results as the strength of the bias increases. SOLARStrap is robust to these biases and produces accurate estimates of heritability even in the most extreme case of bias. (G) As the number of families sampled increases toward the total number of available families SOLARStrap becomes more sensitive to bias – in the most extreme case where the number of sampled families is equal to the total number of available families SOLARStrap reduces to simply running SOLAR. (H) The estimate of heritability is not dependent on the number of families sampled (r=0.02, p=4.1e-8). (I) The Proportion of Significant Attempts (POSA) is a primary estimate of quality for heritability estimates produced by SOLARStrap. The accuracy of SOLARStrap increases as the POSA increases (shown as error here). (J) The effect of noise injection on the estimate of observational heritability of rhinitis. We injected noise into the data by randomly shuffling a subset of the patient diagnoses. This simulates misclassification (misdiagnosis or missed diagnosis) in the medical records. When no noise is injected the estimate is 0.77 (0.60–0.92). As noise is introduced the estimate of the heritability decreases to 0.36 (0.23–0.49) once one quarter of the data are randomized.
We found that heritability estimates are significantly correlated across sites (Figure 4A). We identified traits with heritability estimates and then computed the correlation between the estimates found in each one of the study sites to the other two sites. Columbia had 147 traits that overlapped with traits from the other two sites, with correlation r=0.35, p=1.32e-05. Similarly, Weill Cornell had 147 traits, with correlation r=0.48, p=8.20e-10, and Mount Sinai had 58 traits, r=0.36, p=5.48e-03. We mined the literature for heritability estimates and found 91 phenotypes that mapped to phenotypes we curated from the EHR. We also included all traits reported in the latest meta-analysis (Polderman et al., 2015). We used simulations to set the quality control parameters of the SOLARStrap procedure (Materials and Methods). Thirty-three traits passed these quality control criteria. We found that they were significantly correlated with literature estimates for these traits (r=0.45, p=9.11e-03, Figure 4B), and 16 (48%) had overlapping confidence intervals (Table S2). On average, observational heritability estimates were 27% lower than those reported in the literature. We also stratified the heritability estimates by race and ethnicity. The estimates stratified by race and ethnicity are significantly correlated with the overall heritability estimates (Figures 4C and S3).
Fig. 4. Estimating heritability of disease using electronic health records.
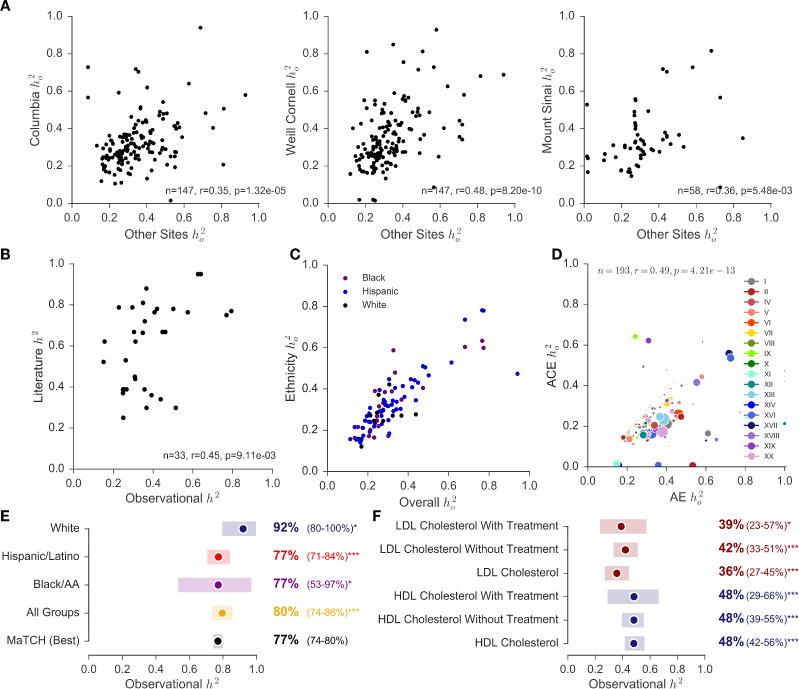
We designed a method, called SOLARStrap, for estimating the heritability of traits where the phenotype is derived under unknown ascertainment biases, the ho2. (A) We found that performance was consistent across sites and (B) that ho2 is significantly correlated with literature estimates of h2. (C) Heritability estimates stratified by race and ethnicity using the AE model are correlated with estimates of ho2. (D) These models are also correlated when computing heritability estimates for ICD10 codes alone. (E) Heritability of traits that have been studied before, such as height, have been recapitulated by our study. We also stratified heritability of height by self-reported race and ethnicity as available in EHR. (F) Observational heritability of HDL cholesterol (blue) is significantly higher than heritability of LDL cholesterol (red). This difference is still observed after stratifying patients by the presence or absence HMG-CoA reductase inhibitors as treatment for hypercholesterolemia.
In addition to the additive genetic model (AE), we also modeled heritability with a term for common environment (ACE) using the mother ID as the household ID. ACE and AE models are overall significantly correlated (r=0.66, p=1.25e-34, Figure S2) and are also correlated when computing heritability estimates for ICD10 codes alone (r=0.49, p=4.21e-13, Figure 4D).
We found that phenotypes from the EHR can increase sample size and recapitulate heritability estimates that are well known. For example, the most heritable trait we found was for sickle cell disease, ho2 =0.97 (0.75–1.00), N=857 (Table 2). We also computed heritability of height and stratified the estimates based on self-reported race and ethnicity as captured in the EHR. The latest meta-analysis reported heritability of height to be 0.77 (CI=0.74–0.80) (Polderman et al., 2015). Using EHR data, we obtained observational heritability of 0.80 (CI=0.74–0.86). The heritability of height among whites had a lower quality control score and is higher than the other groups. (Figure 4E).
Table 2.
Heritability Ranges for Dichotomous and Quantitative Trait Categories.
| Dichotomous Disease Category | Median ho2 | Trait with Highest Heritability
|
Trait with Lowest Heritability
|
||||
|---|---|---|---|---|---|---|---|
| ICD9 Code | Name | Median ho2 (95% CI) | ICD9 Code | Name | Median ho2 (95% CI) | ||
| Hematologic Diseases | 0.50 | 287.31 | Immune thrombocytopenic purpura | 0.71 (0.33–0.96) |
285.9 | Anemia | 0.20 (0.15–0.36) |
| Mental Health Diseases | 0.41 | 309.28 | Adjustment disorder with mixed anxiety and depressed mood | 0.95 (0.36–1.00) |
315.39 | Other developmental speech or language disorder | 0.11 (0.09–0.15) |
| Sense Organs Diseases | 0.41 | 365.11 | Primary open angle glaucoma | 0.93 (0.52–1.00) |
382.9 | Unspecified otitis media | 0.10 (0.06–0.16) |
| Endocrine and Metabolic Diseases | 0.40 | 278.02 | Overweight | 0.71 (0.54–0.88) |
272.4 | Other and unspecified hyperlipidemia | 0.23 (0.15–0.37) |
| Gastrointestinal Diseases | 0.39 | 579 | Celiac disease+ | 0.78 (0.55–0.97) |
521 | Dental caries | 0.12 (0.07–0.18) |
| Infectious Diseases | 0.34 | 111 | Pityriasis versicolor | 0.85 (0.50–0.94) |
780.6 | Fever | 0.11 (0.05–0.23) |
| Respiratory Diseases | 0.34 | 477.9 | Allergic rhinitis, cause unspecified+ | 0.72 (0.25–0.93) |
464.4 | Croup | 0.09 (0.05–0.12) |
| Cardiovascular Diseases | 0.33 | 785.2 | Undiagnosed cardiac murmurs | 0.59 (0.42–0.84) |
786.59 | Other chest pain | 0.18 (0.11–0.25) |
| Pregnancy, Childbirth and Puerperium | 0.54 | O30 | Multiple gestation | 0.76 (0.36–1.00) |
O30-O48 | Maternal care related to the fetus and amniotic cavity and possible delivery problems | 0.41 (0.19–0.61) |
| Hematologic Diseases | 0.45 | D57 | Sickle-cell disorders* | 0.97 (0.75–1.00) |
D64 | Other anemias | 0.18 (0.11–0.30) |
| Injury and Poisoning | 0.40 | T59 | Toxic effect of other gases, fumes and vapors | 0.81 (0.49–0.98) |
S01 | Open wound of head | 0.18 (0.10–0.36) |
| Infectious Diseases | 0.40 | B35 | Dermatophytosis | 0.81 (0.41–0.98) |
B80 | Enterobiasis | 0.11 (0.04–0.13) |
| Genitourinary Diseases | 0.37 | N92 | Excessive, frequent and irregular menstruation | 0.85 (0.62–0.99) |
N80-N98 | Noninflammatory disorders of female genital tract | 0.15 (0.09–0.20) |
| Respiratory Diseases | 0.35 | J01 | Acute sinusitis | 0.85 (0.61–0.98) |
J02 | Acute pharyngitis | 0.02 (0.01–0.03) |
| Eye Diseases | 0.34 | H35 | Other retinal disorders | 0.55 (0.33–0.77) |
H10 | Conjunctivitis | 0.18 (0.10–0.22) |
| Gastrointestinal Diseases | 0.34 | K90 | Intestinal malabsorption | 0.84 (0.69–0.98) |
K02 | Dental caries | 0.14 (0.09–0.20) |
| Endocrine and Metabolic Diseases | 0.34 | E20-E35 | Disorders of other endocrine glands | 0.60 (0.28–0.89) |
E84 | Cystic fibrosis* | 0.01 (0.01–0.02) |
| Cardiovascular Diseases | 0.33 | I15 | Secondary hypertension | 0.50 (0.31–0.89) |
IX | Diseases of the Circulatory System | 0.18 (0.10–0.28) |
| Skin Diseases | 0.32 | L70 | Acne+ | 0.72 (0.20–0.91) |
L80-L99 | Other disorders of the skin and subcutaneous tissue | 0.17 (0.11–0.29) |
| Ear and Mastoid Diseases | 0.31 | H61 | Other disorders of external ear | 0.82 (0.68–0.93) |
H66 | Suppurative and unspecified otitis media | 0.11 (0.06–0.22) |
| Mental Health Diseases | 0.31 | F93 | Emotional disorders with onset specific to childhood | 0.78 (0.27–1.00) |
F40-F48 | Anxiety | 0.02 (0.01–0.03) |
| External Causes of Morbidity and Mortality | 0.31 | V49 | Car occupant injured in other and unspecified transport accidents | 0.94 (0.87–0.99) |
V04 | Pedestrian injured in collision with heavy transport vehicle or bus | 0.01 (0.00–0.01) |
| Signs and Symptoms | 0.30 | R92 | Abnormal findings on diagnostic imaging of breast | 0.48 (0.26–0.65) |
R62 | Lack of expected normal physiological development | 0.07 (0.05–0.10) |
| Musculoskeletal Diseases | 0.27 | M71 | Other bursopathies | 0.61 (0.25–0.99) |
M00-M25 | Arthropathies | 0.18 (0.11–0.25) |
| Congenital malformations | 0.27 | XVII | Congenital Malformations | 0.73 (0.50–0.96) |
Q85 | Phakomatoses | 0.05 (0.00–0.09) |
| Neoplasms | 0.25 | D23 | Other benign neoplasms of skin | 0.35 (0.20–0.53) |
II | Neoplasms | 0.17 (0.08–0.27) |
| Perinatal Diseases | 0.22 | XVI | Certain Conditions Originating In the Perinatal Period | 0.62 (0.45–0.84) |
P00-P04 | Newborn affected by maternal factors and by complications of pregnancy | 0.05 (0.01–0.08) |
| Neurological Diseases | 0.17 | G47 | Sleep disorders+ | 0.31 (0.19–0.48) |
G44 | Other headache syndromes | 0.02 (0.01–0.03) |
| Endocrine Disorders | 0.3 | 3016-3 | Thyrotropin [Units/volume] in Serum or Plasma | 0.37 (0.23–0.49) |
3026-2 | Thyroxine (T4) [Mass/volume] in Serum or Plasma | 0.26 (0.16–0.36) |
| Gastrointestinal Disorders | 0.3 | 2324-2 | Gamma glutamyl transferase [Enzymatic activity/volume] in Serum or Plasma | 0.45 (0.35–0.56) |
1975-2 | Total Bilirubin serum/plasma | 0.11 (0.08–0.16) |
| Hemorrhage | 0.18 | 5902-2 | Prothrombin time - patient | 0.25 (0.16–0.35) |
718-7 | Hemoglobin | 0.14 (0.08–0.19) |
| Metabolic and Nutritional Disorders | 0.41 | 2573-4 | Lipoprotein.alpha [Mass/volume] in Serum or Plasma | 0.49 (0.41–0.58) |
2498-4 | Iron [Mass/volume] in Serum or Plasma | 0.25 (0.14–0.35) |
| Metabolic Disorders | 0.38 | 2085-9 | Cholesterol in HDL [Mass/volume] in Serum or Plasma | 0.51 (0.35–0.67) |
2089-1 | Cholesterol in LDL [Mass/volume] in Serum or Plasma | 0.26 (0.15–0.38) |
| Reticuloendothelial Disorders | 0.29 | 4679-7 | Reticulocytes % | 0.93 (0.77–1.00) |
26450-7 | Eosinophils % | 0.12 (0.07–0.18) |
The median observational heritability and ranges are shown for dichotomous trait categories, both ICD9 and ICD10 codes, and for quantitative trait categories, LOINC codes. Within each category, the trait with the highest heritability and the trait with the lowest heritability are shown. Mendelian conditions are annotated with* and traits with literature heritability estimates are marked with+.
Using phenotypes from the EHR for heritability can provide clarity for poorly studied traits, revealing subtle differences between closely related conditions, and open up new avenues of heritability research. For example, two previous studies had shown conflicting evidence for the relative heritability of HDL cholesterol and LDL cholesterol (Pietiläinen et al., 2009; Souren et al., 2007). The larger of these two studies (N=378) found no difference in the heritability of these two traits when adjusting for age and sex, while the other found a slightly higher heritability for HDL, but was underpowered to detect significance. We present evidence that HDL is more heritable than LDL (ho2 =0.48 CI: 0.42–0.56 vs 0.36 CI: 0.27–0.45 at Columbia; ho2 =0.51 CI: 0.35–0.67 vs 0.26 CI: 0.15–0.38 at Weill Cornell). This finding holds when accounting for the use of HMG-CoA reductase inhibitors as treatment for hypercholesterolemia (Figure 4F). At 96,241 patients in the Columbia cohort and 33,239 patients in the Weill Cornell cohort, ours is the largest heritability study of cholesterol ever conducted, to our knowledge.
Heritability is used to estimate genetic contribution to complex, polygenic, or quantitative traits rather than classic Mendelian disorders in which the presence or absence of a single genetic mutation determines the development of the disease. Interestingly, our algorithm was able to provide estimates of heritability for Mendelian traits without genetic information based only on EHR data. For example, we observed high heritability estimates for common highly penetrant Mendelian diseases with autosomal transmission, such as sickle cell disease (ho2 =0.97, 95%CI 0.75–1.00, N=857 families), but low heritability estimates for other rare recessive Mendelian traits, such as cystic fibrosis (ho2 = 0.01 CI: 0.01–0.02 N=7,682 families). Recovering a heritability estimate of almost 1 for sickle cell is reassuring since that is exactly what would be expected in the presence of a highly penetrant mutation and when carriers are also frequently correctly identified in the EHR. However, the heritability of cystic fibrosis was very low. This is likely because the additive model used for heritability estimation is clearly misspecified for a rare disease with a known recessive pattern of inheritance and asymptomatic carrier status. Moreover, because of the availability of carrier screening and prenatal diagnosis, cystic fibrosis families are nowadays typically small (Castellani et al., 2009; Dupuis et al., 2005; Scotet et al., 2012; Slieker et al., 2005); affected cases also frequently suffer from infertility limiting the number of observed disease transmissions per family. Indeed, in our dataset families with cystic fibrosis were smaller (average family size 3.0 for cystic fibrosis vs 4.6 for sickle cell disease, p=8.8e-14), had more advanced average age (average 40 years old vs 36 years old for sickle cell disease, p=4.1e-17), had fewer “child” and “grandchild” relationships (p= 2.18e-14and p=1.63e-20, respectively), and included more parental relationships (p= 2.00e-159) when compared to the sickle cell disease cohort (Table S3).
In addition, subtle phenotypical variations that are routinely collected clinically can be studied. For example, analysis of the highest and lowest heritability estimates by category provides us with interesting findings. Among neurological diseases, we observe that sleep disorders are highly heritable (ho2 =0.31 CI: 0.19–0.48); whereas headache syndromes are not (ho2 =0.02 CI: 0.01–0.03). A comprehensive list of heritability estimates for multiple diseases’ categories is available in Table 2. Finally, our study demonstrated that the EHR can identify traits for future genetic studies. We computed heritability estimates for 500 traits, only 33 of which had been previously studied as part of the latest meta-analysis or identified by our literature review. All heritability estimates are available through a web interface and to download at http://riftehr.tatonettilab.org.
Discussion
Analysis of EHR data has yielded insight into drug effectiveness and allowed precise definition of phenotypes to investigate disease processes (Birkhead et al., 2015; Boland et al., 2015; Lorberbaum et al., 2016; Ritchie et al., 2015; Tatonetti et al., 2012; Wei and Denny, 2015). For the first time on a large scale, we used EHR data to infer pedigrees from patient-provided emergency contact information. We presented our algorithm for performing this relationship extraction, RIFTEHR, validated its performance, and applied it to the medical records of three independent institutions. This approach has significant implications for estimating heritability of disease without genetic testing. The EHR data used in this research are nearly ubiquitous and, if privacy is adequately protected, could allow almost any research hospital to identify related patients with high specificity. Finally, we used EHR-inferred relationships to compute heritability estimates for 500 traits in diverse populations on a scale not previously available. Our approach allowed for heritability evaluation of many diseases not previously studied.
Heritability is a key component in precision medicine and is typically estimated based on family history. Collection of comprehensive and accurate family history is time-consuming and does not occur during the vast majority of clinical encounters (Polubriaginof et al., 2015). The construction of pedigrees by inference of relatedness from administrative records allows for rapid assessment of family history and heritability at scales that were previously impossible to achieve. The algorithm used in this study uncovered over 560,000 pedigrees within the medical records of three academic medical centers. We validated the inferred familial relationships against both clinical and genetic references and found PPV between 66% and 99% among first-degree relatives. One of the limitations of our method is the inability to detect adoptions, differentiate half-siblings from full siblings, or detect non-paternity events. Emergency contact is not a biological construct; therefore, patients identify not only direct blood relatives, but also adoptive family members and use familial labels for friends.
We used EHR-inferred relationships to calculate heritability estimates among individuals with defined relationships. Previous research in this area has focused on family studies of known relatives, primarily twins. Mayer and colleagues used EHR data to create a cohort of 2,000 twins/multiple births and measured concordance among identified twins for two highly heritable diseases, muscular dystrophy and fragile-X syndrome (Mayer et al., 2014). Our study looked not only at twins, but entire families across several generations. Importantly, most previous studies have predominantly involved White Europeans and may not be representative of other populations. However, our results reflect the diverse, multiethnic population of New York City – the majority of our patient population is not self-reported as “white.” For example, we stratified patients that had height available in the EHR by self-reported race and ethnicity and used these cohorts of patients to compute heritability of height. We observed that the heritability estimate was higher among whites in comparison to other race and ethnicity groups. Bias might explain this difference since this group had a lower quality control score than the others. But we also investigated income as a possible confounder using patient ZIP codes and Census data. Overall, the population self-identified as white has twice the average income than other populations – one possible explanation for this difference given that heritability estimates increase in more homogenous environments. This could create a difference in heritability of height both across ethnicities and across income levels. In other cases, traits have been shown to be more heritable in high socioeconomic strata than in lower strata (Bronfenbrenner and Ceci, 1994; Harden et al., 2007; Turkheimer et al., 2003). The stratification by race and ethnicity was not feasible for all traits. Over 68% of the families have a single race and ethnicity reported and over 29% of the families have two distinct race and ethnicity groups reported. Estimates of traits that had a large enough sample size to stratify by race and ethnicity are available at http://riftehr.tatonettilab.org. For traits that were stratified by race and ethnicity, heritability estimates were significantly correlated with the overall heritability estimate.
The primary and most significant challenge when using traits defined from an observational resource, like the EHR, is incomplete phenotype information resulting in ascertainment bias. In a heritability study, the phenotype of each study participant is, ideally, carefully evaluated and quantified. This is not feasible, however, when the cohort contains millions of patients with thousands of phenotypes. The bias may depend on many latent factors, including the trait being studied, the trait status of relatives, the proximity to the hospital, and an individual’s ethnicity and cultural identification, among others. The consequence of this uncontrolled ascertainment bias is that heritability estimates will be highly dependent on the particular individuals in the study cohort. We observed that a small number of highly biased families could significantly sway the heritability estimate. Repeated sub-sampling will be robust to these types of biases. EHR-based heritability estimates are particularly well-suited for complex traits that require large numbers of patients (e.g., Type 2 Diabetes Mellitus and Obesity).
The unique nature of the relationships and phenotypes derived from the EHR may necessitate novel methods for estimating heritability. We used a mixed linear model implemented in SOLAR (Almasy and Blangero, 1998) to estimate heritability and used repeated sampling, which we call SOLARStrap, for efficiency and to correct for ascertainment heterogeneities. We evaluated the impact of bias and missingness on SOLARStrap by comparing the heritability estimates with simulated data and demonstrated that SOLARStrap is robust to bias. Overall, quantitative traits perform better than dichotomous traits, and traits commonly documented in EHRs perform better than rare and poorly documented conditions (e.g. mental health disorders). There may be more accurate ways to estimate heritability from this unique data source. Future work could focus on using only certain types or relationships or use alternative modeling strategies. Fragmentation of care is an additional limitation when using EHR data for genetic research. Patients often go to multiple healthcare systems, and therefore, the information available in a single institution is incomplete. Future implementations may address this limitation by accounting for the number of visits and documentation of primary care physician in the healthcare system or by integrating records across a regional healthcare network.
There are significant bioethical considerations regarding the use of the RIFTEHR method, including how best to balance the competing demands of protecting patients’ privacy with clinicians’ duty to warn relatives of potential genetic risks. The method could readily be applied in EHR systems, such that clinicians could easily access the health information of a patient’s family members. In the United States, accessing a family member’s health information in this manner may be considered a violation of the 1996 Health Insurance Portability and Accountability Act (HIPAA) Privacy Rule (United States, 1996). On the other hand, case law in the United States has established that healthcare providers have a responsibility to inform a patient’s relatives about heritable conditions that may reasonably put the relatives “at risk of harm” (Suarez, 2011). These conflicts may need to be resolved before automatic relationship inference can be used clinically. It is worth noting there is a risk of reidentification of family structures, even when de-identified according to the HIPAA Safe Harbor. For example, unique family structures could be identified by cross-referencing obituaries and other online tools. Extra safeguards are necessary to mitigate these risks when releasing these data.
We have described and validated a method for identifying familial relationships in patient medical records and used 7.4 million relationships inferred from the EHRs at three academic medical centers to estimate heritability of 500 traits without genetic testing. We found that heritability estimates were concordant across the three centers, and are broadly consistent with published studies, suggesting that the method may have broad applicability. Genetic information is valuable but expensive and not always available. In this case, familial relationships extracted from emergency contact information can personalize disease risk prediction and facilitate heritability determination for phenotypes that were not previously investigated in family-based or twin studies. The correspondence of our heritability estimates with family-based estimates provides a direct validation of the value of electronic health records for generating inferences about disease, making RIFTEHR a valuable tool for the advancement of precision medicine.
STAR Methods
CONTACT FOR REAGENT AND RESOURCE SHARING
Please direct any requests for further information or reagents to Lead Contact, Nicholas P. Tatonetti (nick.tatonetti@columbia.edu).
EXPERIMENTAL MODEL AND SUBJECT DETAILS
The data for this study were obtained from the inpatient EHR used at the hospitals affiliated with three large academic medical centers in New York City: Columbia University Medical Center, Weill Cornell Medical Center, and Mount Sinai Health System. Columbia University Medical Center and Weill Cornell Medical Center operate together as NewYork-Presbyterian Hospital and herein, we will refer to the hospitals and the data associated with them as Columbia and Weill Cornell, respectively. Similarly, we will refer to Mount Sinai Health System and its data as Mount Sinai. This study was approved by Institutional Review Boards independently at each site (protocol number AAAO4154 and AAAL0601 at Columbia, 1603017109 at Weill Cornell, and HS15-00873 at Mount Sinai). A waiver of informed consent was granted since this was a retrospective study, involving no greater than minimum risks to the subjects. The use of genetic data from previously conducted research studies was approved by the IRB (AAAI0997, AAAO6702, AAAL0601) and recruited study participants provided written informed consent.
This study included 682,267 patients from Columbia, 437,375 at Weill Cornell, and 783,185 at Mount Sinai. The demographic description of the patients from the three study sites is detailed in Table 1.
Relationship Inference from the Electronic Health Record (RIFTEHR)
The institutional review boards at the three study sites approved this research. The standard operating procedures require patients who receive care at one of the three academic medical centers to provide information about an emergency contact. This information included the person’s name, address, phone number, and their relationship to the patient (e.g., parent, sibling, friend). Using a method we call “Relationship Inference from the Electronic Health Record” (RIFTEHR), we used the emergency contact information to identify familial relationships in the EHR in cases where the emergency contact person had his or her own record generated by an encounter with the healthcare system. Algorithmically, we then inferred additional relationships from the connectedness of the identified individuals. This information was validated against genetic data and a separate module of the EHR which documented the linkage between mothers’ and their newborns’ medical records.
Deriving familial relationships from emergency contact data
Matching emergency contact to medical records
Our algorithm created for each patient a list of all reported emergency contacts. Then, for each emergency contact, it attempted to identify a medical record by matching first name, last name, primary phone number, and ZIP code. First, we considered all cases with first name and filter the table that contains all patients’ information to identify records that contain the same first name. We then returned the identified records and performed the same comparison with last name, primary phone number, and ZIP code. Subsequently, we compared the combination of two variables at a time (i.e. first name and last name, first name and primary phone number, first name and ZIP code, etc.). We then performed combinations of three variables and then of all four variables. We only considered it successful when we identified a single patient that matches to the emergency contact information given. We also captured which variables were used in the matching process for each one of the emergency contacts (i.e. first name and last name; first name, last name and phone number, etc.). The output of this algorithm contained a patient’s identifier, the relationship between the patient and the matched emergency contact, the emergency contact’s identifier, and a list of the variables used to perform the matching process. We used as patient identifiers the Enterprise Master Patient Index (EMPI), when available or the medical record number (MRN). EMPIs are a unique identifier created to refer to multiple MRNs across the healthcare organization. Using EMPIs allowed us to perform better in the matching process since duplicates from patients having more than one MRN were excluded.
Quality control of matches
Once the matches were identified, we excluded patients with non-biological relationships (i.e. spouse, friend). Specific relationships were mapped to relationship groups (e.g. the relationship “mother” is mapped to “parent”). We then calculated the age difference between two related patients and excluded parents that were less than 10 years older than their children, children that were less than 10 years younger than their parents, grandparents that were less than 20 years older than their grandchildren, grandchildren that were less than 20 years younger than their grandparent. Since parents and grandparents must be older than their children and grandchildren, we also flipped relationships when the age difference between parent or grandparent and its child or grandchild was negative, specifically the relationship “parent” becomes “child” and the relationship “grandparent” becomes “grandchild.” The same process was done when the age difference between children and grandchildren was positive. We also excluded every patient that matches to 20 or more distinct emergency contacts since it is unlikely that patients have such a high number of family members as a direct emergency contact. Finally, we generated the opposite relationship for every relationship pair. For example, if we determined that A is a parent of B, the opposite relationship is that B is a child of A.
Inferring familial relationships
Using the matches identified, we inferred additional relationships. The inference process was made based on familial relationship rules. For example, if patient A is the mother of patient B and patient B is the mother of patient C, then by inference we know that A is the grandmother of C and C is the grandchild of A. The rules used to perform these inferences are described in Table S5.
Quality control of inferred relationships
Once additional relationships are inferred, we removed ambiguous relationships such as “Parent/Aunt/Uncle” if the same pair contains a unique specific relationship, in this case, either “Parent” or “Aunt/Uncle.” The same was done for “Child/Nephew/Niece,” “Sibling/Cousin,” “Parent/Parent-in-law,” “Child/Child-in-law,” “Grandaunt/Granduncle/Grandaunt-in-law/Granduncle-in-law,” “Grandchild/Grandchild-in-law,” “Grandnephew/Grandniece/Grandnephew-in-law/Grandniece-in-law,” “Grandparent/Grandparent-in-law,” “Great-grandchild/Great-grandchild-in-law,” “Great-grandparent/Great-grandparent-in-law,” “Nephew/Niece/Nephew-in-law/Niece-in-law,” and “Sibling/Sibling-in-law.”
Identification of families
To identify families in the datasets, we excluded all non-biological relationships such as spouses and in-laws, as well as ambiguous relationships such as “Parent/Parent-in-law.” Using both provided and inferred relationships, we created a network where each node corresponds to a patient and edges represent familial relationships. To identify different families, we decomposed the network into individual connected components.
Identification of twins
To identify twins, we matched siblings that shared the same last name and the same date of birth. We did not have enough information to distinguish between monozygotic and dizygotic twins.
Evaluation of automatically inferred relationships
Evaluation using the EHR’s mother-baby linkage
We used the EHR’s mother-baby linkage as the reference standard to evaluate identified maternal relationships. Cases were considered true-positives when maternal relationships identified by RIFTEHR were also present in the EHR’s mother-baby linkage table. Cases were considered false-positives when maternal relationships identified by our algorithm were discordant with the EHR’s mother-baby linkage table. And lastly, false-negative cases occurred when a maternal relationship was captured by the EHR’s mother-baby linkage but not by our method. Overall performance was evaluated by calculating overall sensitivity and positive predictive value (PPV). To assess if matches identified by different variables performed differently, we also computed sensitivity and PPV. We stratified the identified relationships by the number of variables used to match the emergency contact to a patient in a healthcare system (Table S4), as well as by the combination of variables (e.g., last name only, first name and last name, etc.) used to perform the match (Table S4). Additionally, we used the EHR mother-baby linkage information to infer siblings. We then used these relationships to evaluate siblings identified by RIFTEHR. Similarly to the maternal relationships evaluation, overall sibling performance was evaluated by calculating sensitivity and PPV.
Evaluation using genetic data with analysis for kinship
Genotype data were collected from existing sources for 1,524 individuals. At Columbia, genetic data were available for 302 individuals. Genotyped participants had a mean age 29.6 years, and approximately 70% were female. Participants self-identified as: Hispanic or Latino (41%), Black or African American (3%), White or Caucasian (33%), Other (11%), or Unknown/Declined to Answer (12%). Data were collected from three separate sources: the Institute for Genomic Medicine, The Columbia University Medical Center Pathology Department, and the Washington Heights/Inwood Informatics Infrastructure for Comparative Effectiveness Research (WICER) project, using whole exome sequencing, Affymetrix CytoScan HD array, and the Illumina Multi-Ethnic Genotyping Array, respectively. To select single-nucleotide polymorphisms (SNPs) for kinship, minor allele frequency was filtered to >5%, and genotyping rate to 99% using PLINK (Purcell et al., 2007). Independent SNPs were selected using the sliding window (100 SNPs) linkage disequilibrium approach. This resulted in a total of 24,752 variants from the Institute for Genomic Medicine data, 8,544 SNPS from the WICER data, and 32,938 SNPs from the Pathology Department data. PLINK was then used to calculate identity by descent (IBD) by determining results (P(IBD=2)+0.5*P(IBD=1)(proportion IBD)) for each pair of individuals. We considered that the predicted relationship was correct if the blood relationship fraction between the two people was the same as the one expected for the predicted relationship with a margin of error of 20% of the expected blood relationships. For example, for inferred mother-child pairs, two individuals in a pair share 50% (±10%) of their genetic information, then that provides evidence that the predicted relationship is correct. Likewise, for inferred aunt-niece pairs, the two individuals are expected to share 25% (±5%). The performance was evaluated by calculating PPV. The research studies were approved by the IRB (AAAI0997, AAAO6702, AAAL0601) and recruited study participants provided written informed consent.
Using the Mount Sinai data, we leveraged genome array data for 24,441 participants recruited to the BioMe Biobank Program of The Charles Bronfman Institute for Personalized. Genotyped participants had a mean age 55.8 years, and approximately 61% are female. Participants self-identified as: Hispanic/Latino (45%), African American (31%), White/Caucasian (8%), Asian (6%), Mixed ancestry (6%), or Other (11%). To calculate genetic relatedness, we first merged BioMe participants (N) genotyped either on the Illumina OmniExpress HumanCore (N=11,212) and Multi-Ethnic Genotype Array v1.0 (N=10,467) platforms, retaining only the intersection of sites (n) between the two arrays (n=385,531). We subsequently removed palindromic sites (n=7,215 SNPs) and sites with a missingness rate > 1% (n=517) and a MAF < 5% (n=112,537) leaving a total of 112,537 SNPs. Of 21,679 BioMe participants with genotype data, emergency contact information was available for 16,341, and in 1,222 cases both family members with relationship inferred by RIFTEHR were in BioMe. Pairwise genetic relationships were estimated by Identity-by-State analysis with PLINK1.9 using the –genome flag. Inferred relationships from RIFTEHR were compared to pairwise genetic relationships to assess performance metrics using the “caret” package with R version 3.0.3. Pairs of patients with conflicting familial relationships were analyzed based on the closest relationship available. For example, if the same pair has two distinct relationships inferred based on their emergency contact information (e.g. parent and aunt/uncle), we considered the first-degree relationship to be correct (in this case, parent) for evaluation of the relationship against genetic data. Parent-offspring and sibling relationships groups were both expected to share ~50% genetic relatedness IBS ( mean 0.5, s.d. ± 0.1). We could distinguish between these two groups by examining the IBS measures at heterozygous (IBS1) and homozygous (IBS2) sites. Parent-offspring were defined as IBS1 > 0.75 and IBS2 < 0.25 (n=1087 pairs), full-siblings were defined as pairs that shared between 0.35 and 0.65 IBS1, and IBS2 > 0.15 and < 0.5 (n=502), monozygotic twins were defined as individuals sharing > 0.8 IBS2 (n=2). In each RIFTEHR group we calculated positive predictive values (PPV) based on how many predicted parent-offspring and siblings met this genetic criteria. Grandparental, avuncular and half-siblings are all expected to share ~25% genetic relatedness IBS ( mean 0.25, s.d. ± 0.05). Avuncular relationships involved one sibling and the offspring of the other sibling regardless of sex; therefore, the term avuncular refers to both aunts and uncles.
We could not distinguish these groups any further, so we calculated positive predictive values for each group based on how many total pairwise relationships met this criteria (n=976). We did not calculate PPV for cousins, grand-avuncular, great-grandparental, great-grand-avuncular, first cousin once removed relationships as the numbers of predicted relationships per group were low (n≤10). Finally, as negative control, we compared predicted spousal relationships with low or no evidence of IBS sharing ( < 0.05, < 0.1 IBS1 and < 0.1 IBS2). The BioMe Biobank Program (Institutional Review Board 07– 0529) operates under a Mount Sinai Institutional Review Board-approved research protocol. All study participants provided written informed consent.
Evaluation using clinical data
As a qualitative validation of all relationship types, including distant relationships such as great-grandparent, we calculated age difference between all pairs of family relatives and stratified it by relationship type. We compared the identified age differences to what would be expected in a real family structure. For example, great-grandparents should be much older than their great-grandchildren.
METHOD DETAILS
Phenotyping in the EHR
We used clinical pathology reports (e.g., laboratory tests such as hemoglobin A1c which is primarily used to measure the three-month average glucose concentration in plasma) as quantitative traits and diagnosis billing codes (ICD codes) as dichotomous traits. We extracted the most commonly performed laboratory tests and mapped them to LOINC codes so that they could be matched between institutions. Each patient may have multiple laboratory reports over time. To extract a single value for each test, we collapsed all reports for each patient into a single value using the mean. This mean represents the average value for the laboratory report for the patient. For example, we used a patient’s mean blood glucose value over their lifetime instead of individual values of blood glucose.
For dichotomous traits, we used any diagnosis billing code that were used for at least 1,000 distinct patients. Any patient with evidence of that billing code in their medical record history was considered a “case.” For ICD-9 codes, controls were chosen as any patient that did not have that diagnosis nor any diagnosis that shared an ancestor according to the Clinical Classifications Software (CCS).
CCS tool was developed by the Agency for Healthcare Research and Quality (AHRQ) and is composed of diagnoses and procedures organized in two related classification systems. In this study, we only used the diagnoses classifications. The single-level system consists of 285 mutually-exclusive diagnosis categories. It enables researchers to map any of the 3,824 ICD-9-CM diagnosis codes into one of the 285 CCS categories.
CCS also has a multi-level system composed of 4 levels representing a hierarchy of the 285 categories. The first level is broken into 18 categories. To define a control group, we linked the ICD-9 codes associated with a phenotype of interest to their corresponding CCS categories using the top-level hierarchical categories. We also generated a table associating each patient to CCS categories from their diagnosis. Once this mapping was done, each phenotype was associated with one or more distinct CCS categories. We matched the CCS categories in the multi-level system to identify the first level parent category. We considered these top-level categories as our exclusion criteria since the control cohort for this phenotype should have no mention of any CCS under these categories in its medical records. For example, the controls for atrial fibrillation will exclude patients with cardiovascular diseases.
For conditions recorded using ICD-10 codes, we used the hierarchy from ICD-10 to identify patients for the control group. Patients that did not have the same ICD-10 code as diagnosis nor any diagnosis that shared an ancestor code were considered controls.
We curated a set of 85 phenotypes to use for training and testing the SOLARStrap algorithm (see below Preparation of data for analysis on external computing clusters). For these 85 phenotypes, we grouped closely related diagnoses codes together to increase the total number of patients (Table S6).
Estimation of heritability from the Electronic Health Records
Rationale
The most significant challenge when using traits defined from an observational resource, like the EHR, is the lack of ascertainment. In a traditional heritability study, the phenotype of each study participant is, ideally, carefully evaluated and quantified. This is infeasible, however, when the cohort contains millions of patients with thousands of phenotypes. The differential probability that a given individual will be phenotyped for a study trait is the ascertainment bias. The bias may depend on many latent factors, including the trait being studied, the trait status of relatives, the proximity to the hospital, and an individual’s ethnicity and cultural identification, among others. The consequence of this uncontrolled ascertainment bias is that heritability estimates will be highly dependent on the particular individuals in the study cohort. We hypothesized that repeated subsampling would be robust to biases introduced by extremely different ascertainment between families. We define the observational heritability, or ho2, as the average of the statistically significant sample estimates (using median). For a given trait, the procedure, which we call SOLARStrap, involves sampling families, running SOLAR to estimate sample heritability, and rejecting or accepting the estimate based on a set of quality control criteria. Each step is detailed below.
SOLARStrap Protocol
Building pedigree files
To compute disease heritability using EHR data, we built pedigree files using the data from each one of the study sites. When building pedigree files, of the 223,307 families at Columbia, there were 6,894 that contained conflicting relationships – where two individuals were inferred to have two different relationships. At Weill Cornell, 3,258 families out of 155,811 contained conflicts, and at Mount Sinai 25,438 families out of 187,473. These families were excluded from the heritability studies. In some cases, more than one mother or father is annotated for an individual. This could be because of duplicate patient records or errors in the EHR relationship extraction. We resolved these issues by choosing the mother or father that has more relationships in the family. The other relationship is discarded. We then constructed a master pedigree file for each site. To construct this pedigree file, we iterated through each member of each family. For each individual, we either know the mother and father from the EHR-derived relationships or not. If not known, then a new identifier was created to represent the parent. At this point, we iterated through all other family members and recorded the relationships between the new individual and each family member. We repeated this process until the entire pedigree file was filled, thus creating the master file. The master pedigree files contained 1,404,671 individuals at Columbia, 949,440 at Weill Cornell, and 863,340 at Mount Sinai.
Sampling Families
To compute heritability estimates for each trait, we sampled an empirically defined proportion of the available families. The number of families that are sampled combined with the prevalence of the trait defines the power of the heritability analysis. A smaller heritability can be detected with larger sample sizes. As the sample size increases towards the total number of available families the variance in heritability will decrease, but the estimate will be less robust to bias (Figures 3 and S1). This is because we sampled without replacement. Based on our simulation studies, we used sample sizes of 15 and 20% of the total number of families with at least one case. For those estimates that did not pass our quality control criteria at this level, we increased the number of families sampled to 45% The maximum sample size is defined by the limitations of SOLAR which can only handle a maximum of 32,000 individuals per pedigree file. For each sample size, we performed 200 samplings. For each of these, we built a custom pedigree and phenotype files and ran SOLAR to estimate the heritability. We then aggregated the results and reported the median heritability with the 95% confidence interval.
Generating sample pedigree and phenotype files
For each sampling, a set of N families was selected. To construct the sample pedigree file, we identified all rows from the master pedigree files that corresponded to these families and created a new file from this subset. Once the pedigree file was created, we iterated over every individual in the pedigree and used the reference trait data and demographic data to enter the phenotype status and age of the patient. If no phenotype data were available for the individual, we enter it as missing. For dichotomous traits, the trait values were either 0 (absence), 1 (presence), or missing and a “proband” was randomly assigned by selected a single individual from each family that has the trait. See “Phenotyping in the EHR” for a description of how these traits were assigned. For quantitative traits, we entered the quantitative value or missing.
Running SOLAR
We used SOLAR (Almasy and Blangero, 1998), a software that incorporates a pedigree-based variance-component and a multipoint identity-by-descent (IBD), to estimate both quantitative and dichotomous trait heritability using a pre-defined mixed linear model. In both cases, sex and age were modeled as covariates. After the pedigree and phenotype files are loaded the heritability is estimated with the `polygenic -screen` command. We used the ‘tdist’ command in SOLAR to adjust quantitative traits that were not normally distributed. For dichotomous traits, one “proband” was chosen at random for each family. SOLAR will automatically detected the presence of a dichotomous trait and converted the estimate from the observed scale to the liability scale. The heritability estimate, error on the heritability estimate, and the p-value were saved from each run for later analysis and aggregation. To investigate the relative contribution of the environment to the studied phenotype, we used SOLAR to compute household effects. For this analysis, we assigned the mother ID as the household ID.
Quality Control of SOLAR heritability solutions
SOLAR does not converge on a solution for heritability for all samples. Errors in the pedigree or in the ascertainment of phenotypes are the most likely causes for these failures. First, we rejected any runs of SOLAR that resulted in no solution for the heritability. We then considered two additional criteria that must be met for a solution to be considered legitimate: edge epsilon and noise epsilon. Edge epsilon (∊e) is a threshold that determines if the estimate is sufficiently close to 1 or 0. Any estimate within εe of 1 or 0 was rejected. Noise epsilon (εn) is a threshold that determines if an estimate have implausibly low error. Any estimate with implausibly low error was rejected (h2 error is less than εn of the h2 estimate). These hyperparameters were set using simulated heritability data.
After filtering the SOLAR solutions for the basic criteria, we defined an additional quality control metric called the Proportion Of Significant Attempts, or POSA. POSA is defined as the number of solutions with a p value less than αPOSA divided by the total number of converged solutions (or attempts). The POSA is important because it is closely related to the power of the analysis. A fully powered analysis will have a POSA of 1, meaning that all converged estimates are statistically significant. A POSA of 0.5 means that only half of the converged estimates are statistically significant. When the families were sampled, the observed heritability was large enough to be detected with p < αPOSA half of the time. Or, in other words, we were powered to detect a heritability in 50% of samplings. We showed that the higher the POSA, the more accurate the heritability estimates are (Figure 3I). We chose a minimum POSA score, POSAlower and the αPOSA using simulations.
Aggregation of sampling results (computing ho2)
For each sampling that passed the quality control criteria and met the minimum POSA score, we computed the ho2 as the median. The median ho2 corresponds to a single run of SOLAR that has passed all quality control filters. We used the 95% confidence interval as the error of the ho2. We found that this error is closely related to the standard error reported by SOLAR (Figure 3). All raw heritability estimates that passed the initial quality control were made publicly available for reanalysis.
Preparation of data for analysis on external computing clusters
Due to the high number of heritability estimates that needed to be computed, external computing resources from The Open Science Grid (OSG) and Amazon Web Services (AWS) were used. The Open Science Grid (OSG) is a massive computing resource funded by the Department of Energy and the National Science Foundation. The OSG is comprised of over 100 individual sites throughout the United States, primarily located at universities and national laboratories. The sites contain anywhere from hundreds to tens of thousands of CPU cores available for scientific research (Pordes et al., 2007; Sfiligoi et al., 2009). AWS is used to supplement this resource, which makes available on-demand compute instances with high-performance capacity. Per institutional requirements, no protected health information or personally identifying information can be transferred to systems outside of our institutional networks. To leverage these resources for our computing task, we prepared a data subset according to the Safe Harbor guidance provided by the U.S. Department of Health and Human Services (https://www.hhs.gov/hipaa/for-professionals/privacy/special-topics/deidentification/index.html#standard). The following is a description of how we processed the data for Safe Harbor for each of the 18 identifiers here enumerated from (A) through (R): (A) we removed first, middle, and last names for all patients, (B) all patient address information was removed, (C) all dates were removed and all ages over 89 are coded as “90”, (D) telephone numbers and (E) fax numbers were removed, (F) there were no email addresses in our subset of the clinical data, (G) there were no social security numbers in our subset of the clinical data, (H) medical record numbers were mapped to a 10 digit random number and the mapping was stored on a limited access PHI-certified server within the institutional firewall and will never be made available, (I) there were no health plan beneficiary numbers in our data subset, (J) there were no account numbers in our data subset, (K) there were no certificate or license numbers, (L) there were no vehicle numbers or serial numbers in our data subset, (M) there were no device identifiers or serial numbers, (N) there were no URLs in our data subset, (O) there were no IP addresses in our data subset, (P) there were no biometric identifiers in our data subset, (Q) there were no full-face or comparable images in our data subset, (R) there were no other uniquely identifying characteristics or numbers. All data were transferred using secure file transfer protocols using encryption and were destroyed immediately after retrieval of the results.
Validation of accuracy and robustness of SOLARStrap using Simulated Traits
The scripts and data used in the following simulations are available publicly at https://github.com/tatonetti-lab/h2o.
Simulation of quantitative and dichotomous traits
To validate the accuracy and robustness of SOLARStrap, we constructed a set of 4,195 families containing 14,690 individuals chosen from the families extracted from the EHR using RIFTEHR. Relationships and pedigree structures are heterogeneous across these families. We used the ‘simqtl’ command from SOLAR to simulate quantitative traits with heritability values of 5% to 95% at 5% intervals for this pedigree. Traits were simulated for 19 different heritability values in total. To generate binary traits, a threshold for the quantitative value was chosen for each of the 19 simulations so that the prevalence of the dichotomous, or binary trait, was 15%. We used the prevalence of 15% for dichotomous traits because overall, the average prevalence of disease among patients with familial relationships was 15.9% (min–max: 8%–37%). The result of each simulation was a phenotype file (.phn) containing the family id, the individual id, and the quantitative or binary trait value.
Evaluation of simulated traits
We evaluated the quantitative and dichotomous traits by running SOLAR using the simulated phenotype files for each of the 19 different values for heritability. We summarized performance using the r-squared and ran a test of significance.
Creating trait files for SOLARStrap
We then created trait files for SOLARStrap. SOLARStrap is designed to use trait files that are similar to the phenotype files used by SOLAR but can contain more than one type of trait and more than 32,000 individuals (SOLAR’s limit). We used a python script to combine the 19 heritability estimates into a single trait file.
Evaluation of the accuracy of SOLARStrap on quantitative traits
To evaluate the accuracy of SOLARStrap on quantitative traits, we ran SOLARStrap on each of the 19 simulated datasets. We repeated these runs using a different sampling size (argument nfam in SOLARStrap) between 100 and 700 increasing by 100. We selected the largest sample size (nfam=700) and evaluated the accuracy of SOLARStrap using r-squared and tested significance using regression analysis.
Evaluation of the accuracy of SOLARStrap on dichotomous traits
When working with dichotomous traits, there are two scenarios that had to be considered to evaluate the accuracy of SOLARStrap. Either (1) the cases and controls are equally known, meaning that each individual in the pedigree can be assigned to either being a case or control, or (2) the cases are higher confidence than the controls. This latter case more closely resembles the scenario present in the electronic health records. Documentation of a disease in the EHR can be very indicative of the patient having the disease, but the absence of this documentation does not mean the patient does not have the disease. We evaluated the accuracy of SOLARStrap in both cases. For the former, we included all individuals in the pedigree, and for the latter, we excluded any families where there were no cases. In the pedigrees where the cases are higher confidence than controls, we assigned a proband so that the estimate of heritability is not biased. This was accomplished by randomly selecting a single individual in each family as the “proband.”
Evaluation of the robustness of SOLAR and SOLARStrap to missing data
To evaluate the robustness of SOLAR and SOLARStrap to missing data, we chose a single simulated trait (h2=50%) and randomly changed individual phenotypes to unknown. We evaluated removing 5 to 60% of the phenotype data at 5% intervals.
Evaluation of the robustness of SOLAR and SOLARStrap to biased data (non-random missingness)
To evaluate the robustness of SOLAR and SOLARStrap to biases, specifically non-random missingness, pedigrees were removed from the heritability estimation with a probability determined by a beta distribution. The beta distribution is a continuous probability distribution bounded by 0 and 1 and parameterized alpha and beta. Each family can be assigned a probability by sampling this distribution. Most families will have the same probability of missing data with a small number of families have a much lower probability. By varying the beta and alpha parameters we can change the proportion of families with a much lower probability of missing data. We varied the value of the beta parameter from 0.001, 0.01, 0.1, 1.0, 10.0, to 100.0 and we set the alpha parameter such that the average probability of missingness across all families was constant at 50%. See introduce_missingness.py for implementation.
Evaluation of other measures of robustness and accuracy
Using the simulation results, we evaluated the effect of increasing the sample size (or the number of families being sampled in each iteration when running SOLARStrap). We hypothesized that as the number of families approaches the number of available families the heritability estimate of SOLARStrap would converge to the heritability estimate of SOLAR. We expected that the number of families sampled would not have an effect on the heritability estimate produced by SOLAR or SOLARStrap. We evaluated this relationship using linear regression of the simulation results. One of the primary quality control metrics for SOLARStrap is the Proportion of Significant Attempts (or POSA). We evaluated the relationship between the POSA score (which ranges from 0 to 1) and the accuracy of the heritability estimates produced.
Preparation of clinical data for release
Due to institutional restrictions, we cannot release the exact data as it was used in our analysis. However, we are sensitive to issues regarding reproducibility and replicability. Therefore, we have modified the dataset according to the rules of Safe Harbor as provided by the U.S. Department of Health and Human Services. The processing of the data for release was performed as described above (see Preparation of data for analysis on external computing clusters). However, in this case, we took three additional precautions beyond what is required for Safe Harbor since these data will be made completely public. First, we did not release data for any conditions where there are less than 1,000 individuals. Second, we did not release data for families with unique family structures. Data was only released for family structures with at least 100 families. We did not release race and ethnicity data where less than 20 individuals are reported in a single category. These additional precautions protect against identification through unique familial relationships situations. Third, we generated a new random map of patient identifiers for every individual trait. This precaution protects against the identification of an individual by looking for unique combinations of diseases. Unfortunately, this also will preclude the possibility of comorbidity analysis. Even with these additional limitations, our dataset constitutes one of the largest public releases of clinical data in history. All aggregate data and their corresponding statistics were released without obfuscation.
Literature review of related heritability estimates
For validation purposes, we compared our heritability estimates to the ones reported in the most recent meta-analysis of twin correlations and heritability (MaTCH) (Polderman et al., 2015). Using the ICD-10 hierarchy, we grouped our ICD codes to match the main chapters and subchapters reported in the MaTCH database. Since the meta-analysis grouped all traits into higher level traits, losing a lot of granularity, we also performed a literature review on heritability estimates on 128 traits. We started by analyzing studies that were included in the table available at http://www.snpedia.com/index.php/Heritability (accessed on March 2016). In total, we reviewed heritability estimates with confidence intervals from 61 published reports.
Additionally, we compared our heritability estimates to the ones reported using the UK Biobank dataset. (Ge et al., 2017) We used the estimates reported with ICD 10 codes to match the heritability estimates reported by Ge et al. to our estimates. Overall, we observed that the estimates from the UK biobank were significantly lower than the ones computed using EHR data (Figure S4). We also compared the heritability estimates from this set of traits to the MaTCH database. Table S7 contains the traits along with heritability estimates from the UK Biobank, the MaTCH database, and our estimates using EHR data.
QUANTIFICATION AND STATISTICAL ANALYSIS
All statistical details are included in the main text, Figures or Figure legends. Statistical analysis, data preparation, and figure creation were performed using Python 2.7. The python system environment is described fully in the supplemental materials. Relationship inferences were implemented in Julia 0.4.3. All correlations are reported as Pearson correlation coefficients unless otherwise noted. All code for RIFTEHR and SOLARStrap is available on the supporting website: http://riftehr.tatonettilab.org/.
DATA AND SOFTWARE AVAILABILITY
All code for RIFTEHR and SOLARStrap, and heritability estimates are available through a web interface and to download at http://riftehr.tatonettilab.org, https://github.com/tatonetti-lab/riftehr, and https://github.com/tatonetti-lab/h2o.
We released data from both Columbia and Weill Cornell. We identified 8,223 and 3,101 unique family structures at Columbia and Weill Cornell, respectively, that were not released due to privacy concerns. We released data from a total of 63 and 50 distinct family structures and 202,960 and 146,092 families from Columbia and Weill Cornell, respectively. All data are available at http://riftehr.tatonettilab.org and http://dx.doi.org/10.17632/j8239bz4n5.1.
Supplementary Material
Fig. S1. SOLAR error versus SOLARStrap variance. The error estimate from SOLAR is significantly correlated to the sampling variance of the heritability estimates (r=0.63, p=3.3e-10). Related to Figure 3.
Figure S2. Heritability estimates from ACE (household effect) and AE (without household effect) models are significantly correlated. The statistically significant point estimates (p < 0.05) are reported in red. Related to Figure 4.
Figure S3. Correlation between the estimates stratified by race and ethnicity and the overall heritability estimates using the ACE model. Related to Figure 4.
Figure S4. Correlation between observational heritability from (A) AE and (B) ACE models and the heritability estimates from the UK Biobank. Related to Figure 4.
Table S1. Relationships by degree. Related to Figure 1.
Table S2. Comparison between observational heritability (ho2) and heritability estimates (h2) previously reported in the literature. Among the 33 traits, 16 (48%) have overlapping confidence intervals, highlighted with a star (*). Related to Figure 4.
Table S3. Distribution of relationship types among families with cystic fibrosis and sickle cell disease. Related to Figure 4.
Table S4. Performance by number of paths and by matched path. Related to STAR Methods (see Evaluation using the EHR’s mother-baby linkage).
Table S5. Relationship inference rules. Related to STAR Methods (see Inferring familial relationships).
Table S6. Eighty-five curated phenotypes. Related to STAR Methods (see Phenotyping in the EHR).
Table S7. Comparison of heritability estimates from the UK Biobank, the MaTCH database and observational heritability. Related to STAR Methods (see Literature review of related heritability estimates).
Highlights.
Emergency contact information used to identify 7.4 million familial relationships.
Familial relationships were validated using clinical and genetic data.
Estimated heritability for 500 traits using only medical records data.
Heritability estimates were concordant across study sites and with the literature.
Acknowledgments
F.C.G.P., S.B., and D.K.V. are supported by AHRQ R01HS021816. K.Q., R.V., A.Y., and N.P.T. are supported by NIGMIS R01GM107145. K.K. is supported by NIDDK R01DK105124. R.V., K.K., and N.P.T. are supported by the Herbert Irving Scholars Award. R.V. and N.P.T. are supported by NCATS OT3TR002027. I.I. is supported by NIH R01MH106910 and NIH R01MH095797. G.H. is supported by NLM R01LM006910. G.H. and K.K. are supported by NHGRI U01HG008680. This research was supported by the AWS Cloud Credits for Research program. This research also uses resources from the Open Science Grid, which is supported by the National Science Foundation and the U.S. Department of Energy’s Office of Science. Collection of genetic samples was supported by AHRQ R01HS022961.
Footnotes
Publisher's Disclaimer: This is a PDF file of an unedited manuscript that has been accepted for publication. As a service to our customers we are providing this early version of the manuscript. The manuscript will undergo copyediting, typesetting, and review of the resulting proof before it is published in its final citable form. Please note that during the production process errors may be discovered which could affect the content, and all legal disclaimers that apply to the journal pertain.
Electronic health records can be mined for familial relationships that provide distinct insights into heritabillity of human disease.
Author Contributions
Conceptualization, F.C.G.P., R.V., K.K., D.K.V., and N.P.T.; Methodology, F.C.G.P., R.V., K.K., D.K.V., and N.P.T.; Software, F.C.G.P., R.V., A.Y., M.M.S., and N.P.T.; Validation, F.C.G.P., R.V., K.Q., G.M.B., H.S., L.L., M.M.S., P.G., I.I., M.S., G.H., S.B., D.G., K.K., E.E.K., J.D., D.K.V., and N.P.T.; Formal Analysis, F.C.G.P., R.V., K.Q., G.M.B., A.Y., M.M.S., K.K., D.K.V., and N.P.T.; Resources, G.H., S.B., D.G., E.E.K., J.D., D.K.V., and N.P.T.; Data Curation, F.C.G.P. and N.P.T.; Writing – Original Draft, F.C.G.P., R.V., K.Q., D.K.V., and N.P.T; Writing – Review & Editing, F.C.G.P., R.V., K.Q., G.M.B., A.Y., H.S., T.L., V.N., L.L., M.M.S., P.G., I.I., M.S., G.H., S.B., D.G., K.K., E.E.K., J.D., D.K.V., and N.P.T.; Visualization, F.C.G.P., T.L., V.N., D.K.V., and N.P.T.; Supervision, D.K.V. and N.P.T; Funding Acquisition, E.E.K., J.D., D.K.V., and N.P.T.
Declaration of Interests
The authors declare no competing interests.
References and Notes
- Almasy L, Blangero J. Multipoint quantitative-trait linkage analysis in general pedigrees. American Journal of Human Genetics. 1998;62:1198–1211. doi: 10.1086/301844. [DOI] [PMC free article] [PubMed] [Google Scholar]
- Aronson SJ, Rehm HL. Building the foundation for genomics in precision medicine. Nature. 2015;526:336–342. doi: 10.1038/nature15816. [DOI] [PMC free article] [PubMed] [Google Scholar]
- Bederson JB, Awad IA, Wiebers DO, Piepgras D, Haley EC, Brott T, Hademenos G, Chyatte D, Rosenwasser R, Caroselli C. Recommendations for the management of patients with unruptured intracranial aneurysms - A statement for healthcare professionals from the Stroke Council of the American Heart Association. Circulation. 2000;102:2300–2308. doi: 10.1161/01.cir.102.18.2300. [DOI] [PubMed] [Google Scholar]
- Birkhead GS, Klompas M, Shah NR. Uses of electronic health records for public health surveillance to advance public health. Annu Rev Public Health. 2015;36:345–359. doi: 10.1146/annurev-publhealth-031914-122747. [DOI] [PubMed] [Google Scholar]
- Boland MR, Shahn Z, Madigan D, Hripcsak G, Tatonetti NP. Birth month affects lifetime disease risk: a phenome-wide method. Journal of the American Medical Informatics Association : JAMIA. 2015;22:1042–1053. doi: 10.1093/jamia/ocv046. [DOI] [PMC free article] [PubMed] [Google Scholar]
- Bronfenbrenner U, Ceci SJ. Nature-nurture reconceptualized in developmental perspective: a bioecological model. Psychol Rev. 1994;101:568–586. doi: 10.1037/0033-295x.101.4.568. [DOI] [PubMed] [Google Scholar]
- Castellani C, Picci L, Tamanini A, Girardi P, Rizzotti P, Assael BM. Association between carrier screening and incidence of cystic fibrosis. Jama. 2009;302:2573–2579. doi: 10.1001/jama.2009.1758. [DOI] [PubMed] [Google Scholar]
- Chatterjee N, Shi J, García-Closas M. Developing and evaluating polygenic risk prediction models for stratified disease prevention. Nature Reviews Genetics. 2016;17:392–406. doi: 10.1038/nrg.2016.27. [DOI] [PMC free article] [PubMed] [Google Scholar]
- Dupuis A, Hamilton D, Cole DEC, Corey M. Cystic Fibrosis Birth Rates in Canada: A Decreasing Trend since the Onset of Genetic Testing. The Journal of Pediatrics. 2005;147:312–315. doi: 10.1016/j.jpeds.2005.06.043. [DOI] [PubMed] [Google Scholar]
- Ge T, Chen CY, Neale BM, Sabuncu MR, Smoller JW. Phenome-wide heritability analysis of the UK Biobank. PLoS Genet. 2017;13:e1006711–e1006721. doi: 10.1371/journal.pgen.1006711. [DOI] [PMC free article] [PubMed] [Google Scholar]
- Guttmacher AE, Collins FS, Carmona RH. The family history–more important than ever. N Engl J Med. 2004;351:2333–2336. doi: 10.1056/NEJMsb042979. [DOI] [PubMed] [Google Scholar]
- Harden KP, Turkheimer E, Loehlin JC. Genotype by environment interaction in adolescents’ cognitive aptitude. Behav Genet. 2007;37:273–283. doi: 10.1007/s10519-006-9113-4. [DOI] [PMC free article] [PubMed] [Google Scholar]
- Hripcsak G, Albers DJ. Next-generation phenotyping of electronic health records. Journal of the American Medical Informatics Association : JAMIA. 2013;20:117–121. doi: 10.1136/amiajnl-2012-001145. [DOI] [PMC free article] [PubMed] [Google Scholar]
- Hripcsak G, Ryan PB, Duke JD, Shah NH, Park RW, Huser V, Suchard MA, Schuemie MJ, DeFalco FJ, Perotte A, et al. Characterizing treatment pathways at scale using the OHDSI network. Proc Natl Acad Sci USA. 2016;113:7329–7336. doi: 10.1073/pnas.1510502113. [DOI] [PMC free article] [PubMed] [Google Scholar]
- Kaplan RM, Chambers DA, Glasgow RE. Big Data and Large Sample Size: A Cautionary Note on the Potential for Bias. Clinical and Translational Science. 2014;7:342–346. doi: 10.1111/cts.12178. [DOI] [PMC free article] [PubMed] [Google Scholar]
- Lorberbaum T, Sampson KJ, Woosley RL, Kass RS, Tatonetti NP. An Integrative Data Science Pipeline to Identify Novel Drug Interactions that Prolong the QT Interval. Drug Saf. 2016;39:433–441. doi: 10.1007/s40264-016-0393-1. [DOI] [PMC free article] [PubMed] [Google Scholar]
- Mayer J, Kitchner T, Ye Z, Zhou Z, He M, Schrodi SJ, Hebbring SJ. Use of an electronic medical record to create the marshfield clinic twin/multiple birth cohort. Genet Epidemiol. 2014;38:692–698. doi: 10.1002/gepi.21855. [DOI] [PMC free article] [PubMed] [Google Scholar]
- Mucci LA, Hjelmborg JB, Harris JR, Czene K, Havelick DJ, Scheike T, Graff RE, Holst K, Möller S, Unger RH, et al. Familial Risk and Heritability of Cancer Among Twins in Nordic Countries. Jama. 2016;315:68–69. doi: 10.1001/jama.2015.17703. [DOI] [PMC free article] [PubMed] [Google Scholar]
- Pietiläinen KH, Söderlund S, Rissanen A, Nakanishi S, Jauhiainen M, Taskinen MR, Kaprio J. HDL subspecies in young adult twins: heritability and impact of overweight. Obesity (Silver Spring) 2009;17:1208–1214. doi: 10.1038/oby.2008.675. [DOI] [PubMed] [Google Scholar]
- Polderman TJC, Benyamin B, de Leeuw CA, Sullivan PF, van Bochoven A, Visscher PM, Posthuma D. Meta-analysis of the heritability of human traits based on fifty years of twin studies. Nature Publishing Group. 2015;47:702–709. doi: 10.1038/ng.3285. [DOI] [PubMed] [Google Scholar]
- Polubriaginof F, Tatonetti NP, Vawdrey DK. An Assessment of Family History Information Captured in an Electronic Health Record. AMIA Annu Symp Proc. 2015;2015:2035–2042. [PMC free article] [PubMed] [Google Scholar]
- Pordes R, Petravick D, Kramer B, Olson D, Livny M, Roy A, Avery P, Blackburn K, Wenaus T, Würthwein F, et al. The open science grid. J Phys: Conf Ser. 2007;78:012057. [Google Scholar]
- Purcell S, Neale B, Todd-Brown K, Thomas L, Ferreira MAR, Bender D, Maller J, Sklar P, de Bakker PIW, Daly MJ, et al. PLINK: A Tool Set for Whole-Genome Association and Population-Based Linkage Analyses. The American Journal of Human Genetics. 2007;81:559–575. doi: 10.1086/519795. [DOI] [PMC free article] [PubMed] [Google Scholar]
- Ritchie MD, de Andrade M, Kuivaniemi H. The foundation of precision medicine: integration of electronic health records with genomics through basic, clinical, and translational research. Front Genet. 2015;6:104. doi: 10.3389/fgene.2015.00104. [DOI] [PMC free article] [PubMed] [Google Scholar]
- Scotet V, Duguépéroux I, Saliou P, Rault G, Roussey M, Audrézet MP, Férec C. Evidence for decline in the incidence of cystic fibrosis: a 35-year observational study in Brittany, France. Orphanet Journal of Rare Diseases. 2012;7:14. doi: 10.1186/1750-1172-7-14. [DOI] [PMC free article] [PubMed] [Google Scholar]
- Sfiligoi I, Bradley DC, Holzman B, Mhashilkar P, Padhi S, Würthwein F. The Pilot Way to Grid Resources Using glideinWMS (IEEE) 2009 [Google Scholar]
- Slieker MG, Uiterwaal CSPM, Sinaasappel M, Heijerman HGM, van der Laag J, van der Ent CK. Birth Prevalence and Survival in Cystic Fibrosis: A National Cohort Study in the Netherlands. Chest. 2005;128:2309–2315. doi: 10.1378/chest.128.4.2309. [DOI] [PubMed] [Google Scholar]
- Souren NY, Paulussen ADC, Loos RJF, Gielen M, Beunen G, Fagard R, Derom C, Vlietinck R, Zeegers MP. Anthropometry, carbohydrate and lipid metabolism in the East Flanders Prospective Twin Survey: heritabilities. Diabetologia. 2007;50:2107–2116. doi: 10.1007/s00125-007-0784-z. [DOI] [PMC free article] [PubMed] [Google Scholar]
- Suarez R. Breaching Doctor-Patient Confidentiality: Confusion among Physicians about Involuntary Disclosure of Genetic Information. S Cal Interdisc LJ 2011 [Google Scholar]
- Tatonetti NP, Ye PP, Daneshjou R, Altman RB. Data-driven prediction of drug effects and interactions. Sci Transl Med. 2012;4:125ra31–125ra31. doi: 10.1126/scitranslmed.3003377. [DOI] [PMC free article] [PubMed] [Google Scholar]
- Tenesa A, Haley CS. The heritability of human disease: estimation, uses and abuses. Nature Reviews Genetics. 2013;14:139–149. doi: 10.1038/nrg3377. [DOI] [PubMed] [Google Scholar]
- Turkheimer E, Haley A, Waldron M, D’Onofrio B, Gottesman II. Socioeconomic status modifies heritability of IQ in young children. Psychol Sci. 2003;14:623–628. doi: 10.1046/j.0956-7976.2003.psci_1475.x. [DOI] [PubMed] [Google Scholar]
- United States. Health Insurance Portability and Accountability Act of 1996. Public Law. 1996:104–191. [PubMed] [Google Scholar]
- Visscher PM, Hill WG, Wray NR. Heritability in the genomics era–concepts and misconceptions. Nature Reviews Genetics. 2008;9:255–266. doi: 10.1038/nrg2322. [DOI] [PubMed] [Google Scholar]
- Wei WQ, Denny JC. Extracting research-quality phenotypes from electronic health records to support precision medicine. Genome Med. 2015;7:41. doi: 10.1186/s13073-015-0166-y. [DOI] [PMC free article] [PubMed] [Google Scholar]
- Weiskopf NG, Weng C. Methods and dimensions of electronic health record data quality assessment: enabling reuse for clinical research. Journal of the American Medical Informatics Association. 2013;20:144–151. doi: 10.1136/amiajnl-2011-000681. [DOI] [PMC free article] [PubMed] [Google Scholar]
Associated Data
This section collects any data citations, data availability statements, or supplementary materials included in this article.
Supplementary Materials
Fig. S1. SOLAR error versus SOLARStrap variance. The error estimate from SOLAR is significantly correlated to the sampling variance of the heritability estimates (r=0.63, p=3.3e-10). Related to Figure 3.
Figure S2. Heritability estimates from ACE (household effect) and AE (without household effect) models are significantly correlated. The statistically significant point estimates (p < 0.05) are reported in red. Related to Figure 4.
Figure S3. Correlation between the estimates stratified by race and ethnicity and the overall heritability estimates using the ACE model. Related to Figure 4.
Figure S4. Correlation between observational heritability from (A) AE and (B) ACE models and the heritability estimates from the UK Biobank. Related to Figure 4.
Table S1. Relationships by degree. Related to Figure 1.
Table S2. Comparison between observational heritability (ho2) and heritability estimates (h2) previously reported in the literature. Among the 33 traits, 16 (48%) have overlapping confidence intervals, highlighted with a star (*). Related to Figure 4.
Table S3. Distribution of relationship types among families with cystic fibrosis and sickle cell disease. Related to Figure 4.
Table S4. Performance by number of paths and by matched path. Related to STAR Methods (see Evaluation using the EHR’s mother-baby linkage).
Table S5. Relationship inference rules. Related to STAR Methods (see Inferring familial relationships).
Table S6. Eighty-five curated phenotypes. Related to STAR Methods (see Phenotyping in the EHR).
Table S7. Comparison of heritability estimates from the UK Biobank, the MaTCH database and observational heritability. Related to STAR Methods (see Literature review of related heritability estimates).