

Abstract
There is a long history of examining the impacts of nutrient pollution and pH on coral reefs. However, little is known about how these two stressors interact and influence coral reef ecosystem functioning. Using a six-week nutrient addition experiment, we measured the impact of elevated nitrate (NO−3) and phosphate (PO3−4) on net community calcification (NCC) and net community production (NCP) rates of individual taxa and combined reef communities. Our study had four major outcomes: (i) NCC rates declined in response to nutrient addition in all substrate types, (ii) the mixed community switched from net calcification to net dissolution under medium and high nutrient conditions, (iii) nutrients augmented pH variability through modified photosynthesis and respiration rates, and (iv) nutrients disrupted the relationship between NCC and aragonite saturation state documented in ambient conditions. These results indicate that the negative effect of NO−3 and PO3−4 addition on reef calcification is likely both a direct physiological response to nutrients and also an indirect response to a shifting pH environment from altered NCP rates. Here, we show that nutrient pollution could make reefs more vulnerable to global changes associated with ocean acidification and accelerate the predicted shift from net accretion to net erosion.
Keywords: nutrient pollution, coral reefs, pH, biological feedbacks
1. Introduction
Coral reefs provide critical ecosystem services including shoreline protection and food security to coastal communities worldwide [1]. The maintenance of these services depends on a balance between coral reef growth (accretion) and reef breakdown (bioerosion and dissolution), where accretion must be greater than erosion for reef persistence. Corals and other calcifiers build the three-dimensional framework of coral reefs, while bioeroders naturally breakdown the reef framework. Together, calcifiers and bioeroders are key biological drivers of the accretion-erosion balance, and their sensitivities to global and local stressors threaten to shift the balance in favour of net erosion [2]. Global stressors, such as ocean acidification and rising sea surface temperatures, can slow reef accretion [3], cause massive bleaching events [4], and increase bioerosion and dissolution rates [5–11]. Local stressors, such as chronic nutrient loading of coastal waters, can destabilize reefs by shifting competitive dominance away from corals and other calcifiers towards fleshy algae, and also by increasing bioerosion rates through enhanced growth of bioeroding invertebrates and endoliths [12–15]. Further, local and global stressors can interact and have compounding negative effects on net reef growth. A field study demonstrated that the positive relationship between ocean acidification and bioerosion was enhanced at nutrient-rich sites throughout the Pacific [16]. Because nutrient pollution and ocean acidification are growing and chronic threats for coral reefs [3,17], it is necessary to understand how nutrients and pH interact to influence key ecosystem functions.
While nutrient pollution is a prevailing stressor on coral reefs [13], reef organisms evolved under nutrient-limitation [18], and, consequently, some corals increase their growth rates with slight increases in nutrients. For example, Porites lobata exposed to nutrient-rich submarine groundwater discharge (SGD) had faster growth rates than corals further away from the SGD seeps [19]. In both laboratory and field manipulations, Acropora muricata and Acropora longicyathus had enhanced growth when exposed to higher phosphorous concentrations relative to a control [20,21]. Excess nutrients, however, can be devastating to coral reefs [13]. Eutrophic conditions can reduce growth rates in many coral species [13] by increasing competition between endosymbionts and the coral host [22,23]. Nutrients can also increase bioerosion rates [12,24–28], increase sediment dissolution [29], decrease rhodolith growth rates [21] and increase the growth rates of several fleshy macroalgal species [15,30,31] resulting in direct competition with, or overgrowth of, corals. These studies highlight the need to examine the impacts of nutrient addition on multiple reef constituents at ecologically relevant nutrient concentrations for coral reefs.
In addition to directly influencing the growth and physiology of reef constituents, nutrients can indirectly impact net reef accretion by altering the pH environment and, thus, aragonite saturation state (Ωarag) via augmented photosynthesis and respiration rates. Photosynthesis and respiration have opposing effects on pH (and Ωarag), increasing and decreasing it, respectively, by changing the concentration of CO2 in the water column (figure 1). On coral reefs, local pH variability has been linked to the diurnal cycling of photosynthesis and respiration [32–39], and field studies have shown that nutrient addition can augment photosynthesis and respiration and, thus, pH and pCO2 variability, on reefs [40]. Community composition and species interactions can also mediate pH variability and, thus, the overall impact of nutrients on net reef growth as individual organisms can have vastly different contributions to local pH variability on coral reefs [35,41]. Given the well-documented sensitivity of calcification, bioerosion and dissolution rates to changes in pH and Ωarag [6–8,11,16,42–45], augmented pH and Ωarag variability or shifts in community composition in response to nutrient pollution may exacerbate the negative effects of ocean acidification and other stressors on net reef growth. Therefore, nutrient pollution has the potential to severely undermine ecosystem functioning on coral reefs.
Figure 1.
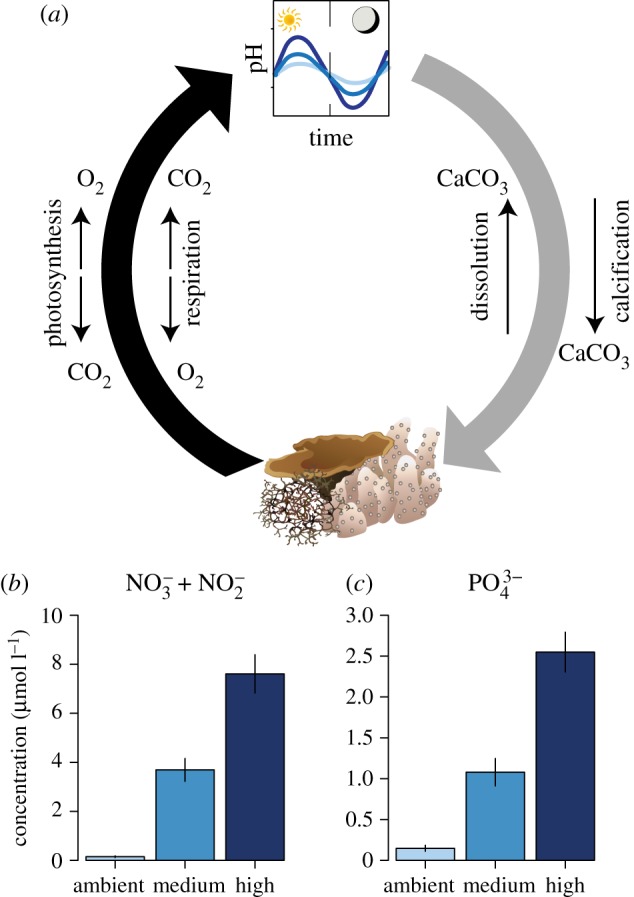
(a) Conceptual diagram highlighting a biological feedback loop on coral reefs in response to nutrient addition, and (b) NO−3 + NO−2 and (c) PO3−4 concentrations used in this experiment. Reef constituents photosynthesize and respire, modifying the local pH environment through uptake and release of CO2. Changes in pH can in turn influence calcification and dissolution rates on coral reefs, where calcification decreases and dissolution increases with ocean acidity. Nutrient pollution can alter this biological feedback loop by enhancing or depressing photosynthesis and respiration. Subsets (b) and (c) show the means ± s.e. (n = 14) for NO−3 + NO−2 and PO3−4, respectively, from the header tanks over the two 24 h water sampling events. NO−3 and PO3−4 were elevated in concert in each of the three treatments. Drawings of reef organisms are Courtesy of the Integration and Application Network, University of Maryland Center for Environmental Science (ian.umces.edu/symbols/).
In this study, we assess both the direct and indirect effects of nutrients on net reef growth of individual reef constituents and mixed communities. Using an outdoor mesocosm facility, we exposed four common coral reef constituents (live coral, dead coral rubble, carbonate sand and macroalgae) to combined elevated nitrate (NO−3) and phosphate (PO3−4) treatments (ambient, medium and high) continuously for six weeks in Kāne‘ohe Bay, Hawai‘i. Subsequently, in a pair of 24 h metabolism experiments, we measured diel changes in NCC, NCP and pH for all individual reef constituents and combinations of the taxa. Our specific goals were to test the direct impact of nutrient addition on community metabolic rates and investigate if nutrients indirectly mediate biological feedbacks between pH and community metabolism. This study addresses potential mechanisms that may drive shifts from net accretion to net erosion in response to nutrient pollution—one of the top threats to coastal reefs worldwide [17].
2. Material and methods
(a). Sample collection
Coral, rubble, macroalgae and carbonate sand samples were collected from the fringing reef of Coconut Island at the Hawai‘i Institute of Marine Biology (21.435°, −157.787°) between 12 and 16 October 2015. NO−3+NO−2 and PO3−4 range from 0.02 to 2.07 and 0–0.372 μmol l−1, respectively, at the collection site [6]. We prepared 36 clonal coral fragments (nubbins) from each of three individual colonies of the two dominant coral species in Kāne‘ohe Bay, Hawai‘i (Porites compressa and Montipora caiptata) from the fringing reef on the southwest side of Coconut Island. Thirty-six rubble fragments were prepared from dead P. compressa skeletons collected from the same area as the live coral. Macroalgae (Gracilaria salicorni), and sand were collected from a low energy, sandy reef flat on the northwest side of Coconut Island in less than 1 m depth, where G. salicornia is abundant and lives unattached to the substrate. Coral and rubble were buoyant weighted and macroalgae was wet weighted prior to the start of the experiment. At the end of the six weeks of exposure (described below), each set of coral nubbins and the rubble were buoyant weighed for a final time (algae were wet weighed). All samples were assessed for dry weight (oven dried at 60°C for at least 48 h) and ash free dry weight (weight lost during ashing in a muffle furnace at 500°C for 4 h). We calculated ash free dry weight (=dry weight − ash weight) as a measure of organic content for each sample. For detailed collection methods, see the electronic supplementary material and Quinlan et al. [46].
(b). Experimental set-up
The experiment took place in an outdoor mesocosm facility and was comprised of 36 6-l polycarbonate aquaria divided between three 1300 l incubation tanks (12 aquaria per tank) that were used to maintain constant temperature. Incubation tanks were outfitted with HOBO Pendant (Onset Computer Corp., Bourne, MA) loggers to monitor temperature and light intensity every 15 min (electronic supplementary material, figure S1). Light intensity was converted from luminous flux (LUX) to photosynthetically active radiation (PAR) following methods by Long et al. [47]. The tanks were shaded to approximately 60% full irradiance and average total PAR for the three incubation tanks were 289 ± 375, 243 ± 333 and 273 ± 355 μmol m−2 S−1 (mean ± s.d.) across the six-week period. One of 12 treatments was assigned to each of the 12 aquaria in each incubation tank: nutrient level (ambient, medium and high) × substrate (coral, algae, rubble and sand), for a randomized complete block design with a single replicate aquarium in each of the three incubation tank blocks (electronic supplementary material, figure S2). Each aquarium held four samples of the assigned substrate, i.e. four sets of coral nubbins, four baskets of rubble, four baskets of algae or four Petri dishes of sand were included in any one aquarium. Each experimental aquarium had a drain to hold the water level constant at 5 l and contained a Rio plus 50 aqua pump (320 l h−1) to ensure that the water within the aquarium was well mixed.
Incoming seawater from the collection site was filtered through a sand filter followed by a 20 μm filter before entering our experimental aquaria. The nutrient concentrations were maintained by mixing source water from Kāne‘ohe Bay with a concentrated nutrient mix in a 20 l pre-cleaned carboy every other day. The nutrient mix was a frozen stock containing a ratio of 3 : 1 potassium nitrate : potassium phosphate and was stored at ambient temperatures in the dark. A 3 : 1 molar ratio was chosen because it is the average dissolved inorganic nitrate to dissolved inorganic phosphorous ratio found throughout the Hawaiian Archipelago [48]. Both the source water and the nutrient mixture were pumped and pre-mixed into separate aquaria (hereafter called header aquaria) using multi-channel peristaltic pumps before entering the experimental aquaria. Each header aquaria contained a Rio plus 90 aqua pump (320 l h−1) to ensure that the nutrients were mixed into solution. The nutrients were pumped through platinum cured silica tubes resulting in a residence time of approximately 2 h and 6 h in the header and experimental aquaria, respectively. Three nutrient concentrations were maintained throughout a six-week acclimation period: ambient (0.15 ± 0.03 s.e. μmol l−1 NO−3 + NO−2 and 0.15 ± 0.03 s.e. μmol l−1 PO3−4), medium (3.6 ± 0.46 s.e. μmol l−1 NO−3 + NO−2 and 1.08 ± 0.17 s.e. μmol l−1 PO3−4) and high (7.61 ± 0.78 s.e. μmol l−1 NO−3+NO−2 and 2.6 ± 0.24 s.e. μmol l−1 PO3−4). These concentrations represent the ambient nutrient concentration for Kāne‘ohe Bay (ambient), 97% percentile (medium) and maximum (high) nutrient concentrations from monitored reefs sites throughout the Pacific (electronic supplementary material, figure S3).
To avoid fouling, aquaria were exchanged and cleaned twice each week: incoming water and the aquarium pump were disconnected; coral, algae, rubble or sand samples were removed; water from the old aquarium was poured into the clean aquarium; samples were replaced; and the aquarium pump and incoming water were reconnected. Whenever aquaria were exchanged, aquaria positions were shuffled within each tank to avoid any systematic effects of light or temperature variation within the tank. To avoid systematic differences between tanks, aquaria (as a block) were rotated between tanks every two weeks; i.e. all aquaria in Tank A were moved to Tank B, aquaria in Tank B were moved to C, and all in C moved to A. Nutrient samples were collected every two weeks throughout the experiment in all experimental and header aquaria to ensure that the nutrient conditions were maintained for the six-week acclimation period.
(c). Metabolism experiments
We determined the effect of nutrients on community metabolism by coral, algae, rubble and sand individually and combined over two sequential 24 h sampling events. At the end of the six-week acclimation period, we sampled community metabolism of the separate reef constituents every 4 h for 24 h (10:00, 14:00, 18:00, 22:00, 02:00, 06:00, 10:00). Immediately following this experiment, the four replicate substrates in each aquarium were divided into mixed communities such that each aquarium had one replicate of each substrate type. Nutrient treatments and block identity were maintained, resulting in four replicate mixed communities at each nutrient level in each incubation tank. After a 24 h acclimation period, a second 24 h sampling event was conducted on the mixed communities. During each sampling event, we collected water samples for total alkalinity (AT) and nutrients (NO−3 + NO−2, PO3−4), and took discrete temperature and pH measurements in situ with sensors every 4 h over a 24 h period in all header and experimental aquaria.
(i). pH and temperature
pH measurements were taken with an Orion ROSS Ultra pH/ATC Triode glass electrode in situ in millivolt. The pH electrode was calibrated against a Tris buffer of known pH from Andrew Dickson's laboratory at the Scripps Institution of Oceanography following Dickson SOP6a [49]. pH was calculated on the total scale (pHTot) using a multi-point calibration from millivolt and temperature measured on a traceable digital thermometer (5-077-8, accuracy = 0.05°C, resolution = 0.001°C; Control Company, Friendswood, TX, USA).
(ii). AT and nutrients
All water samples were collected in acid washed bottles, each rinsed three times with sample water. AT samples were collected in 250 ml Nalgene bottles and immediately preserved with 100 μl of 50% saturated HgCl2. AT was analysed using open cell potentiometric titrations on a Mettler T50 autotitrator [49]. A certified reference material (CRM, Reference Material for Oceanic CO2 Measurements, A. Dickson, Scripps Institution of Oceanography) was run at the beginning of each sample set. The accuracy of the titrator was always less than 1% off from the standard. Nutrient samples were collected in 60 ml plastic syringes, filtered through pre-combusted GF/F (0.7 μm) filters, transferred into 50 ml plastic centrifuge tubes and frozen until analysis. Nutrient samples were processed on a Seal Analytical AA3 HR Nutrient Analyzer at the UH SOEST Lab for Analytical Chemistry for NO−3+NO−2 (detection limit = 0.009 and coefficient of variation=0.3%) and PO3−4 (detection limit = 0.009 and coefficient of variation = 0.2%). A strategic subset of nutrient samples were analysed to reduce costs (all header tank samples and one set of each nutrient treatment × reef constituent × day/night sample in the experimental aquaria were analysed).
(iii). Metabolic calculations
We used the total alkalinity anomaly technique to calculate net community calcification (NCC) and net community production (NCP) rates for individual reef constituents and mixed reef communities. NCC is the sum of all calcification and dissolution processes and the rates (μmol CaCO3 g−1 h−1) were calculated using the following equation:
| 2.1 |
ΔAT (μmol kg−1) is the difference in AT between the header and experimental aquaria, V (cm3) is the volume of water in the experimental aquaria, σ is the density of seawater (1.023 g cm−3), t (h) is the residence time of the experimental aquaria, and m (g) is the organic biomass of the samples. ΔAT was divided by 2 because 1 mol of CaCO3 is produced for every 2 mols of AT. AT was corrected for dissolved inorganic nitrogen and phosphate by subtracting [NO−3] and [PO3−4] uptake (i.e. concentration in header-experimental aquaria) at a 1 : 1 and 1 : 2 molar ratio, respectively, from the AT anomaly [50]. NCC rates were then divided by 1000 to yield rates in units μmol CaCO3 g−1 h−1. NCC rates were averaged across daylight hours (daytime NCC), dark hours (nighttime NCC) and over the entire 24 h cycle (net NCC) to obtain daytime calcification, nighttime calcification, and net calcification rates over 24 h, respectively, in each aquaria. ΔAT ranged from 0.008 to 115.87 μmol kg−1 in a 4 h period across all aquaria.
NCP is the sum of gross production and respiration and NCP rates (μmol C g−1 h−1) were calculated using the following equation:
| 2.2 |
ΔDIC is the difference in dissolved inorganic carbon (μmol kg−1) between the header and experimental aquaria. DIC was calculated from AT and pH using seacarb [51]; uncertainty in calculating DIC from AT and pH is approximately 3.6% [52]. NCP rates were averaged over the 24 h sampling period to obtain net production rates for each aquaria. Respiration rates (R) were calculated by averaging NCP rates during dark hours, and gross community production (GCP) rates were calculated as R + NCP during daylight hours. During both sampling events, all header and experimental aquaria were temporarily covered with plastic wrap to reduce off-gassing and evaporation; therefore, we assumed FCO2 to be zero.
(d). Data analysis
Linear mixed effects models were used to determine the impact of nutrient addition on (i) community metabolic rates and (ii) biological feedbacks between metabolic rates and pH. Individual models were constructed for each reef community (coral, algae, rubble, sand and mixed) by metabolic rate (daytime NCC, nighttime NCC, net NCC, GCP, R and NCP) with nutrient level as a fixed effect. Sampling time and incubation tank were included as orthogonal random effects to account for repeated measures and potential differences in light and temperature across tanks, respectively. To investigate biological feedbacks, we modelled pH as a function of NCP crossed with both species and nutrients (3-way interaction). Experimental aquarium nested within tank was included as a random effect to account for repeated measures within each aquarium. We also determined whether nutrient addition influenced the relationship between NCC and Ωarag (calculated using seacarb) using an ANCOVA (analysis of co-variance) with experimental aquarium nested within incubation tank as a random effect. Normality and homoscedasticity were assessed by visual inspection of residual plots and all model assumptions were met. All models were analysed using the lme4 package in R [53].
3. Results
(a). Metabolic response
NCC significantly decreased with nutrient addition in all reef constituents and the mixed community for daytime and net rates (figure 2 and electronic supplementary material, table S1). At night, NCC also declined with nutrient additions in all reef constituents, although the effect of nutrients on nighttime NCC in rubble was not statistically significant (figure 2c and electronic supplementary material, table S1). Coral had the most dramatic decline with a 56% decrease in net NCC from the ambient to high nutrient treatment. Algae, rubble and sand switched from net calcifying to net dissolving with increasing nutrients over the 24 h cycle (figure 2 and electronic supplementary material, table S1) and the mixed community was no longer net calcifying (a net NCC rate of −0.05 ± 0.64 mmol g−1 h−1) in the medium and high nutrient treatment. The coral and macroalgae both maintained a positive growth rate, measured via change in dry or wet weight and normalized to organic biomass (electronic supplementary material, figure S4), throughout the six-week incubation period in all treatments. Rubble had a negative growth rate in ambient and medium treatments, but slightly positive in the high treatment (electronic supplementary material, figure S4).
Figure 2.

(a–e) Net community calcification rates and (f–j) net community production rates (μmol g−1 h−1) for coral, algae, rubble, sand and the mixed community. Values are means ± s.e. for samples collected during the day (open triangles), night (closed triangles) and over the 24 h sampling period (closed circles). Significant relationships between nutrients and NCC or NCP (p < 0.05) for daytime, nighttime and net rates are represented with asterisks. Model results for NCC and NCP are in electronic supplementary material, tables S1 and S2, respectively. Dotted line shows when NCC and NCP are equal to zero.
For production rates, GCP increased with nutrient addition in all reef constituents, but was only significant in the coral, sand and mixed community (figure 2 and electronic supplementary material, table S2). Respiration also increased with nutrients in coral, rubble, algae and sand, but was not statistically significant in the mixed community (figure 2 and electronic supplementary material, table S2). The concomitant increase of GCP and R drove NCP to be unaffected by nutrient addition in all reef constituents and the mixed community (figure 2 and electronic supplementary material, table S2).
(b). Biological feedbacks
Overall, there was a strong positive relationship between NCP and pH (F473,1 = 1702, p < 0.001; electronic supplementary material, figure S5 and table S3) as well as significant interactions between NCP and nutrient level (F472,2 = 6.98, p < 0.001) and between NCP and substrate (F472,4 = 58.63, p < 0.001). pH increased during the day and decreased at night in all experimental aquaria as a result of daytime photosynthesis (CO2 absorption) and nighttime respiration (CO2 release; electronic supplementary material, figure S6). Substrate type (F472,4 = 42.35, p < 0.001) and nutrient addition (F472,2 = 4.21, p < 0.02) also affected the pH environment (electronic supplementary material, figure S5 and table S3). Across substrate types, algae had the strongest effect on pH during the day, augmenting pH by 0.1 ± 0.06 (s.e.) relative to the incoming seawater, while coral had the strongest effect at night, decreasing pH by 0.12 ± 0.01 (s.e.) in the ambient treatment (electronic supplementary material, figure S6). Sand had the weakest effect on pH during both day and night (increasing and decreasing by 0.003 ± 0.009 and 0.004 ± 0.007 pH units, respectively). Nutrients substantially amplified pH variance in all substrate types, increasing it by a factor of 1.34 (coral) to 27.5 (sand) between the ambient and high nutrient treatments (electronic supplementary material, figure S6).
Nutrients also disrupted the relationship between Ωarag and NCC. There was a positive relationship between NCC and Ωarag in the ambient treatments for coral, rubble, sand and the mixed community (figure 3 and electronic supplementary material, tables S4–S8). However, nutrient addition significantly weakened this relationship in all reef constituents (i.e. the effect sizes were reduced, but the slope was significantly non-zero), and, in both algae and sand, caused a complete disassociation (i.e. slope was effectively zero) between Ωarag and NCC (figure 3 and electronic supplementary material, tables S4–S8).
Figure 3.

Aragonite saturation state (Ωarag) versus net community calcification (μmol g−1 h−1) for (a) coral, (b) algae, (c) rubble, (d) sand and (e) the mixed community. Lines represent significant relationships between NCC and Ωarag and model results are presented in electronic supplementary material, tables S4–S8.
4. Discussion
The negative effect of nutrients (NO−3 and PO3−4, specifically) on reef calcification is likely both a direct physiological response to nutrients and also an indirect response to a shifting pH environment from altered NCP rates. In our study, NCC decreased and pH variability increased (through augmented photosynthesis and respiration) in response to nutrient addition. We also saw a shift from net calcification to net dissolution in the mixed community (figure 2e) and a decoupling between calcification and Ωarag under elevated nutrient conditions (figure 3). Our results indicate that moderate increases in NO−3 and PO3−4 have the capacity to alter the accretion-erosion balance of coral reefs.
Overall, there was a decline in NCC in all four reef constituents and the mixed community for daytime, nighttime and net rates in response to nutrient addition. Several prior studies have also shown a negative relationship between nutrients and coral calcification in both field [13,40,54] and laboratory experiments [13,22,23,55–57]. For example, in the Caribbean, Porites porites and Montastraea (now Orbicella) annularis calcification decreased significantly under only a 1 μmol l−1 increase in nitrate relative to ambient controls, and calcification greatly decreased (by 25% and 50%, respectively) under highly elevated (20 μmol l−1) nitrate conditions [22]. Increased competition for DIC between the coral host and its endosymbionts under elevated nutrients is a direct mechanism driving lower coral NCC rates [22,58]. Endosymbiont density and daytime production rates both increase in response to elevated nutrients in several coral species [13,22]. Competitive dynamics between photosynthesis and calcification drawing from the same DIC pool will result in one process being enhanced, while the other is suppressed [22]. Here, we also saw a positive effect of nutrients on daytime photosynthesis (figure 2f) coupled with decreased calcification (figure 2a) indicating that competition between the coral and its endosymbionts for DIC could be contributing to the patterns in our study. Conversely, a few studies have shown a positive response of coral growth/calcification to elevated nutrients [19,59,60], albeit conducted on shorter time frames than our experiment (0–10 days versus six-weeks) or from longer-term field experiments (six months) where the apparent nutrient effects could have been confounded by other factors. However, no positive effect of nutrients on calcification (day, night or net) was evident during our six-week experiment.
In the rubble, the decline in NCC in response to nutrient addition (figure 2c) could be due to a combination of increasing bioerosion (or dissolution) and/or decreasing calcification from encrusting algae and invertebrates. Many studies have shown that high bioerosion rates are correlated with high nutrient conditions in the field [16,19,25,61], likely because many bioeroders are filter feeding invertebrates or photosynthetic endoliths. To date, only one controlled laboratory study, focused on the Caribbean excavating sponge Cliona caribbae, has experimentally tested the impacts of nutrient pollution on bioerosion. The authors manipulated labile DOC for one week which subsequently drove increases in NH+4 and PO3−4, but kept NO−3 + NO−2 stable: chemical bioerosion rates, but not total bioerosion (quantified as a change in buoyant weight), increased in their eutrophic treatments relative to controls [62]. Our study used different methods to manipulate nutrients, had a longer exposure time and also focused on a multi-species assemblage (coral rubble). However, we saw a similar increase in chemical dissolution in response to nutrient addition using the total alkalinity anomaly technique (which was likely driven by bioerosion since Ωarag never dropped below 1; figure 2c) and no differences were seen in growth rates (measured via buoyant weight) over the six-week experiment (electronic supplementary material, figure S4). It should be noted, that our rubble community included crustose coralline algae and other epiphytes, which confounds our ability to calculate ‘total’ bioerosion rates (chemical + mechanical), as both the encrusters and bioeroders were likely responding to the nutrient treatments. Still, this is the first study that tests the effect of nutrient addition on an assemblage of bioeroders in a controlled laboratory setting.
For sand, our results align with prior studies that also demonstrate a decrease in NCC in response to nutrient addition. In Mo'orea, French Polynesia, daytime NCC decreased by 16% and 20% (although not significantly) and nighttime dissolution increased by 240% and 250% under elevated (9.8 μmol l−1) and highly elevated (19.7 μmol l−1) nitrate conditions, respectively, relative to ambient [29]. In the current study, we saw a two order of magnitude decrease in net NCC between our ambient and highest nutrient condition. Anaerobic denitrification [63] or sulfate reduction [64] may have added to the AT fluxes in the sediments, but sulfate reduction is unlikely because our sediment was less than 1 cm deep and denitrification would have had minor contributions to the AT anomaly, given the measured changes in AT in the aquaria.
We also saw a decline in Gracilaria NCC across the three nutrient treatments (figure 2b). Gracilaria is not a calcifying macroalgae. Therefore, the small decline in NCC is likely due to calcifying epifauna (such as bryozoans) that settled on the algae throughout the six-week experiment. Gracilaria was included in the study because it is one of the dominant macroalgae in Kāne‘ohe Bay. While the effect of nutrients on NCC in Gracilaria alone is trivial, Gracilaria's presence in the mixed community could be quite important to NCC because of its substantial effect on the local pH environment (electronic supplementary material, figure S6).
While nutrients are known to directly impact calcification rates (as stated above), shifting pH (and Ωarag) in response to altered photosynthetic and respiration rates is also indirectly contributing to the negative relationship between NCC and nutrients. Photosynthesis and respiration rates are the leading metabolic drivers of pCO2 (and hence pH and Ωarag) on coral reefs [34,36–39,65]. In a global meta-analysis, Cyronak et al. [37] documented that pCO2 is increasing over threefold faster on coral reefs than the open ocean from heightened metabolic activity [37] due in large part to local disturbances such as organic matter and nutrient loading from terrestrial run-off [66], SGD [13,67] and surface run-off [13]. Calcification and dissolution rates are highly sensitive to changes in pH [11]; thus, shifts in the photosynthesis or respiration will influence NCC rates (figure 1). In the current study, respiration increased in all four reef constituents while photosynthesis increased only in coral and sand in response to nutrient addition (figure 2). These changes in reef metabolism led to more variable pH environments relative to the incoming seawater (electronic supplementary material, figures S6 and S5), and at night, when pH was low, NCC always decreased. However, the fact that coral calcification decreased during the day, even when pH increased under elevated nutrient conditions (electronic supplementary material, figure S6a), indicates that both direct and indirect processes are impacting NCC rates.
Lastly, nutrient addition weakened the relationship between NCC and Ωarag in all community members and in the mixed community. When nutrients were augmented, calcifiers were unable to capitalize on high Ωarag values. Specifically, in the mixed community, the slope decreased from 2.9 to 0.8 μmol g−1 h−1 per unit Ωarag (a 70% depression) between the ambient and high nutrient treatment (figure 3e; electronic supplementary material, table S8). Further, when Ωarag was equal to 3.3 (a value often used as a tipping point for coral reefs [3]) in the mixed reef community, the calcification was an order of magnitude lower in the high nutrient treatment than in the ambient nutrient treatment. The decoupling of NCC and Ωarag under increasing nutrients indicates that nutrients are altering the natural carbonate dynamics of coral reefs. The nutrient-dependence of the NCC–Ωarag relationship has also been noted under naturally varying NO−3 in the Red Sea [54] and in a flume study focused on Hawaiian corals with elevated NH+4 and PO3−4 (albeit at nutrient concentrations two orders of magnitude higher than the current study [55]). The fact that we saw a shift from net calcification to net dissolution and a weakening of the relationship between NCC and Ωarag at ecologically relevant nutrient concentrations further highlights the sensitivity of the accretion-erosion balance of coral reefs to nutrient pollution.
Notably, there are several other reef constituents not included in this study that could affect accretion-erosion rates (e.g. herbivores, corallivores, etc. [48]). Future studies should examine how the effect of nutrient addition on the accretion-erosion balance could be mediated by higher trophic interactions. In the current study, we show that local anthropogenic stressors, such as nutrient pollution, could make reefs even more vulnerable to global changes in ocean pH and could accelerate the predicted shift from net accretion to net erosion.
Supplementary Material
Supplementary Material
Acknowledgments
We thank R. Gates, T. Oliver, and A. Brown for providing mesocosm space and logistics support, and several others for assistance with experimental maintenance and water sample collections. This is CSUN Marine Biology, SOEST, Sea Grant, and HIMB contribution nos. 270, 10368, UNIHI-SEAGRANT-JC-15-25, and 1730, respectively. We thank T. DeCarlo and three anonymous reviewers for their very helpful comments.
Ethics
Biological collections were conducted under Hawai‘i Department of Land and Natural Resources Division of Aquatic Resources Special Activities Permit 2015-17.
Data accessibility
Data and code are available on GitHub (https://github.com/njsilbiger/Nutrient-pollution-disrupts-key-ecosystem-functions-on-coral-reefs) and Dryad (doi:10.5061/dryad.nm1ns61) [68].
Author's contributions
N.J.S. wrote the paper and analysed the data. N.J.S., H.M.P., K.R., M.J.D. and C.E.N. designed the experiments. N.J.S., M.J.D. and J.K.S. processed water and biological samples. All authors collected the samples, contributed to data interpretation and edited the manuscript.
Competing interests
We declare we have no competing interests.
Funding
This work was supported by funds from National Fish and Wildlife Foundation (44447 to C.E.N.), National Science Foundation (OCE-1538393 to C.E.N., OCE-PRF 1323822 to H.M.P.), and University of Hawai‘i at Mānoa Undergraduate Research Opportunities Program to J.S. and Z.A.Q. This paper is funded in part by a grant/cooperative agreement from the National Oceanic and Atmospheric Administration, Projects A/AS-1 and R/SB-10, which is sponsored by the University of Hawaii Sea Grant College Program under Institutional grant no. NA14OAR4170071 from NOAA Office of Sea Grant, Department of Commerce.
Disclaimer
The views expressed herein are those of the author(s) and do not necessarily reflect the views of NOAA or any of its subagencies.
References
- 1.Moberg F, Folke C. 1999. Ecological goods and services of coral reef ecosystems. Ecol. Econ. 29, 215–233. ( 10.1016/S0921-8009(99)00009-9) [DOI] [Google Scholar]
- 2.Perry C, Murphy G, Kench P, Smithers S, Edinger E, Steneck R, Mumby P. 2013. Caribbean-wide decline in carbonate production threatens coral reef growth. Nat. Commun. 4, 1402 ( 10.1038/ncomms2409) [DOI] [PMC free article] [PubMed] [Google Scholar]
- 3.Hoegh-Guldberg O. et al. 2007. Coral reefs under rapid climate change and ocean acidification. Science 318, 1737–1742. ( 10.1126/science.1152509) [DOI] [PubMed] [Google Scholar]
- 4.Hoegh-Guldberg O. 1999. Climate change, coral bleaching and the future of the world's coral reefs. Mar. Freshwater Res. 50, 839–866. ( 10.1071/MF99078) [DOI] [Google Scholar]
- 5.Wisshak M, Schönberg CH, Form A, Freiwald A. 2012. Ocean acidification accelerates reef bioerosion. PLoS ONE 7, e45124 ( 10.1371/journal.pone.0045124) [DOI] [PMC free article] [PubMed] [Google Scholar]
- 6.Silbiger NJ, Guadayol Ò, Thomas FI, Donahue MJ. 2014. Reefs shift from net accretion to net erosion along a natural environmental gradient. Mar. Ecol. Prog. Ser. 515, 33–44. ( 10.3354/meps10999) [DOI] [Google Scholar]
- 7.Silbiger N, Donahue M. 2015. Secondary calcification and dissolution respond differently to future ocean conditions. Biogeosciences 12, 567–578. ( 10.5194/bg-12-567-2015) [DOI] [Google Scholar]
- 8.Silbiger NJ, Guadayol Ò, Thomas FI, Donahue MJ. 2016. A novel μCT analysis reveals different responses of bioerosion and secondary accretion to environmental variability. PLoS ONE 11, e0153058 ( 10.1371/journal.pone.0153058) [DOI] [PMC free article] [PubMed] [Google Scholar]
- 9.Schönberg CH, Fang JK, Carreiro-Silva M, Tribollet A, Wisshak M. 2017. Bioerosion: the other ocean acidification problem. ICES J. Mar. Sci. 74, 895–925. ( 10.1093/icesjms/fsw254) [DOI] [Google Scholar]
- 10.Stubler AD, Peterson BJ. 2016. Ocean acidification accelerates net calcium carbonate loss in a coral rubble community. Coral Reefs 35, 795–803. ( 10.1007/s00338-016-1436-x) [DOI] [Google Scholar]
- 11.Andersson A, Gledhill D. 2013. Ocean acidification and coral reefs: effects on breakdown, dissolution, and net ecosystem calcification. Ann. Rev. Mar. Sci. 5, 321–348. ( 10.1146/annurev-marine-121211-172241) [DOI] [PubMed] [Google Scholar]
- 12.Le Grand HM, Fabricius KE. 2011. Relationship of internal macrobioeroder densities in living massive Porites to turbidity and chlorophyll on the Australian Great Barrier Reef. Coral Reefs 30, 97–107. ( 10.1007/s00338-010-0670-x) [DOI] [Google Scholar]
- 13.Fabricius KE. 2005. Effects of terrestrial runoff on the ecology of corals and coral reefs: review and synthesis. Mar. Pollut. Bull. 50, 125–146. ( 10.1016/j.marpolbul.2004.11.028) [DOI] [PubMed] [Google Scholar]
- 14.Szmant AM. 2002. Nutrient enrichment on coral reefs: is it a major cause of coral reef decline? Estuaries 25, 743–766. ( 10.1007/BF02804903) [DOI] [Google Scholar]
- 15.Lapointe BE. 1997. Nutrient thresholds for bottom-up control of macroalgal blooms on coral reefs in Jamaica and southeast Florida. Limnol. Oceanogr. 42, 1119–1131. ( 10.4319/lo.1997.42.5_part_2.1119) [DOI] [Google Scholar]
- 16.DeCarlo TM, Cohen AL, Barkley HC, Cobban Q, Young C, Shamberger KE, Brainard RE, Golbuu Y. 2014. Coral macrobioerosion is accelerated by ocean acidification and nutrients. Geology 43, 7–10. ( 10.1130/G36147.1) [DOI] [Google Scholar]
- 17.Halpern BS, Selkoe KA, Micheli F, Kappel CV. 2007. Evaluating and ranking the vulnerability of global marine ecosystems to anthropogenic threats. Conserv. Biol. 21, 1301–1315. ( 10.1111/j.1523-1739.2007.00752.x) [DOI] [PubMed] [Google Scholar]
- 18.Hatcher BG. 1990. Coral reef primary productivity. a hierarchy of pattern and process. Trends. Ecol. Evol. (Amst.) 5, 149–155. ( 10.1016/0169-5347(90)90221-X) [DOI] [PubMed] [Google Scholar]
- 19.Lubarsky KA, Silbiger NJ, Donahue MJ. 2018. Effects of submarine groundwater discharge on coral accretion and bioerosion on two shallow reef flats. Limnol. Oceanogr. ( 10.1002/lno.10799) [DOI] [Google Scholar]
- 20.Dunn JG, Sammarco PW, LaFleur G. 2012. Effects of phosphate on growth and skeletal density in the scleractinian coral Acropora muricata: a controlled experimental approach. J. Exp. Mar. Biol. Ecol. 411, 34–44. ( 10.1016/j.jembe.2011.10.013) [DOI] [Google Scholar]
- 21.Koop K. et al. 2001. Encore: the effect of nutrient enrichment on coral reefs. synthesis of results and conclusions. Mar. Pollut. Bull. 42, 91–120. ( 10.1016/S0025-326X(00)00181-8) [DOI] [PubMed] [Google Scholar]
- 22.Marubini F, Davies P. 1996. Nitrate increases zooxanthellae population density and reduces skeletogenesis in corals. Mar. Biol. 127, 319–328. ( 10.1007/BF00942117) [DOI] [Google Scholar]
- 23.Marubini F, Thake B. 1999. Bicarbonate addition promotes coral growth. Limnol. Oceanogr. 44, 716–720. ( 10.4319/lo.1999.44.3.0716) [DOI] [Google Scholar]
- 24.Holmes KE, Edinger EN, Hariyadi, Limmon GV, Risk MJ. 2000. Bioerosion of live massive corals and branching coral rubble on Indonesian coral reefs. Mar. Pollut. Bull. 40, 606–617. ( 10.1016/S0025-326X(00)00067-9) [DOI] [Google Scholar]
- 25.Holmes KE. 2000. Effects of eutrophication on bioeroding sponge communities with the description of new West Indian sponges, Cliona spp. (Porifera: Hadromerida: Clionidae). Invertebr. Biol. 119, 125–138. ( 10.1111/j.1744-7410.2000.tb00001.x) [DOI] [Google Scholar]
- 26.Rose CS, Risk MJ. 1985. Increase in Cliona delitrix infestation of Montastrea cavernosa heads on an organically polluted portion of the Grand Cayman fringing-reef. Mar. Ecol.-Pubblicazioni Della Stazione Zoologica Di Napoli I 6, 345–363. ( 10.1111/j.1439-0485.1985.tb00142.x) [DOI] [Google Scholar]
- 27.Edinger EN, Limmon GV, Jompa J, Widjatmoko W, Heikoop JM, Risk MJ. 2000. Normal coral growth rates on dying reefs: are coral growth rates good indicators of reef health? Mar. Pollut. Bull. 40, 404–425. ( 10.1016/S0025-326X(99)00237-4) [DOI] [Google Scholar]
- 28.Carreiro-Silva M, McClanahan T, Kiene W. 2005. The role of inorganic nutrients and herbivory in controlling microbioerosion of carbonate substratum. Coral Reefs 24, 214–221. ( 10.1007/s00338-004-0445-3) [DOI] [Google Scholar]
- 29.Lantz C, Carpenter R, Edmunds P. 2017. Calcium carbonate (CaCO−3). J. Exp. Mar. Biol. Ecol. 495, 48–56. ( 10.1016/j.jembe.2017.05.014) [DOI] [Google Scholar]
- 30.Schaffelke B, Klumpp DW. 1998. Nutrient-limited growth of the coral reef macroalga Sargassum baccularia and experimental growth enhancement by nutrient addition in continuous flow culture. Marine Ecology Progress Series, 164, 199–211. [Google Scholar]
- 31.Schaffelke B, Klumpp DW. 1998. Short-term nutrient pulses enhance growth and photosynthesis of the coral reef macroalga Sargassum baccularia. Marine Ecology Progress Series, 170, 95–105. [Google Scholar]
- 32.DeCarlo TM, Cohen AL, Wong GT, Shiah F -K, Lentz SJ, Davis KA, Shamberger KE, Lohmann P. 2017. Community production modulates coral reef pH and the sensitivity of ecosystem calcification to ocean acidification. J. Geophys. Res.: Oceans 122, 745–761. ( 10.1002/2016JC012326) [DOI] [Google Scholar]
- 33.Yeakel KL, Andersson AJ, Bates NR, Noyes TJ, Collins A, Garley R. 2015. Shifts in coral reef biogeochemistry and resulting acidification linked to offshore productivity. Proc. Natl Acad. Sci. USA 112, 14 512–14 517. ( 10.1073/pnas.1507021112) [DOI] [PMC free article] [PubMed] [Google Scholar]
- 34.Shaw EC, Mcneil BI, Tilbrook B, Matear R, Bates ML. 2013. Anthropogenic changes to seawater buffer capacity combined with natural reef metabolism induce extreme future coral reef CO2 conditions. Glob. Change Biol. 19, 1632–1641. ( 10.1111/gcb.12154) [DOI] [PubMed] [Google Scholar]
- 35.Page HN, Andersson AJ, Jokiel PL, Ku'ulei SR, Lebrato M, Yeakel K, Davidson C, D'Angelo S, Bahr KD. 2016. Differential modification of seawater carbonate chemistry by major coral reef benthic communities. Coral Reefs 35, 1311–1325. ( 10.1007/s00338-016-1490-4) [DOI] [Google Scholar]
- 36.Anthony K, Maynard JA, Diaz-Pulido G, Mumby PJ, Marshall PA, Cao L, Hoegh-Guldberg O. 2011. Ocean acidification and warming will lower coral reef resilience. Glob. Change Biol. 17, 1798–1808. ( 10.1111/j.1365-2486.2010.02364.x) [DOI] [Google Scholar]
- 37.Cyronak T, Schulz KG, Santos IR, Eyre BD. 2014. Enhanced acidification of global coral reefs driven by regional biogeochemical feedbacks. Geophys. Res. Lett. 41, 5538–5546. ( 10.1002/2014GL060849) [DOI] [Google Scholar]
- 38.Kleypas JA, Anthony K, Gattuso J-P. 2011. Coral reefs modify their seawater carbon chemistry–case study from a barrier reef (Moorea, French Polynesia). Glob. Change Biol. 17, 3667–3678. ( 10.1111/j.1365-2486.2011.02530.x) [DOI] [Google Scholar]
- 39.Muehllehner N, Langdon C, Venti A, Kadko D. 2016. Dynamics of carbonate chemistry, production, and calcification of the Florida Reef Tract (2009–2010): Evidence for seasonal dissolution. Global Biogeochem. Cycles. 30, 661–688. ( 10.1002/2015GB005327) [DOI] [Google Scholar]
- 40.Silverman J, Lazar B, Erez J. 2007. Community metabolism of a coral reef exposed to naturally varying dissolved inorganic nutrient loads. Biogeochemistry 84, 67–82. ( 10.1007/s10533-007-9075-5) [DOI] [Google Scholar]
- 41.Smith JE, Price NN, Nelson CE, Haas AF. 2013. Coupled changes in oxygen concentration and pH caused by metabolism of benthic coral reef organisms. Mar. Biol. 160, 2437–2447. ( 10.1007/s00227-013-2239-z) [DOI] [Google Scholar]
- 42.Kroeker KJ, Kordas RL, Crim RN, Singh GG. 2010. Meta-analysis reveals negative yet variable effects of ocean acidification on marine organisms. Ecol. Lett. 13, 1419–1434. ( 10.1111/j.1461-0248.2010.01518.x) [DOI] [PubMed] [Google Scholar]
- 43.Pandolfi JM, Connolly SR, Marshall DJ, Cohen AL. 2011. Projecting coral reef futures under global warming and ocean acidification. Science 333, 418–422. ( 10.1126/science.1204794) [DOI] [PubMed] [Google Scholar]
- 44.Barkley HC, Cohen AL, Golbuu Y, Starczak VR, DeCarlo TM, Shamberger KE. 2015. Changes in coral reef communities across a natural gradient in seawater pH. Sci. Adv. 1, e1500328 ( 10.1126/sciadv.1500328) [DOI] [PMC free article] [PubMed] [Google Scholar]
- 45.Tribollet A, Godinot C, Atkinson M, Langdon C. 2009. Effects of elevated pCO2 on dissolution of coral carbonates by microbial euendoliths. Global. Biogeochem. Cycles 23, GB3008 ( 10.1029/2008GB003286) [DOI] [Google Scholar]
- 46.Quinlan ZA. et al. 2018. Fluorescent organic exudates of corals and algae in tropical reefs are compositionally distinct and increase with nutrient enrichment. Limnol. Oceanogr. Lett. ( 10.1002/lol2.10074) [DOI] [Google Scholar]
- 47.Long MH, Rheuban JE, Berg P, Zieman JC. 2012. A comparison and correction of light intensity loggers to photosynthetically active radiation sensors. Limnol. Oceanogr.: Methods 10, 416–424. ( 10.4319/lom.2012.10.416) [DOI] [Google Scholar]
- 48.Silbiger NJ, Donahue MJ, Brainard RE. 2017. Environmental drivers of coral reef carbonate production and bioerosion: a multi-scale analysis. Ecology 98, 2547–2560. ( 10.1002/ecy.1946) [DOI] [PubMed] [Google Scholar]
- 49.Dickson AG, Sabine CL, Christian JR. 2007. Guide to best practices for ocean CO2 measurements. North Pacific Marine Science Organization. PICES Special Publication 3; PICES, Sidney, BC. [Google Scholar]
- 50.Wolf-Gladrow DA, Zeebe RE, Klaas C, Körtzinger A, Dickson AG. 2007. Total alkalinity: the explicit conservative expression and its application to biogeochemical processes. Mar. Chem. 106, 287–300. ( 10.1016/j.marchem.2007.01.006) [DOI] [Google Scholar]
- 51.Gattuso J, Epitalon J, Lavigne H, Orr J, Gentili B, Hofmann A, Proye A, Soetaert K, Rae J. 2015. seacarb: Seawater carbonate chemistry, R package version 3.0.6. http://CRAN.R-project.org/package=seacarb (last accessed November 2015). [Google Scholar]
- 52.Riebesell U, Fabry VJ, Hansson L, Gattuso J-P. 2011. Guide to best practices for ocean acidification research and data reporting. Luxembourg: Office for Official Publications of the European Communities. [Google Scholar]
- 53.Bates D, Mächler M, Bolker B, Walker S. 2014. Fitting linear mixed-effects models using lme4. (http://arxiv.org/abs/1406.5823) [Google Scholar]
- 54.Silverman J, Lazar B, Erez J. 2007. Effect of aragonite saturation, temperature, and nutrients on the community calcification rate of a coral reef. J. Geophys. Res.: Oceans 112, C05004 ( 10.1029/2006JC003770) [DOI] [Google Scholar]
- 55.Langdon C, Atkinson M. 2005. Effect of elevated pCO2 on photosynthesis and calcification of corals and interactions with seasonal change in temperature/irradiance and nutrient enrichment. J. Geophys. Res.: Oceans 110, C09S07 ( 10.1029/2004JC002576) [DOI] [Google Scholar]
- 56.Marubini F, Atkinson M. 1999. Effects of lowered pH and elevated nitrate on coral calcification. Marine Ecology Progress Series, 188, 117–121. [Google Scholar]
- 57.Ferrier-Pagès C, Gattuso J-P, Dallot S, Jaubert J. 2000. Effect of nutrient enrichment on growth and photosynthesis of the zooxanthellate coral Stylophora pistillata. Coral Reefs 19, 103–113. ( 10.1007/s003380000078) [DOI] [Google Scholar]
- 58.Stambler N, Popper N, Dubinsky Z, Stimson J. 1991. Effects of nutrient enrichment and water motion on the coral Pocillopora damicornis. Pacific Sci. 45, 299–307. [Google Scholar]
- 59.Tanaka Y, Miyajima T, Koike I, Hayashibara T, Ogawa H. 2007. Imbalanced coral growth between organic tissue and carbonate skeleton caused by nutrient enrichment. Limnol. Oceanogr. 52, 1139–1146. ( 10.4319/lo.2007.52.3.1139) [DOI] [Google Scholar]
- 60.Sawall Y, Teichberg M, Seemann J, Litaay M, Jompa J, Richter C. 2011. Nutritional status and metabolism of the coral Stylophora subseriata along a eutrophication gradient in Spermonde Archipelago (Indonesia). Coral Reefs 30, 841–853. ( 10.1007/s00338-011-0764-0) [DOI] [Google Scholar]
- 61.Prouty NG, Cohen A, Yates KK, Storlazzi CD, Swarzenski PW, White D. 2017. Vulnerability of coral reefs to bioerosion from land-based sources of pollution. J. Geophys. Res.: Oceans 122, 9319–9331. ( 10.1002/2017JC013264) [DOI] [Google Scholar]
- 62.Webb AE, van Heuven SM, de Bakker DM, van Duyl FC, Reichart G-J, de Nooijer LJ. 2017. Combined effects of experimental acidification and eutrophication on reef sponge bioerosion rates. Front. Mar. Sci. 4, 311 ( 10.3389/fmars.2017.00311) [DOI] [Google Scholar]
- 63.Kristensen E. 2000. Organic matter diagenesis at the oxic/anoxic interface in coastal marine sediments, with emphasis on the role of burrowing animals. Hydrobiologia 426, 1–24. ( 10.1023/A:1003980226194) [DOI] [Google Scholar]
- 64.Krumins V, Gehlen M, Arndt S, Van Cappellen P, Regnier P. 2013. Dissolved inorganic carbon and alkalinity fluxes from coastal marine sediments: model estimates for different shelf environments and sensitivity to global change. Biogeosciences 10, 371–398. ( 10.5194/bg-10-371-2013) [DOI] [Google Scholar]
- 65.Albright R, Benthuysen J, Cantin N, Caldeira K, Anthony K. 2015. Coral reef metabolism and carbon chemistry dynamics of a coral reef flat. Geophys. Res. Lett. 42, 3980–3988. ( 10.1002/2015GL063488) [DOI] [Google Scholar]
- 66.Suzuki A. 1998. Combined effects of photosynthesis and calcification on the partial pressure of carbon dioxide in seawater. J. Oceanogr. 54, 1–7. ( 10.1007/BF02744376) [DOI] [Google Scholar]
- 67.Nelson CE. et al. 2015. Fluorescent dissolved organic matter as a multivariate biogeochemical tracer of submarine groundwater discharge in coral reef ecosystems. Mar. Chem. 177, 232–243. ( 10.1016/j.marchem.2015.06.026) [DOI] [Google Scholar]
- 68.Silbiger NJ, Nelson CE, Remple K, Sevilla JK, Quinlan ZA, Putnam HM, Fox MD, Donahue MJ. 2018. Data from: nutrient pollution disrupts key ecosystem functions on coral reefs Dryad Digital Repository. ( 10.5061/dryad.nm1ns61) [DOI] [PMC free article] [PubMed]
Associated Data
This section collects any data citations, data availability statements, or supplementary materials included in this article.
Data Citations
- Silbiger NJ, Nelson CE, Remple K, Sevilla JK, Quinlan ZA, Putnam HM, Fox MD, Donahue MJ. 2018. Data from: nutrient pollution disrupts key ecosystem functions on coral reefs Dryad Digital Repository. ( 10.5061/dryad.nm1ns61) [DOI] [PMC free article] [PubMed]
Supplementary Materials
Data Availability Statement
Data and code are available on GitHub (https://github.com/njsilbiger/Nutrient-pollution-disrupts-key-ecosystem-functions-on-coral-reefs) and Dryad (doi:10.5061/dryad.nm1ns61) [68].