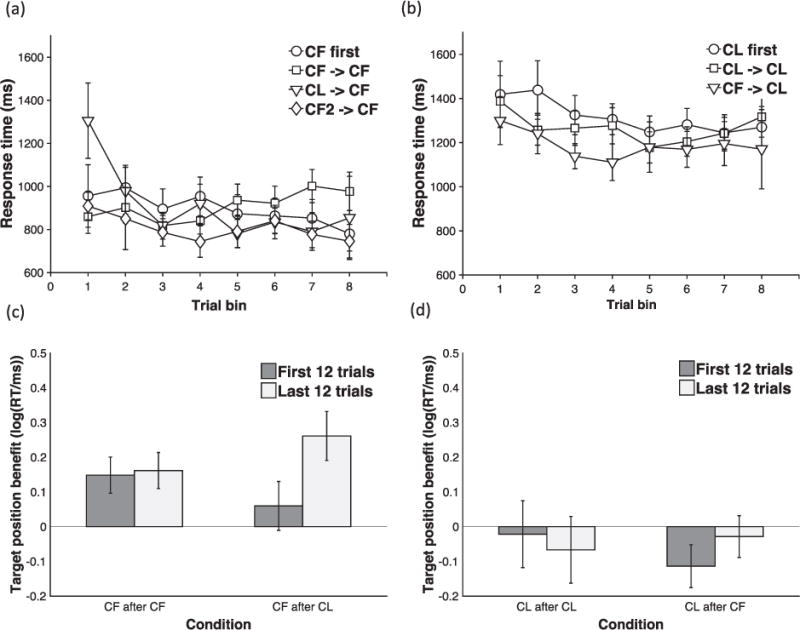
Fig. 3.

(a) and (b) Transfer effects for CF (a) and CL (b) trial structures. Mean RT for each 6-trial bin is plotted as a function of training history - no prior training (circles), prior training with same structure (squares), or different trial structure (triangles). Error bars reflect 95% confidence intervals. (c) and (d) Target position effects for CF (c) and CL (d) trial structures. Mean target position benefit in RT (target-middle RT – target-last RT) plotted for early (first 12 trials – dark grey bars) and late (last 12 trials – light grey bars) in test blocks of CF - > CF and CL - > CF conditions (c) and CL - > CL and CF - > CL conditions (d). RTs were log-transformed. Error bars reflect 95% confidence intervals.
