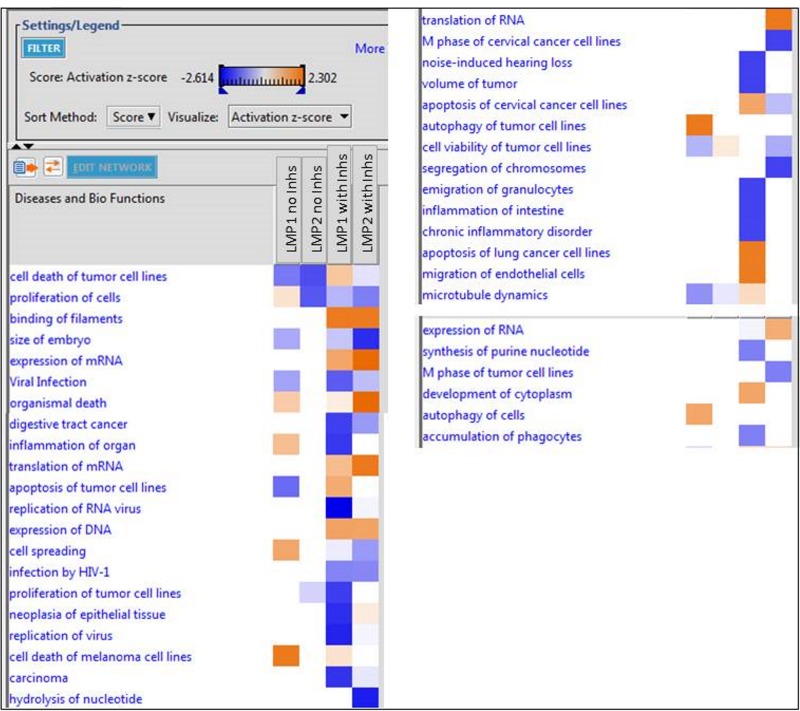
FIG 4 .
Analysis of the Diseases and bio-functions group. A comparison of the diseases and biological functions associated with significant expression changes for LMP1 and LMP2A, with or without inhibitors, versus the pBabe control, is shown. The scores are displayed on a scale from dark blue to orange, with dark blue representing the most negative scores or inactivation and orange representing the highest positive scores or activation. Only diseases and functions with a P value of <0.05 are displayed. Activation scores with an absolute value of 2 or more are considered significant. Again, an increase in the number of significant scores was found in samples where inhibitors were added.

