

Abstract
Aims
We aimed to assess whether vitamin D supplementation improves glucose metabolism in adults with type 2 diabetes.
Methods
PubMed and Cochrane database were searched up to July 1st 2016 for randomized controlled trials that assessed the relationship between vitamin D supplementation and glucose metabolism (change in hemoglobin A1C (HbA1C) and fasting blood glucose (FBG)) among adults with type 2 diabetes.
Results
Twenty nine trials (3324 participants) were included in the systematic review. Among 22 studies included in the meta-analysis, 19 reported HbA1C, 16 reported FBG outcomes and 15 were deemed poor quality. There was a modest reduction in HbA1C (−0.32% [−0.53 to −0.10], I2 = 91.9%) compared to placebo after vitamin D supplementation but no effect on FBG (−2.33 mg/dl [−6.62 to 1.95], I2 = 59.2%). In studies achieving repletion of vitamin D deficiency (n = 7), there were greater mean reductions in HbA1C (−0.45%, [−1.09 to 0.20]) and FBG (−7.64 mg/dl [−16.25 to 0.97]) although not significant.
Conclusions
We found a modest reduction of HbA1C after vitamin D treatment in adults with type 2 diabetes albeit with substantial heterogeneity between studies and no difference in FBG. Larger studies are needed to further evaluate the glycemic effects of vitamin D treatment especially in patients with vitamin D deficiency.
Keywords: Vitamin D, Type 2 diabetes, Glucose metabolism, Randomized controlled trials, Systematic review
1. Introduction
Observational association between vitamin D deficiency and diabetes has been well described.1–4 However, whether vitamin D treatment improves glycemic control has not been convincingly demonstrated. Several mechanisms have been proposed to explain the potential role of vitamin D in glucose metabolism: (1) direct stimulation of insulin secretion through the vitamin D receptor on pancreatic beta cells, (2) lowering of systemic inflammation and subsequent improvement in insulin resistance and (3) improving peripheral insulin resistance via vitamin D receptors in muscles and liver.5–7
In past years, multiple randomized controlled trials (RCTs) have been conducted to evaluate whether supplementation with vitamin D can improve glycemic control in adults with type 2 diabetes mellitus. In contrast to observational studies supporting the beneficial role of vitamin D in glucose metabolism, three most recent systematic reviews examining the efficacy of vitamin D treatment for improving glycemic control in patients with type 2 diabetes showed no benefits.8–10 These reviews, however, were limited by clinical and methodological heterogeneity in the included studies; two recent reviews included studies using various different forms of vitamin D such as intramuscular delivery of vitamin D or active vitamin (i.e., calcitriol); the meta-analysis by Nigil Haroon et al. included healthy as well as subjects with impaired fasting glucose of type 2 diabetes. They also included observational studies, which are limited in ability to give insight on causality. Further, neither review systematically examined the role of differing lengths and doses of vitamin D supplementation in the reported treatment effects and whether baseline vitamin D deficiency may impact glycemic outcomes after vitamin D repletion. Indeed, previous studies have reported glycemic benefits and improvements in beta cell function among vitamin D deficient adults upon vitamin D supplementation.11,12 Since the previously published reviews on this topic,8,9 we found 11 additional eligible studies; by updating the search and using a more comprehensive set of search terms compared to the prior reviews, we found six new RCTs completed since the previous review and five older studies not included in previous systematic reviews that met the inclusion criteria in our review.
Given the theorized mechanisms by which vitamin D could affect glycemic control and continued investigation of this topic throughout the world, we sought to expand upon the previous systematic reviews and meta-analysis to include more recently published studies in order to examine the effect of vitamin D supplementation on fasting blood glucose (FBG) and hemoglobin A1C (HbA1C) in adults with type 2 diabetes and whether the glycemic control response is related to factors such as baseline vitamin D status, treatment dose and duration.
2. Materials and methods
This study was performed according to the Cochrane Handbook recommendations and PRISMA (Preferred Reporting Items for Systematic Reviews) Statement guidelines for the reporting of systematic reviews and meta-analysis of intervention studies.13,14 The protocol for this study is provided in the Supplemental Data (S1).
2.1. Data sources and searches
We searched two electronic databases, PubMed and Cochrane Central Register of Controlled Trials (CENTRAL) published up to July 1st 2016, without imposing language or date restrictions. The primary outcomes evaluated in this review were the changes in FBG (mg/dl) and HbA1C (%). We developed a pre-specified search strategy for key terms including randomized controlled trial, diabetes, and Vitamin D using controlled vocabulary and free text (see protocol in Supplementary Data). We searched NIH’s clinical trials registry (www.clinicaltrials.gov) using similar search terms for unpublished but completed studies. We also reviewed the reference lists of the index reviews and a subset of the articles identified by our search, to further identify additional relevant studies and searched the Web of Science for articles that cited a subsample of the included articles.8–10
2.2. Study selection
A subset of authors (CJL, GI, YL, NB, CBL, SV, NM) selected relevant studies using the following inclusion criteria: randomized, controlled trials, both open-label and blinded, that evaluated the glycemic effect of vitamin D supplementation on patients with type 2 diabetes. The diagnosis of type 2 diabetes in the included studies was confirmed by baseline HbA1c or FBG levels consistent with the American Diabetes Association diagnostic criteria as per year of publication or as defined by the investigators if evidence was presented that baseline glycemic control had been quantitatively assessed. We included studies of oral vitamin D formulation containing cholecalciferol or ergocalciferol.
We excluded studies using active vitamin D (1,25-dihydroxyvita-min D) because they carry an increased risk of hypercalcemia and would be unlikely to be used in clinical practice for the indication of vitamin D deficiency. In addition, we excluded studies with intramuscular delivery of vitamin D given different absorptions between oral and intramuscular routes. We excluded studies involving participants with type 1 diabetes, participants less than 18 years of age, or involving participants with the following conditions that could potentially alter vitamin D metabolism: gestational diabetes, chronic kidney disease Stage 4 or higher, hyperparathyroidism, lymphoma, and granulomatous diseases (e.g., tuberculosis, or sarcoidosis). Interventions could be crossover trials, but only initial arm versus control results before crossover were considered for meta-analysis. Non-placebo controls, such as calcium, were allowed when given to both groups, as were dual-intervention studies such as vitamin D with and without exercise. We included any duration of study, and in post-hoc analysis divided studies into long-term and short-term studies based on whether the duration of follow-up exceeded 12 weeks, since HbA1C reflects average blood glucose over a period of 12 weeks.
2.3. Data extraction and quality assessment
Pairs of independent reviewers screened the title and the abstract of each study prior to full text screening of candidate studies. Any discrepancies in the decision to include a given study were adjudicated through review by all authors. For all included studies, two reviewers independently extracted, using a pre-specified form, information on: study sample size, country, age, baseline vitamin D status, type, dose, frequency and duration of vitamin D treatment, HbA1C and FBG.
Study quality and risk of bias were assessed using the Cochrane Collaboration tool for assessing risk of bias.13 Studies were classified as low, high, or unclear risk of bias in each of the following five bias domains: selection bias, detection, bias, performance bias, attrition and reporting bias.
2.4. Data synthesis and analysis
For our continuous outcomes (e.g., change in HbA1c, change in FBG), we extracted information about the mean difference between intervention (vitamin D) and placebo groups with 95% confidence interval. Studies with multiple comparison groups were analyzed as a 2-group trial to compare vitamin D treatment versus placebo or no treatment. A random-effects model (DerSimonian and Laird method) was used to estimate combined pooled results. The I2 statistic (%), calculated as the proportion of total variation attributable to between-study variation, was used to determine statistical heterogeneity between the studies. An I2 value of more than 75% was considered substantial heterogeneity, although we did not set a priori a cutoff to determine whether to proceed with meta-analytic pooling. We also examined the chi-square test for heterogeneity, and more generally the degree of overlap among study estimated confidence intervals, to evaluate the presence of statistical heterogeneity.
In order to further explore any substantial heterogeneity in the glycemic outcomes between studies, we performed three a priori specified subgroup analyses for glycemic outcomes based on the dose of vitamin D supplementation (≤ 2000 versus >2000 units/day) and length of treatment (≤12 versus >12 weeks).
We also performed two sensitivity analyses by including only: (1) the studies with participants whose baseline vitamin D deficiency (serum 25(OH) vitamin D levels <50 nmol/L) corrected to normal (>75 nmol/L) and (2) studies with low risk of bias (absence of high and/or more than 2 unclear biases in our risk of biases assessment).4,15 Using meta-regression, we tested the influence of vitamin dose and treatment duration on the pooled treatment effect. We evaluated publication bias using funnel plots as well as Eggers test and Begg-Mazumdar test, when ten or more studies were eligible for inclusion. Data were analyzed using STATA version 12.1 (College Station, Texas).
3. Results
We identified a total of 2341 articles from PubMed and Cochrane Central prior to July 1st 2016. After excluding 216 duplicates and studies that did not fulfill the inclusion criteria, 29 articles remained for our systematic review, of which 22 articles had sufficient baseline and outcome data for meta-analysis (Fig. 1).16–44 We also searched the clinicaltrials.gov database and performed hand searches and did not find any additional studies for this review.
Fig. 1.
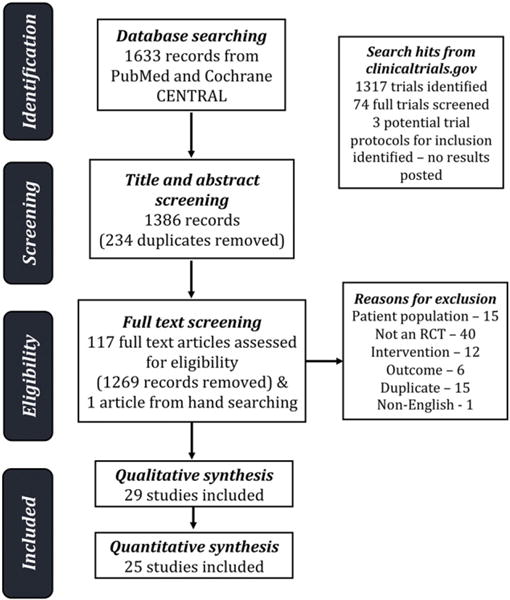
Flow diagram of search and selection processes.
3.1. Study characteristics
Characteristics of all 29 studies are shown in Table 1. A total of 3324 participants with type 2 diabetes were included in these studies. Among different types of oral vitamin D formulations, 28 studies used cholecalciferol and 1 study used ergocalciferol. Study duration ranged from 8 weeks to 5.5 years with a median duration of 12 weeks. The most common dosing schedule for vitamin D supplementation was daily, while some studies used weekly or one time bolus schedules. The dose of vitamin D used ranged from 400 IU daily to 450,000 IU once. Nine studies were conducted in Iran, nine in Europe, six in Asia, one in Australia, one in the United Arab Emirates, one in Africa, one in South America and one was a multinational study. Fifteen studies recruited those with vitamin D deficiency as defined by vitamin D25-OH of less than 50 nmol/L. Twelve studies reported how they handled diabetes medications in enrolled participants during the study observation period. Three studies had a treatment group of calcium and vitamin D versus a placebo group that received calcium (instead of no treatment).33,36,38 One study was funded by a pharmaceutical company.34 Among the 29 studies included in this systematic review, 22 were included in the meta-analysis while 7 studies were excluded because they did not report the change in the primary outcomes as means and/or did not report the variance estimates for between-group differences.
Table 1.
Characteristics of the randomized controlled trials included in the systematic review (n = 29).
| First author, year | Participants (T/C) | Country | Participant’s age (mean) | Vitamin D-25OH level (nmol/L) | Intervention vitamin D type, dose, frequency | Duration of observation (weeks) | Diabetes medications during the study period | Outcome measures | In meta-analysis | |
|---|---|---|---|---|---|---|---|---|---|---|
| Ahmadi 2013 | 30/30 | Iran | T: 58 C: 57 |
T1: 35.2 ± 19.4 T2:177.7 ± 66.1 C1: 100.1 ± 15.2 C2: 43.9 ± 15.2 |
D3 50,000 IU per week | 12 | N/A | HbA1c | Yes | |
| Anyanwu 2016 | 17/16 | Nigeria | T:52.5 C: 51.1 |
T1: 17.2 ± 2.2 T2: 18.2 ± 2.2 C1: 18.5 ± 5.2 C2: 16.7 ± 1.7 |
D3 3000 IU daily | 12 | All medications were kept constant | HbA1c FBG |
Yes | |
| Ayesha 1998 | 8/8/8/8 | India | N/A | T1: 104.8 ± 5.5 T2: 149.8 ± 2.2 C1: 59.9 ± 15 C2: 82.4 ± 2.2 |
T1: D3 150,000 IU once T2: D3 300,000 IU once T3: D3 450,000 IU once |
12 | N/A | FBG | Yes | |
| Barchetta 2016 | 26/29 | Italy | T: 57.4 C: 59.8 |
Median (IQR) T1: 43.1 (31.1–58.5) T2: 85.8 (73–110) C1: 37.1 (27.3–51.6) C2: 40 (20.8–60.5) |
D3 2000 IU daily | 24 | Drug alterations were not allowed | HbA1c FBG |
No | |
| Baziar 2014 | 43/44 | Iran | T: 50 C: 53 |
T1: 35.8 ± 14.6 T2: 112.4 ± 31.4 C1: 38.7 ± 13.9 C2: 42.1 ± 15.6 |
D3 50,000 IU weekly | 8 | Drug alterations were not allowed | FBG | Yes | |
| Brevlasky 2013 | 24/23 | Israel | T: 67 C: 66 |
T1: 32.2 ± 26.7 T2: 43.9 ± 28.4 C1: 26.9 ± 16.4 C2: 34.9 ± 14.7 |
D3 1000 IU daily | 52 | All medications were kept constant | HbA1c FBG |
Yes | |
| Cavalcante 2015 | Total 38 (did not specify T vs C) | Brazil | T:62.16 C: 62.32 |
T1: 55.9 ± 9.9 T2: 57.4 ± 10.6 C1: 57.2 ± 10.5 C2: 57.0 ± 9.7 |
D3 943 IU daily | 12 | N/A | HbA1c | No | |
| Dalan 2016 | 31/30 | Singapore | T: 52.2 C: 54.8 |
Median T1: 43.25 T2: 79 C1: 46.5 C2: 48.3 |
D3 4000 IU to pts with baseline 25(OH)D < 50 nmol/L D3 2000 IU daily to pts with baseline 25(OH)D 50–75 nmol/L Dose reduced by half if 25(OH)D > 50 nmol/L at 8 weeks | 16 | N/A | HbA1c | No | |
| Elkassaby 2014 | 26/24 | Australia | T: 53 C: 51 |
Median (IQR) T1: 59 (42–75) T2: 128 (111–146) C: 62 (40–80) C2: 61 (45–87) |
D3 10,000 IU × 2 weeks, then 6000 IU × 22 weeks | 24 | Medications were increased by family physician if necessary | HbA1c FBG |
No | |
| Ghavamzadeh 2014 | 60/60 | Iran | T: 52 C: 49 |
T1: 31.0 ± 4.9 T2: 104.9 ± 19.0 C1: 34.8 ± 3.8 C2: 32.1 ± 3.4 |
D3 400 IU daily | 14 | N/A | HbA1c | Yes | |
| Grubler 2016 | 20/27 | Austria | Not specified for this subgroup | T1: 41.6 ± 15.2 T2: N/A C1: not specified C2: N/A |
D3 2800 IU daily | 8 | N/A | HbA1c FBG |
Yes | |
| Jafari 2015 | 32/32 | Iran | T: 58 C: 57 |
T1: 62.23 ± 4.52 T2: 86.83 ± 4.87 C1: 62.72 ± 4.27 C2: 56.13 ± 2.89 |
Fortified yogurt containing 2000 IU D3 in 100 mg/day | 12 | Drug alterations were not allowed | HbA1c FBG |
Yes | |
| Jorde 2009 | 20/16 | Norway | T: 58 C: 55 |
T1: 60 ± 14 T2: 118.3 ± 29.8 C1: 58.5 ± 21 C2: 57.2 ± 14.8 |
D3 40,000 IU weekly | 24 | Participants were advised to keep all medications constant | HbA1c FBG |
Yes | |
| Kampmann 2014 | 8/8 | Denmark | T: 62 C: 57 |
T1: 31 ± 4.9 T2: 104.9 ± 19.0 C1: 34.8 ± 3.8 C2: 32.1 ± 3.4 |
D3 11,200 IU daily × 2 weeks, then 5600 IU daily ×10 weeks | 12 | Participants were advised to keep all medications constant | HbA1c FBG |
Yes | |
| Kim 2014 | 15/13 | Korea | T: 70 C: 69 |
T1: 11.91 ± 1.66 T2: N/A C1: 13.05 ± 1.43 C2: N/A |
D3 1200 IU daily | 12 | N/A | FBG | Yes | |
| Krul Poel 2015 | 136/138 | The Netherlands | T: 67 C: 67 |
T1: 60.6 ± 23.3 T2: 101.4 ± 27.6 C1: 59.1 ± 23.2 C2: 59.8 ± 27.4 |
D3 50,000 IU per month | 104 | Drug alterations were not allowed | HbA1c FBG |
Yes | |
| Nasri 2014 | 30/30 | Iran | 55 | T1: 83.9 ± 52 T2: 164 ± 57 C1: 105.7 ± 64 C2: 115.8 ± 94 |
D3 50,000 IU weekly | 12 | N/A | HbA1c | Yes | |
| Nikooyeh 2011 | 30/30 | Iran | T: 51 C: 51 |
T1: 44.4 ± 28.7 T2: 77.7 ± 28.6 C1: 41.6 ± 44.5 C2: 37.2 ± 44 |
D3 1000 IU daily (both groups received calcium 300 mg daily) | 12 | Drug alterations were not allowed | HbA1c FBG |
Yes | |
| Punthakee 2012 | 607/614 | 33 countries | T: 67 C: 67 |
N/A | D3 1000 IU daily | 287 | N/A | HbA1c FBG |
Yes | |
| Razzaghi 2016 | 30/30 | Iran | T: 59.6 C:58.6 |
T1: 37.9 ± 24.7 T2: 70.1 ± 31.2 C1: 50.4 ± 38.9 C2: 45.9 ± 21.2 |
D3 50,000 IU every 2 weeks | 12 | N/A | HbA1c FBG |
Yes | |
| Ryu 2014 | 79/79 | Korea | T: 55 C: 56 |
T1: 27.0 ± 12.7 T2: 75.4 ± 27.0 C1: 25.2 ± 9.7 C2: 38.9 ± 17.7 |
D3 2000 IU daily + calcium 200 mg daily | 24 | N/A | HbA1c FBG |
Yes | |
| Sadiya 2014 | 45/42 | UAE | T: 49 C: 48 |
T1: 28.5 ± 9.2 T2: 62.3 ± 20.8 C1: 30.5 ± 11.2 C2: 25.4 ± 11.8 |
D3 6000 IU daily × 3 months, then 3000 IU daily × 3 months | 12 | Advised to maintain usual medical care | HbA1c FBG |
Yes | |
| Shab-Bidar 2012 | 50/50 | Iran | T: 53 C: 52 |
T1: 38.5 ± 20.2 T2: 72.0 ± 23.5 C1: 38 ± 22.8 C2: 33.4 ± 22.8 |
D3 1000 IU daily (both groups received calcium 340 mg daily) | 12 | N/A | HbA1c FBG |
Yes | |
| Strobel 2014 | 43/43 | Germany | 60 | T1: N/A T2: 87.4 (33.9, 143.8) C1: N/A C2: 49.9 (20.0, 95.6) |
D3 1904 IU daily | 24 | N/A | HbA1c FBG |
No | |
| Sugden 2008 | 34 | Scotland | T: 65 C: 64 |
T1: 40.2 ± 10.3 T2: Change of 22.9 ± 16.6 C1: 36.4 ± 8.5 C2: Change of 7.6 ± 12.5 |
D2 100,000 IU once | 8 | Drug alterations were not allowed | HbA1c | Yes | |
| Tabesh 2014 | 30/30 | Iran | T: 50 C: 54 |
T1: 27.8 ± 13.9 T2: N/A C1: 35.7 ± 15.1 C2: N/A |
D3 50,000 IU weekly + calcium 1000 mg daily | 8 | N/A | HbA1c FBG |
No | |
| Witham 2010 | 22/19/20 | Scotland | T1: 65 T2: 63 C: 67 |
T1: 48 ± 21 T2: 79 ± 21 C1: 45 ± 17 C2: 54 ± 20 |
T1: D3 100,000 IU once T2: D3 200,000 IU once |
12 | N/A | HbA1c | Yes | |
| Yiu 2013 | 50/50 | Hong Kong | T: 66 C: 65 |
T1: 52.7 ± 11.0 T2: 146.3 C1: 54.7 ± 10.2 C2: 59.4 |
D3 5000 IU daily | 12 | N/A | HbA1c FBG |
No | |
| Zhou 2015 | 31/31 | China | 59 | T1: 30.9 ± 20.9 T2: 48.1 ± 5.8 C1: 33.2 ± 19.4 C2: 29.1 ± 5.9 |
D3 1000 IU | 12 | N/A | HbA1c | Yes | |
T1: treatment group before intervention, T2: treatment group after intervention, C1: control group before intervention, C2t: Control group after intervention, FBG: fasting blood glucose, HbA1c: hemoglobin A1c.
3.2. Quality assessment
The risk of bias assessment was conducted using the Cochrane Collaboration’s tool (Supplementary Fig. 1). Overall, a total of 15 of the 22 studies included in the meta-analysis were deemed poor quality based on having one or more characteristic that was considered high risk or more than two characteristics of unclear risks among the six categories of risks of bias. Among the 22 studies, 15 studies reported adequate details of their randomization method or adequate information to confirm appropriate allocation concealment and masking of participants and personnel; only 8 studies described in sufficient detail whether the outcome assessors were blinded to each participant’s treatment assignment; 17 studies reported adequate details of the degrees of missing data and reasons for attrition; 14 studies were deemed low-risk for reporting bias. Among the six categories of biases mentioned above, attrition bias was detected most frequently at high risk (8 studies).
3.3. Meta-analysis: hemoglobin A1C
We included a total of 19 studies for HbA1c and 16 studies for FBG based on the outcome measure reported in the study.
The pooled analysis for HbA1c significantly favored vitamin D treatment with reduction of 0.32% after treatment compared to placebo (WMD −0.32% [−0.53 to −0.10], P = 0.022) albeit with substantial heterogeneity between studies (I2 = 91.9%, Pfor heterogeneity < 0.001, Fig. 2A).
Fig. 2.
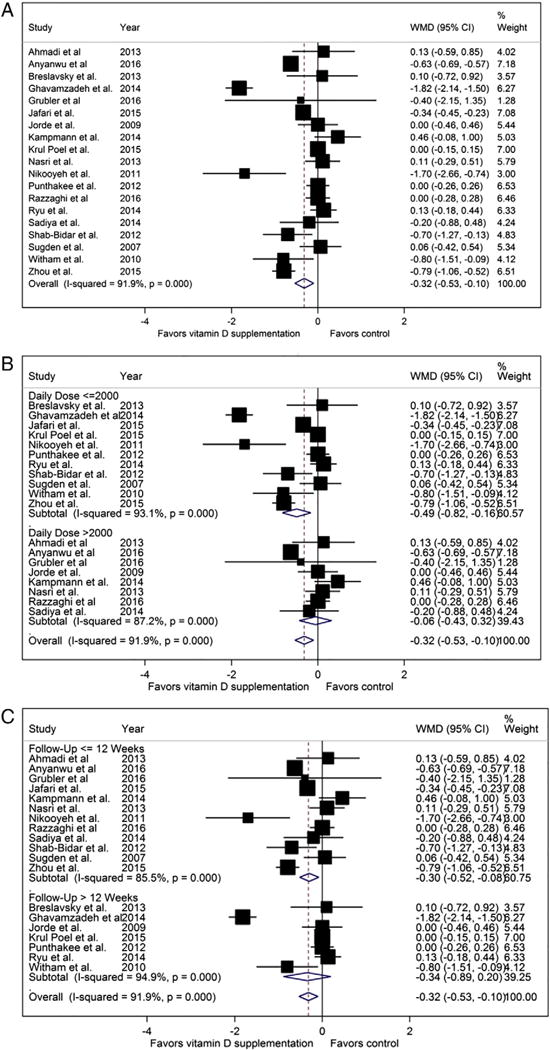
Hemoglobin A1C forest plots (%, A: pooled, B: stratified by dose, 2: stratified by treatment length).
In dose-stratified analysis (Fig. 2B), studies that used higher doses of vitamin D showed no treatment effect in the absence of statistical heterogeneity between studies (WMD 0.06% [−0.43 to 0.32], I2 = 87.2%, Pfor heterogeneity < 0.001) whereas the studies using lower doses of vitamin D favored vitamin D supplementation with substantial heterogeneity (WMD −0.49% [−0.82 to −0.16], I2 = 93.1%, Pfor heterogeneity < 0.001). In treatment duration subgroup analysis (Fig. 2C), the studies with shorter treatment lengths showed a trend towards improvement in HbA1C, though the heterogeneity remained substantial (WMD −0.30% [−0.52 to −0.08] I2 = 85.5%, Pfor heterogeneity < 0.001). In contrast, the studies with longer treatment lengths showed no difference in HbA1c (WMD −0.34% mg/dl [−0.89 to 0.2] I2 = 94.9%, Pfor heterogeneity < 0.001, Fig. 2C).
In the two sensitivity analyses, we found a similar tendency to favor vitamin D treatment when including only participants with baseline vitamin D deficiency (WMD −0.45 [−1.09 to 0.20] I2 = 94.0%, Pfor heterogeneity < 0.001) (Fig. 4) whereas the studies with low risk of bias no longer showed a difference in HbA1c after treatment (WMD −0.07% [−0.32 to 0.17] I2 = 77.5%, Pfor heterogeneity < 0.001).
Fig. 4.
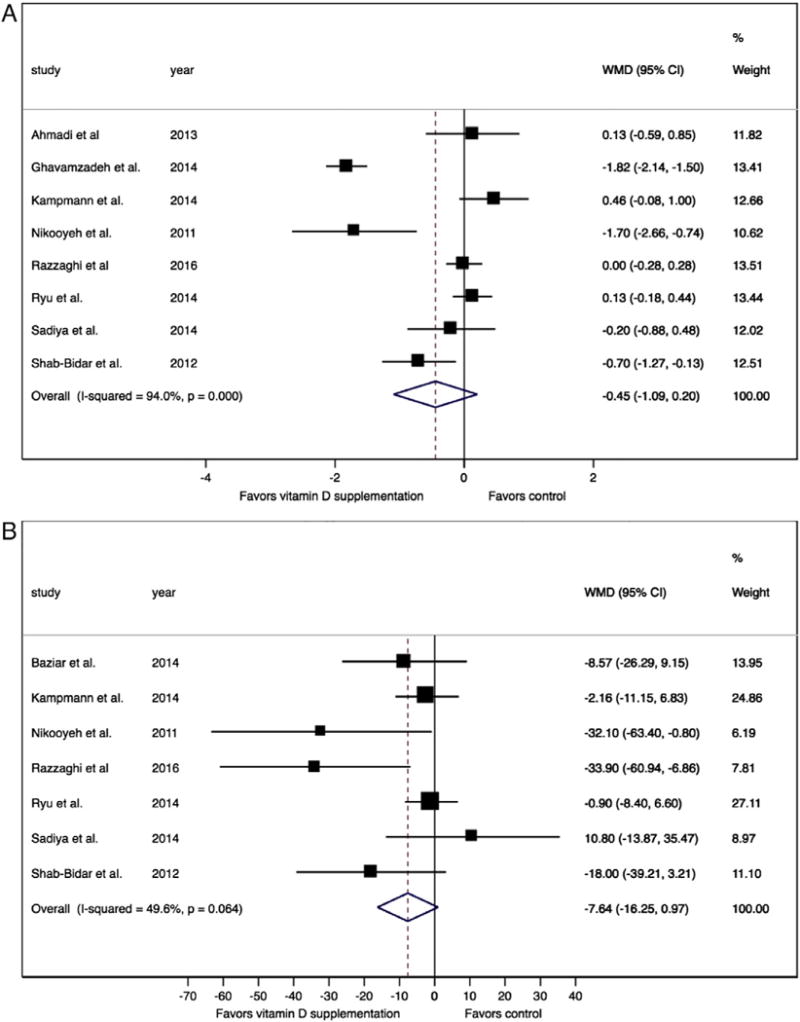
Studies of individuals whose vitamin D deficiency corrected to normal after intervention (A: hemoglobin A1C, 4B: fasting glucose, vitamin D deficiency defined as vitamin D25OH <50 nmol/L).
3.4. Meta-analysis: fasting blood glucose
In contrast to HbA1C, pooled analysis for FBG showed no overall difference after vitamin D supplementation compared with no vitamin D supplementation (weighted mean difference (WMD) −2.33 mg/dl [−6.62 to 1.95], P = 0.542, I2 = 59.2%, Fig. 3A).
Fig. 3.
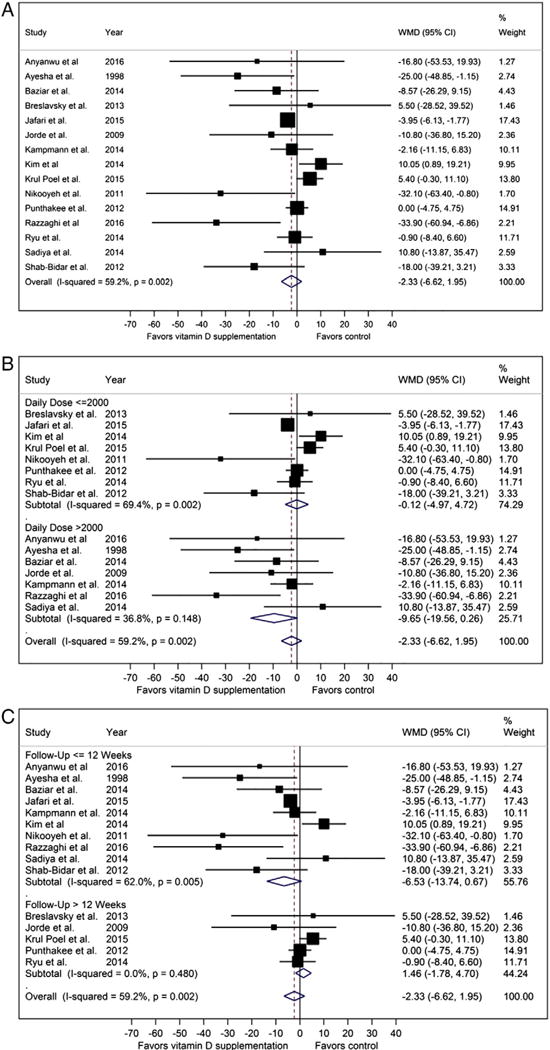
Fasting blood glucose forest plots (mg/dl, A: pooled, B: stratified by dose, C: stratified by treatment length).
To further explore the heterogeneity in the pooled analysis, we performed three subgroup analyses (by vitamin D dose, treatment length, and country) and two sensitivity analyses (studies with vitamin D deficient participants at baseline, studies with low risk of bias). With respect to treatment effect on FBG, we stratified the studies by vitamin D dose equal or less than 2000 IU versus greater than 2000 IU daily. The studies that used higher doses of vitamin D showed a greater tendency to favor vitamin D supplementation with less heterogeneity between studies though differences were non-significant (WMD −9.65 mg/dl [−19.56 to 0.26] I2 = 36.8%, Pfor heterogeneity = 0.148, Fig. 3B) compared to studies using lower doses of vitamin D (WMD −0.12 mg/dl [−4.97 to 4.72] I2 = 69.4%, Pfor heterogeneity = 0.002, Fig. 3B). Upon stratifying the studies by the length of intervention (equal or less than 12 weeks versus greater than 12 weeks in duration) the studies with shorter treatment lengths showed a tendency to favor vitamin D supplementation though differences were non-significant (WMD −6.53 mg/dl [−13.74 to 0.67], I2 = 62%, Pfor heterogeneity = 0.005, Fig. 3C). In contrast, the studies with longer treatment lengths showed no difference in FBG after treatment without any heterogeneity across studies (WMD 1.46 mg/dl [−1.78 to 4.70] I2 = 0%, Pfor heterogeneity = 0.480, Fig. 3C).
We performed two sensitivity analyses and found a tendency to favor vitamin D treatment in contrast to the overall pooled analysis when we only included: (1) studies with participants with vitamin D deficiency at baseline (WMD −7.64 mg/dl [−16.25 to 0.97] I2 =49.6%, Pfor heterogeneity = 0.064) (Fig. 4) and no difference in FBG and moderate heterogeneity between (2) studies with low risks of bias (WMD −0.61 mg/dl [−5.51 to 4.29] I2 = 67.6%, Pfor heterogeneity = 0.026).
3.5. Meta-regression
The results of meta-regression showed no significant differences between subgroups categorized by vitamin D dose or treatment duration on the pooled difference of FBG and HbA1c (all P > 0.05).
3.6. Publication bias
There was no evidence of publication bias with HbA1C according to the Eggers test (P = 0.78) and Begg–Mazumdar test (P = 0.19) (Supplementary Fig. 2A). However the funnel plot for HbA1c appeared slightly asymmetric with a few studies falling beyond the funnel, which is consistent with the substantial heterogeneity seen among studies reporting HbA1c.
Similarly, there was no evidence of publication bias with FBG based on the symmetry in the funnel plot and the results of Eggers test (P = 0.93) and the Begg–Mazumdar test (P = 0.5), both of which were non-significant (Supplementary Fig. 2B).
4. Discussion
In this systematic review and meta-analysis, we found a modest but significant reduction in HbA1c of 0.32% after vitamin D supplementation, although with substantial heterogeneity likely from varying treatment doses and lengths across studies. In contrast, we found no benefit of vitamin D supplementation in improving the FBG among individuals with type 2 diabetes. Separate analyses by vitamin D dose, treatment duration, baseline vitamin D status (i.e., insufficient/deficient vs. replete), and risk of study bias (i.e., excluding studies with high risk of bias) confirmed the null finding in the pooled analysis.
The present systematic review provides an update to an index review by Krul-Poel et al. with 11 additional studies with 1746 participants. Our findings are similar to the previous systematic reviews and meta-analyses confirming a lack of a strong evidence to support vitamin D treatment to improve glycemic outcomes.8–10,45 In contrast to the previous systematic reviews, we only included RCTs and used a more comprehensive database search strategy and more stringent selection criteria to focus on studies with adults with type 2 diabetes receiving oral vitamin D (cholecalciferol or ergocalciferol) compared against a clearly defined placebo group, thus enhancing our ability to more precisely evaluate the effect of vitamin D treatment on glycemic control. Furthermore, we performed additional subgroup and sensitivity analyses based on vitamin D dose, treatment length, baseline vitamin D status and study quality in order to better understand the differences in glycemic outcomes after vitamin D treatment across studies.
While most of the studies showed little difference in HbA1C, two studies deviated from the rest by showing a significant benefit in HbA1C reduction related to vitamin D supplementation with a mean difference of −1.7 (95% CI −2.66 to −0.74) and −1.82 (95% CI −2.14 to −1.5), respectively.25,33 In contrast to stable HbA1Cs in the placebo groups in most included studies, the placebo group in the study by Nikooyeh et al. showed worsening of HbA1C from 7.5% to 8.7%, thus making its treatment group appear superior in comparison. The study by Ghavamzadeh et al. also showed a significant benefit but had a large dropout rate which led to a substantial attrition bias: among 984 randomized participants, only 52 remained in the final analysis.
In order to further explore the substantial heterogeneity in HbA1C results across studies, we performed subgroup analyses and found that more beneficial effects were observed by studies using lower doses of vitamin D. The positive association between a lower dose vitamin D treatment and HbA1C improvement is unanticipated but appears partly due to the longer mean treatment length compared to the studies using a higher dose of vitamin D (50.8 versus 11.6 weeks). Indeed, a subgroup analysis by vitamin D treatment length suggests a more favorable HbA1C reduction with longer treatment duration (−0.34 versus −0.30%), although not statistically significant. In fact the association between a lower dose of vitamin D treatment and HbA1C improvement may be a reflection of a nonlinear relationship between vitamin D status and glucose metabolism. One study showed a threshold effect of 25-hydroxyvitamin D on glucose-insulin metabolism such that 25-hydroxyvitamin D level above 65 nmol/L supported normal glucose metabolism.46 Therefore, it is possible that a higher dose of vitamin D treatment may not necessarily result in any further improvement in glucose metabolism beyond a certain cutoff.
Therefore, we evaluated a subgroup of studies of adults whose vitamin D status was corrected from deficient to normal after the intervention and found that they overall tended to show a greater mean reduction in HbA1C, although this did not achieve statistical significance. The lack of statistical significance here may be attributable to the relatively smaller number of studies that restricted the intervention to those with baseline vitamin D deficiency. Together, these findings support the need to further explore the impact of vitamin D treatment in evaluating the glycemic outcomes after vitamin D treatment in those who are vitamin D deficient at baseline.
The lack of overall effect on FBG was similarly driven by two studies that showed a marked beneficial effect of vitamin D supplementation on FBG.18,33 Specifically, the study by Nikooyeh et al. showed a mean difference of −32.10 mg/dl (95% CI −63.40 to −0.80) in FBG, suggesting a clinically significant improvement in glycemic control among adults with diabetes after vitamin D supplementation for 12 weeks. However, this finding is again weakened by the fact that the placebo group had a significant worsening in glycemic control during this time (187.5 mg/dl at baseline, 203.3 mg/dl at the end of the study) in contrast to the placebo groups in other studies, which had largely stable FBG measurements during the study period. Interestingly, there was an absence of heterogeneity across studies in our subgroup analysis whose treatment length was 12 weeks or greater, which underscores the importance of the treatment length of vitamin D in affecting glucose metabolism, specifically fasting blood glucose. Moreover, we found a tendency to favor vitamin D treatment in studies that corrected vitamin D deficiency in their participants, which suggests that treating the vitamin D deficiency may be needed to observe glycemic benefits.
The strengths of our systematic review are inclusion of studies with a randomized controlled design, inclusion of two complementary short and long-term glycemic outcome measures that are laboratory derived and well defined with minimum detection bias (i.e., HbA1c and FBG), well-defined treatment (i.e., vitamin D supplementation) compared to placebo and an updated search with the addition of 11 new studies in this systematic review compared to the index systematic review by Krul-Poel et al.8 Furthermore, we explored the role of treatment dose and duration in subgroup analyses to understand the role of these factors in overall results and the heterogeneity across studies. Additionally, we performed subgroup analyses of studies whose participants’ baseline vitamin D deficiency corrected to normal upon intervention. We also conducted a thorough review of the quality of the included studies and risk of bias using the Cochrane Collaboration tool, which was not performed in previous meta-analyses.13 Another strength of our study is the relative uniformity of the formulation of vitamin D used in the included studies: 28 out of 29 studies used oral cholecalciferol while one study used oral ergocalciferol. By excluding studies using calcitriol or intramuscular injections of vitamin D or studies with patients who have tuberculosis, we reduced the potential for varying pharmaco-dynamic profiles among these formulations, which could differentially affect treatment outcomes.
The limitations of our review are the relatively short treatment length and small sample size of some but not all studies, which may limit our ability to draw conclusions on the effects of longer-term vitamin D supplementation, and moderate to substantial heterogeneity across studies in some of our results. In addition, our review is not generalizable to individuals with normal glucose metabolism and many of the included studies did not provide enough details to allow accurate qualitative assessment of how each study handled randomization, allocation, missing data and type of analysis. Furthermore, the glycemic outcomes reported in many of the included studies may have been affected by adjustments in diabetes medications during intervention given that only 9 out of 22 studies included in the meta-analysis reported avoiding diabetes medication adjustment during the observation period. As with all meta-analyses, this meta-analysis is subject to publication bias, whereby null results of completed but unpublished trials result in systematically unrepresentative treatment effects in the published literature. However, we found little evidence for publication bias on visual inspection of funnel plots and in the results of Eggers test and the Begg–Mazumdar test.
Another factor that may pose a challenge to interpreting the study results include questionable power calculations given that most studies that reported the number of participants needed for sufficient power did not achieve these recruitment targets. Additionally, lack of data on ethnic composition of participants in each study, which may be particularly important given the evidence for differing levels of available circulating vitamin D for a given total vitamin D measurement.47 Although vitamin D deficiency is widely prevalent, individuals with darker skin color are at an increased risk of vitamin D deficiency and cultural preferences dictating that the amount of skin exposure to the sun may play a role in sunscreen use and overall vitamin D metabolism in individuals.48,49 We did not incorporate in our analyses country latitude or season(s) during which study was conducted as indicators of overall ultraviolet light exposure.50 Also, there were differences across the included studies with regard to the method of serum 25(OH) vitamin measurement, thus adding to the challenge of comparing the baseline vitamin D status of participants across studies.
5. Conclusion
In this meta-analysis, we found a modest reduction of 0.32% in HbA1C after vitamin D treatment in individuals with type 2 diabetes, although the HbA1C results are limited by the presence of substantial heterogeneity between studies likely related to varying lengths of treatments across studies and to small sample size in some studies. On the other hand, we found no difference in FBG levels among adults with type 2 diabetes treated with versus without vitamin D. Additionally, in a subset of studies reporting vitamin D levels before and after the intervention, we found that the normalization of vitamin D levels may be needed to observe beneficial effects of vitamin D supplementation on glycemic outcomes. Ultimately, larger studies are needed to further investigate the effect of vitamin D treatment on glucose metabolism among individuals with type 2 diabetes and to identify subpopulations such as those with vitamin D deficiency that may accrue the greatest benefit.
Supplementary Material
Acknowledgments
This research was partially supported by Grant Number KL2 (5KL2TR001077-02 for CJL and NM) as part of the Institute for Clinical and Translational Research Grant from the NIH/NCAT, K23 mentored patient-oriented research career development award (DK093583 for RK) from the National Institute of Diabetes and Digestive and Kidney Disease and National Institute of Arthritis and Musculoskeletal and Skin Diseases of the National Institutes of Health T32 award (AR048522 for CBL).
Appendix A. Supplementary data
Supplementary data to this article can be found online at http://dx.doi.org/10.1016/j.jdiacomp.2017.04.019.
Footnotes
Conflicts of interest: None.
Author contributions
CJL, GI, YL, NB, CBL and NM designed the study and CJL, GI, YL, NB, CBL, SV and NM undertook the literature search and reviewed the abstracts and full articles. CJL conceived the idea for the review and drafted the manuscript. GI and YL supervised data extraction and statistical analysis. All authors interpreted the results, contributed to the discussion and critically reviewed the final manuscript and take full responsibility for the work as a whole, including (if applicable) the study design, access to data, and the decision to submit and publish the manuscript.
References
- 1.Afzal S, Bojesen SE, Nordestgaard BG. Low 25-hydroxyvitamin D and risk of type 2 diabetes: a prospective cohort study and metaanalysis. Clin Chem. 2013;59:381–91. doi: 10.1373/clinchem.2012.193003. http://dx.doi.org/10.1373/clinchem.2012.193003. [DOI] [PubMed] [Google Scholar]
- 2.Kositsawat J, Freeman VL, Gerber BS, Geraci S. Association of A1C levels with vitamin D status in U.S. adults: data from the National Health and Nutrition Examination Survey. Diabetes Care. 2010;33:1236–8. doi: 10.2337/dc09-2150. http://dx.doi.org/10.2337/dc09-2150. [DOI] [PMC free article] [PubMed] [Google Scholar]
- 3.Song Y, Wang L, Pittas AG, Del Gobbo LC, Zhang C, Manson JE, et al. Blood 25-hydroxy vitamin D levels and incident type 2 diabetes: a meta-analysis of prospective studies. Diabetes Care. 2013;36:1422–8. doi: 10.2337/dc12-0962. http://dx.doi.org/10.2337/dc12-0962. [DOI] [PMC free article] [PubMed] [Google Scholar]
- 4.Ye Z, Sharp SJ, Burgess S, Scott RA, Imamura F, InterAct Consortium et al. Association between circulating 25-hydroxyvitamin D and incident type 2 diabetes: a mendelian randomisation study. Lancet Diabetes Endocrinol. 2015;3:35–42. doi: 10.1016/S2213-8587(14)70184-6. http://dx.doi.org/10.1016/S2213–8587(14)70184-6. [DOI] [PMC free article] [PubMed] [Google Scholar]
- 5.Gysemans CA, Cardozo AK, Callewaert H, Giulietti A, Hulshagen L, Bouillon R, et al. 1,25-dihydroxyvitamin D3 modulates expression of chemokines and cytokines in pancreatic islets: implications for prevention of diabetes in nonobese diabetic mice. Endocrinology. 2005;146:1956–64. doi: 10.1210/en.2004-1322. http://dx.doi.org/10.1210/en.2004-1322. [pii] [DOI] [PubMed] [Google Scholar]
- 6.Park S, Kim da S, Kang S. Vitamin D deficiency impairs glucose-stimulated insulin secretion and increases insulin resistance by reducing PPAR-gamma expression in nonobese type 2 diabetic rats. J Nutr Biochem. 2016;27:257–65. doi: 10.1016/j.jnutbio.2015.09.013. http://dx.doi.org/10.1016/j.jnutbio.2015.09.013. [DOI] [PubMed] [Google Scholar]
- 7.Zhou QG, Hou FF, Guo ZJ, Liang M, Wang GB, Zhang X. 1,25-Dihydroxyvitamin D improved the free fatty-acid-induced insulin resistance in cultured C2C12 cells. Diabetes Metab Res Rev. 2008;24:459–64. doi: 10.1002/dmrr.873. http://dx.doi.org/10.1002/dmrr.873. [DOI] [PubMed] [Google Scholar]
- 8.Krul-Poel YH, Ter Wee MM, Lips P, Simsek S. Management of endocrine disease: the effect of vitamin D supplementation on glycaemic control in patients with type 2 diabetes mellitus: a systematic review and meta-analysis. Eur J Endocrinol. 2017;176:R1–14. doi: 10.1530/EJE-16-0391. http://dx.doi.org/10.1530/EJE-16-0391. [DOI] [PubMed] [Google Scholar]
- 9.Nigil Haroon N, Anton A, John J, Mittal M. Effect of vitamin D supplementation on glycemic control in patients with type 2 diabetes: a systematic review of interventional studies. J Diabetes Metab Disord. 2015 doi: 10.1186/s40200-015-0130-9. 14.[3-015-0130-9. eCollection 2015] [DOI] [PMC free article] [PubMed] [Google Scholar]
- 10.Seida JC, Mitri J, Colmers IN, Majumdar SR, Davidson MB, Edwards AL, et al. Clinical review: effect of vitamin D3 supplementation on improving glucose homeostasis and preventing diabetes: a systematic review and meta-analysis. J Clin Endocrinol Metab. 2014;99:3551–60. doi: 10.1210/jc.2014-2136. http://dx.doi.org/10.1210/jc.2014-2136. [DOI] [PMC free article] [PubMed] [Google Scholar]
- 11.Harinarayan CV, Arvind S, Joshi S, Thennarasu K, Vedavyas V, Baindur A. Improvement in pancreatic beta-cell function with vitamin D and calcium supplementation in vitamin D-deficient nondiabetic subjects. Endocr Pract. 2014;20:129–38. doi: 10.4158/EP13273.OR. [doi:B602R8134052VQ57, pii] [DOI] [PubMed] [Google Scholar]
- 12.Oosterwerff MM, Eekhoff EM, Van Schoor NM, Boeke AJ, Nanayakkara P, Meijnen R, et al. Effect of moderate-dose vitamin D supplementation on insulin sensitivity in vitamin D-deficient non-western immigrants in the Netherlands: a randomized placebo-controlled trial. Am J Clin Nutr. 2014;100:152–60. doi: 10.3945/ajcn.113.069260. http://dx.doi.org/10.3945/ajcn.113.069260. [DOI] [PubMed] [Google Scholar]
- 13.Higgins JP, Altman DG, Gotzsche PC, Juni P, Moher D, Oxman AD, et al. The Cochrane Collaboration’s tool for assessing risk of bias in randomised trials. BMJ. 2011;343:d5928. doi: 10.1136/bmj.d5928. http://dx.doi.org/10.1136/bmj.d5928. [DOI] [PMC free article] [PubMed] [Google Scholar]
- 14.Liberati A, Altman DG, Tetzlaff J, Mulrow C, Gotzsche PC, Ioannidis JP, et al. The PRISMA statement for reporting systematic reviews and meta-analyses of studies that evaluate health care interventions: explanation and elaboration. J Clin Epidemiol. 2009;62:e1–34. doi: 10.1016/j.jclinepi.2009.06.006. http://dx.doi.org/10.1016/j.jclinepi.2009.06.006. [DOI] [PubMed] [Google Scholar]
- 15.Ross AC, Abrams S, Aloia J, Brannon P, Clinton S, Durazo-Arvizu R, et al. Dietary reference intakes for calcium and vitamin D. 2010 doi: 10.1016/j.jada.2011.01.004. [DOI] [PubMed] [Google Scholar]
- 16.Ahmadi N, Mortazavi M, Iraj B, Askari G. Whether vitamin D3 is effective in reducing proteinuria in type 2 diabetic patients? J Res Med Sci. 2013;18:374–7. [PMC free article] [PubMed] [Google Scholar]
- 17.Anyanwu AC, Fasanmade OA, Odeniyi IA, Iwuala S, Coker HB, Ohwovoriole AE. Effect of vitamin D supplementation on glycemic control in type 2 diabetes subjects in Lagos, Nigeria. Indian J Endocr Metab. 2016;20:189–94. doi: 10.4103/2230-8210.176345. http://dx.doi.org/10.4103/2230–8210.176345. [DOI] [PMC free article] [PubMed] [Google Scholar]
- 18.Ayesha I, Raghunath M, Sesikeran B, Raghuramulu N. Effect of oral administration of vitamin D on glucose tolerance and insulin secretion in type 2 diabetes mellitus. Diabetes Nutr Metab. 1998;11:261–5. [Google Scholar]
- 19.Barchetta I, Del Ben M, Angelico F, Di Martino M, Fraioli A, La Torre G, et al. No effects of oral vitamin D supplementation on non-alcoholic fatty liver disease in patients with type 2 diabetes: a randomized, double-blind, placebo-controlled trial. BMC Med. 2016;14:92. doi: 10.1186/s12916-016-0638-y. http://dx.doi.org/10.1186/s12916-016-0638-y. [DOI] [PMC free article] [PubMed] [Google Scholar]
- 20.Baziar N, Jafarian K, Shadman Z, Qorbani M, Khoshniat Nikoo M, Abd Mishani M. Effect of therapeutic dose of vitamin D on serum adiponectin and glycemia in vitamin D-insufficient or deficient type 2 diabetic patients. Iran Red Crescent Med J. 2014;16:e21458. doi: 10.5812/ircmj.21458. http://dx.doi.org/10.5812/ircmj.21458. [DOI] [PMC free article] [PubMed] [Google Scholar]
- 21.Breslavsky A, Frand J, Matas Z, Boaz M, Barnea Z, Shargorodsky M. Effect of high doses of vitamin D on arterial properties, adiponectin, leptin and glucose homeostasis in type 2 diabetic patients. Clin Nutr. 2013;32:970–5. doi: 10.1016/j.clnu.2013.01.020. http://dx.doi.org/10.1016/j.clnu.2013.01.020. [DOI] [PubMed] [Google Scholar]
- 22.Cavalcante R, Maia J, Mesquita P, Henrique R, Griz L, Bandeira MP, et al. The effects of intermittent vitamin D3 supplementation on muscle strength and metabolic parameters in postmenopausal women with type 2 diabetes: a randomized controlled study. Ther Adv Endocrinol Metab. 2015;6:149–54. doi: 10.1177/2042018815578998. http://dx.doi.org/10.1177/2042018815578998. [DOI] [PMC free article] [PubMed] [Google Scholar]
- 23.Dalan R, Liew H, Assam PN, Chan ES, Siddiqui FJ, Tan AW, et al. A randomised controlled trial evaluating the impact of targeted vitamin D supplementation on endothelial function in type 2 diabetes mellitus: the DIMENSION trial. Diab Vasc Dis Res. 2016;13:192–200. doi: 10.1177/1479164115621667. http://dx.doi.org/10.1177/1479164115621667. [DOI] [PMC free article] [PubMed] [Google Scholar]
- 24.Elkassaby S, Harrison LC, Mazzitelli N, Wentworth JM, Colman PG, Spelman T, et al. A randomised controlled trial of high dose vitamin D in recent-onset type 2 diabetes. Diabetes Res Clin Pract. 2014;106:576–82. doi: 10.1016/j.diabres.2014.08.030. http://dx.doi.org/10.1016/j.diabres.2014.08.030. [DOI] [PubMed] [Google Scholar]
- 25.Ghavamzadeh S, Mobasseri M, Mahdavi R. The effect of vitamin D supplementation on adiposity, blood glycated hemoglobin, serum leptin and tumor necrosis factor-alpha in type 2 diabetic patients. Int J Prev Med. 2014;5:1091–8. [PMC free article] [PubMed] [Google Scholar]
- 26.Grubler MR, Gaksch M, Kienreich K, Verheyen N, Schmid J, O Hartaigh B, et al. Effects of vitamin D supplementation on glycated haemoglobin and fasting glucose levels in hypertensive patients: a randomized controlled trial. Diabetes Obes Metab. 2016;18:1006–12. doi: 10.1111/dom.12709. http://dx.doi.org/10.1111/dom.12709. [DOI] [PubMed] [Google Scholar]
- 27.Jafari T, Faghihimani E, Feizi A, Iraj B, Javanmard SH, Esmaillzadeh A, et al. Effects of vitamin D-fortified low fat yogurt on glycemic status, anthropometric indexes, inflammation, and bone turnover in diabetic postmenopausal women: a randomised controlled clinical trial. Clin Nutr. 2016;35:67–76. doi: 10.1016/j.clnu.2015.02.014. http://dx.doi.org/10.1016/j.clnu.2015.02.014. [DOI] [PubMed] [Google Scholar]
- 28.Jorde R, Figenschau Y. Supplementation with cholecalciferol does not improve glycaemic control in diabetic subjects with normal serum 25-hydroxyvitamin D levels. Eur J Nutr. 2009;48:349–54. doi: 10.1007/s00394-009-0020-3. http://dx.doi.org/10.1007/s00394-009-0020-3. [DOI] [PubMed] [Google Scholar]
- 29.Kampmann U, Mosekilde L, Juhl C, Moller N, Christensen B, Rejnmark L, et al. Effects of 12 weeks high dose vitamin D3 treatment on insulin sensitivity, beta cell function, and metabolic markers in patients with type 2 diabetes and vitamin D insufficiency—a double-blind, randomized, placebo-controlled trial. Metab Clin Exp. 2014;63:1115–24. doi: 10.1016/j.metabol.2014.06.008. http://dx.doi.org/10.1016/j.metabol.2014.06.008. [DOI] [PubMed] [Google Scholar]
- 30.Kim HJ, Kang CK, Park H, Lee MG. Effects of vitamin D supplementation and circuit training on indices of obesity and insulin resistance in T2D and vitamin D deficient elderly women. J Exerc Nutrition Biochem. 2014;18:249–57. doi: 10.5717/jenb.2014.18.3.249. http://dx.doi.org/10.5717/jenb.2014.18.3.249. [DOI] [PMC free article] [PubMed] [Google Scholar]
- 31.Krul-Poel YH, Westra S, ten Boekel E, ter Wee MM, van Schoor NM, van Wijland H, et al. Effect of vitamin D supplementation on glycemic control in patients with type 2 diabetes (SUNNY trial): a randomized placebo-controlled trial. Diabetes Care. 2015;38:1420–6. doi: 10.2337/dc15-0323. http://dx.doi.org/10.2337/dc15-0323. [DOI] [PubMed] [Google Scholar]
- 32.Nasri H, Behradmanesh S, Maghsoudi AR, Ahmadi A, Nasri P, Rafieian-Kopaei M. Efficacy of supplementary vitamin D on improvement of glycemic parameters in patients with type 2 diabetes mellitus; a randomized double blind clinical trial. J Renal Inj Prev. 2013;3:31–4. doi: 10.12861/jrip.2014.10. http://dx.doi.org/10.12861/jrip.2014.10. [DOI] [PMC free article] [PubMed] [Google Scholar]
- 33.Nikooyeh B, Neyestani TR, Farvid M, Alavi-Majd H, Houshiarrad A, Kalayi A, et al. Daily consumption of vitamin D− or vitamin D+ calcium-fortified yogurt drink improved glycemic control in patients with type 2 diabetes: a randomized clinical trial. Am J Clin Nutr. 2011;93:764–71. doi: 10.3945/ajcn.110.007336. http://dx.doi.org/10.3945/ajcn.110.007336. [DOI] [PubMed] [Google Scholar]
- 34.Punthakee Z, Bosch J, Dagenais G, Diaz R, Holman R, Probstfield J, et al. Design, history and results of the Thiazolidinedione Intervention with vitamin D Evaluation (TIDE) randomised controlled trial. Diabetologia. 2012;55:36–45. doi: 10.1007/s00125-011-2357-4. http://dx.doi.org/10.1007/s00125–011–2357-4. [DOI] [PubMed] [Google Scholar]
- 35.Razzaghi R, Pourbagheri H, Momen-Heravi M, Bahmani F, Shadi J, Soleimani Z, et al. The effects of vitamin D supplementation on wound healing and metabolic status in patients with diabetic foot ulcer: a randomized, double-blind, placebo-controlled trial. J Diabetes Complicat. 2017;31:766–72. doi: 10.1016/j.jdiacomp.2016.06.017. [DOI] [PubMed] [Google Scholar]
- 36.Ryu OH, Lee S, Yu J, Choi MG, Yoo HJ, Mantero F. A prospective randomized controlled trial of the effects of vitamin D supplementation on long-term glycemic control in type 2 diabetes mellitus of Korea. Endocr J. 2014;61:167–76. doi: 10.1507/endocrj.ej13-0356. [doi: DN/JST.JSTAGE/endocrj/EJ13-0356, pii] [DOI] [PubMed] [Google Scholar]
- 37.Sadiya A, Ahmed SM, Carlsson M, Tesfa Y, George M, Ali SH, et al. Vitamin D supplementation in obese type 2 diabetes subjects in Ajman, UAE: a randomized controlled double-blinded clinical trial. Eur J Clin Nutr. 2014 doi: 10.1038/ejcn.2014.251. http://dx.doi.org/10.1038/ejcn.2014.251. [DOI] [PMC free article] [PubMed]
- 38.Shab-Bidar S, Neyestani TR, Djazayery A, Eshraghian MR, Houshiarrad A, Kalayi A, et al. Improvement of vitamin D status resulted in amelioration of biomarkers of systemic inflammation in the subjects with type 2 diabetes. Diabetes Metab Res Rev. 2012;28:424–30. doi: 10.1002/dmrr.2290. http://dx.doi.org/10.1002/dmrr.2290. [DOI] [PubMed] [Google Scholar]
- 39.Strobel F, Reusch J, Penna-Martinez M, Ramos-Lopez E, Klahold E, Klepzig C, et al. Effect of a randomised controlled vitamin D trial on insulin resistance and glucose metabolism in patients with type 2 diabetes mellitus. Horm Metab Res. 2014;46:54–8. doi: 10.1055/s-0033-1358453. http://dx.doi.org/10.1055/s-0033-1358453. [DOI] [PubMed] [Google Scholar]
- 40.Sugden JA, Davies JI, Witham MD, Morris AD, Struthers AD. Vitamin D improves endothelial function in patients with type 2 diabetes mellitus and low vitamin D levels. Diabet Med. 2008;25:320–5. doi: 10.1111/j.1464-5491.2007.02360.x. http://dx.doi.org/10.1111/j.1464-5491.2007.02360.x. [DOI] [PubMed] [Google Scholar]
- 41.Tabesh M, Azadbakht L, Faghihimani E, Tabesh M, Esmaillzadeh A. Effects of calcium-vitamin D co-supplementation on metabolic profiles in vitamin D insufficient people with type 2 diabetes: a randomised controlled clinical trial. Diabetologia. 2014;57:2038–47. doi: 10.1007/s00125-014-3313-x. http://dx.doi.org/10.1007/s00125–014-3313-x. [DOI] [PubMed] [Google Scholar]
- 42.Witham MD, Dove FJ, Dryburgh M, Sugden JA, Morris AD, Struthers AD. The effect of different doses of vitamin D(3) on markers of vascular health in patients with type 2 diabetes: a randomised controlled trial. Diabetologia. 2010;53:2112–9. doi: 10.1007/s00125-010-1838-1. http://dx.doi.org/10.1007/s00125-010-1838-1. [DOI] [PubMed] [Google Scholar]
- 43.Yiu YF, Yiu KH, Siu CW, Chan YH, Li SW, Wong LY, et al. Randomized controlled trial of vitamin D supplement on endothelial function in patients with type 2 diabetes. Atherosclerosis. 2013;227:140–6. doi: 10.1016/j.atherosclerosis.2012.12.013. http://dx.doi.org/10.1016/j.atherosclerosis.2012.12.013. [DOI] [PubMed] [Google Scholar]
- 44.Zhou W, Ye SD. Relationship between serum 25-hydroxyvitamin D and lower extremity arterial disease in type 2 diabetes mellitus patients and the analysis of the intervention of vitamin D. J Diabetes Res. 2015;2015:815949. doi: 10.1155/2015/815949. http://dx.doi.org/10.1155/2015/815949. [DOI] [PMC free article] [PubMed] [Google Scholar]
- 45.George PS, Pearson ER, Witham MD. Effect of vitamin D supplementation on glycaemic control and insulin resistance: A systematic review and meta-analysis. Diabet Med. 2012;29:E1;42–50. doi: 10.1111/j.1464-5491.2012.03672.x. http://dx.doi.org/10.1111/j.1464-5491.2012.03672.x. [DOI] [PubMed] [Google Scholar]
- 46.Sorkin JD, Vasaitis TS, Streeten E, Ryan AS, Goldberg AP. Evidence for threshold effects of 25-hydroxyvitamin D on glucose tolerance and insulin resistance in black and white obese postmenopausal women. J Nutr. 2014;144:734–42. doi: 10.3945/jn.114.190660. http://dx.doi.org/10.3945/jn.114.190660. [DOI] [PMC free article] [PubMed] [Google Scholar]
- 47.Powe CE, Evans MK, Wenger J, Zonderman AB, Berg AH, Nalls M, et al. Vitamin D-binding protein and vitamin D status of black Americans and white Americans. N Engl J Med. 2013;369:1991–2000. doi: 10.1056/NEJMoa1306357. http://dx.doi.org/10.1056/NEJMoa1306357. [DOI] [PMC free article] [PubMed] [Google Scholar]
- 48.Lips P. Worldwide status of vitamin D nutrition. J Steroid Biochem Mol Biol. 2010;121:297–300. doi: 10.1016/j.jsbmb.2010.02.021. http://dx.doi.org/10.1016/j.jsbmb.2010.02.021. [DOI] [PubMed] [Google Scholar]
- 49.Rajan S, Weishaar T, Keller B. Weight and skin colour as predictors of vitamin D status: results of an epidemiological investigation using nationally representative data. Public Health Nutr. 2016:1–8. doi: 10.1017/S1368980016000173. [doi:S1368980016000173 [pii] [DOI] [PMC free article] [PubMed] [Google Scholar]
- 50.Bolland MJ, Grey AB, Ames RW, Mason BH, Horne AM, Gamble GD, et al. The effects of seasonal variation of 25-hydroxyvitamin D and fat mass on a diagnosis of vitamin D sufficiency. Am J Clin Nutr. 2007;86:959–64. doi: 10.1093/ajcn/86.4.959. [doi:86/4/959, pii] [DOI] [PubMed] [Google Scholar]
Associated Data
This section collects any data citations, data availability statements, or supplementary materials included in this article.