Abstract
Reduced low-density lipoprotein receptor–related protein-1 (LRP1) expression in the liver is associated with poor prognosis of liver cirrhosis and hepatocellular carcinoma. Previous studies have shown that hepatic LRP1 deficiency exacerbates palmitate-induced steatosis and toxicity in vitro and also promotes high-fat diet–induced hepatic insulin resistance and hepatic steatosis in vivo. The current study examined the impact of liver-specific LRP1 deficiency on disease progression to steatohepatitis. hLrp1+/+ mice with normal LRP1 expression and hLrp1−/− mice with hepatocyte-specific LRP1 inactivation were fed a high-fat, high-cholesterol (HFHC) diet for 16 weeks. Plasma lipid levels and body weights were similar between both groups. However, the hLrp1−/− mice displayed significant increases in liver steatosis, inflammation, and fibrosis compared with the hLrp1+/+ mice. Hepatocyte cell size, liver weight, and cell death, as measured by serum alanine aminotransferase levels, were also significantly increased in hLrp1−/− mice. The accelerated liver pathology observed in HFHC-fed hLrp1−/− mice was associated with reduced expression of cholesterol excretion and bile acid synthesis genes, leading to elevated immune cell infiltration and inflammation. Additional in vitro studies revealed that cholesterol loading induced significantly higher expression of genes responsible for hepatic stellate cell activation and fibrosis in hLrp1−/− hepatocytes than in hLrp1+/+ hepatocytes. These results indicate that hepatic LRP1 deficiency accelerates liver disease progression by increasing hepatocyte death, thereby causing inflammation and increasing sensitivity to cholesterol-induced pro-fibrotic gene expression to promote steatohepatitis. Thus, LRP1 may be a genetic variable that dictates individual susceptibility to the effects of dietary cholesterol on liver diseases.
Keywords: lipoprotein receptor, liver metabolism, lipoprotein receptor-related protein (LPR), fibrosis, cholesterol metabolism, inflammation
Introduction
Nonalcoholic fatty liver disease (NAFLD)3 is rapidly emerging as a major health issue due to the increasing prevalence of obesity and insulin resistance worldwide (1). An estimated 17–30% of the Western population and 2–4% worldwide is inflicted with NAFLD today (2). Furthermore, NAFLD is anticipated to surpass hepatitis C as the leading cause for liver transplantation by 2020 (2). However, it is important to note that NAFLD describes a wide spectrum of liver diseases ranging from simple steatosis, which is benign, to liver steatosis with inflammation and fibrosis classified as nonalcoholic steatohepatitis (NASH). Only ∼10–20% of NAFLD cases proceed to NASH, and only 10–20% of NASH patients eventually progress into liver cirrhosis, which significantly increases the risk for hepatocellular carcinoma (1, 2). Steatosis is a prerequisite, but a second hit involving environmental and/or genetic factors is necessary for disease progression to NASH, liver cirrhosis, and hepatocellular carcinoma (3–5). Unfortunately, identifying NAFLD patients who are prone to proceed to NASH and liver cirrhosis proves to be difficult because the etiology and mechanism underlying the progression of NAFLD to NASH and liver cirrhosis remain unclear. Hence, better understanding of mechanisms and identification of genetic factors that modulate NAFLD disease progression are necessary to develop effective alternative therapies as well as reduce unnecessary liver transplants to conserve the limited number of healthy donor livers for subjects who have progressed to the end stage.
One recognized risk factor associated with increased risk of liver cirrhosis and cancer is high dietary cholesterol intake (3). A recent study also revealed an association between low levels of the LDL receptor–related protein-1 (LRP1) with poor prognosis of hepatocellular carcinoma, suggesting that LRP1 may be one genetic factor that regulates NAFLD progression (6). The LRP1 protein is a multifunctional receptor responsible for cellular uptake of lipid nutrients and plasma clearance of macromolecules, such as apolipoprotein E–containing lipoproteins and protease–protease inhibitor complexes. The protein also serves cell-regulatory functions via the integration of numerous signal transduction events (7–9). Hence, dysfunction of this receptor impacts the development and progression of a wide spectrum of diseases spanning from cardiovascular disease and obesity/diabetes to neurodegenerative disorders and tumor invasion and metastasis (7–9).
The mechanism underlying LRP1 modulation of disease risk varies in a tissue-specific manner. In the liver, LRP1 not only complements the LDL receptor for chylomicron remnant clearance, but its deficiency in hepatocytes also lowers plasma cholesterol levels when the animals are maintained on a low-fat, low-cholesterol chow diet due to reduction of high-density lipoprotein. Nevertheless, plasma triglyceride, nonesterified fatty acids (NEFA), glucose, and insulin levels are similar to those of hLrp1+/+ mice (10). Deficiency of LRP1 in hepatocytes also promotes lipid accumulation and lipotoxicity in response to excessive fatty acids through lysosomal–mitochondrial permeabilization and endoplasmic reticulum stress (11). Thus, mice with liver-specific LRP1 gene deletion (hLrp1−/− mice) exhibited robust dyslipidemia and hepatosteatosis secondary to hepatic insulin resistance when placed on a high-fat diet (12). However, liver disease in mice fed a high-fat diet without cholesterol supplementation is restricted to steatosis with minimal inflammation and fibrosis (13–15). These latter observations are consistent with human population studies illustrating that dietary fat with high-cholesterol intake, but not dietary fat alone, is a major risk factor for advanced liver disease (3). Hence, whether LRP1 deficiency accelerates progression of NAFLD to NASH remains unknown. The current study compared hLrp1+/+ and hLrp1−/− mice fed a high-fat, high-cholesterol diet to assess the importance of LRP1 expression in NASH progression.
Results
Hepatic LRP1 deficiency synergizes with dietary cholesterol to promote liver disease progression
When the animals were fed a 60% high-fat diet, the hLrp1−/− mice showed a ∼33% increase in hepatic triglyceride accumulation compared with that observed in hLrp1+/+ mice, indicating that hepatic LRP1 deficiency increased sensitivity to diet-induced hepatosteatosis (12). However, collagen 1 and collagen 3 expression levels were similar between hLrp1+/+ and hLrp1−/− mice after feeding the 60% high-fat diet. These results are consistent with previous reports that a high-fat diet without added cholesterol is insufficient and that excessive dietary cholesterol is necessary to promote hepatic inflammation and fibrosis in mice (13–15).
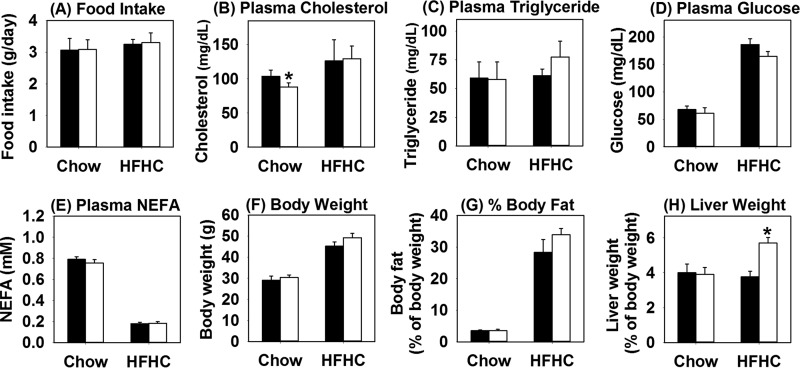
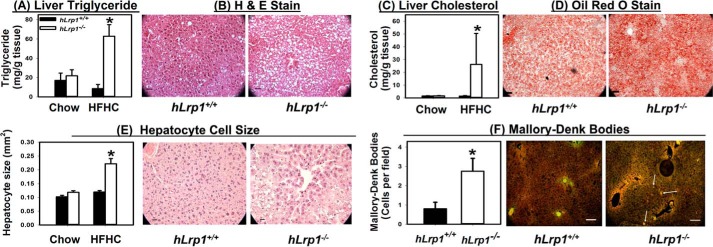
An additional study was performed to compare hLrp1+/+ and hLrp1−/− mice on a low-fat, low-cholesterol chow or a high-fat diet supplemented with 1.25% cholesterol (HFHC) to examine the influence of LRP1 and dietary cholesterol in progression of NAFLD to NASH. Both hLrp1+/+ and hLrp1−/− mice displayed similar food intake under both dietary conditions (Fig. 1A). In contrast to mice fed the low-fat, low-cholesterol chow or the high-fat diet without cholesterol supplementation (12), hLrp1+/+ and hLrp1−/− mice fed the HFHC diet displayed comparable plasma cholesterol and triglyceride levels (Fig. 1, B and C). Both hLrp1+/+ and hLrp1−/− mice showed similar increase in plasma glucose levels and reduction of plasma NEFA levels when fed the HFHC diet (Fig. 1, D and E). Body weight and fat content were also similarly increased in HFHC diet–fed hLrp1+/+ and hLrp1−/− mice (Fig. 1, F and G). However, significant hepatomegaly with a ∼50% increase in liver weight was observed in HFHC-fed hLrp1−/− mice compared with hLrp1+/+ mice (Fig. 1H). The increased weight of the hLrp1−/− mouse livers was due to robust triglyceride and cholesterol accumulation as well as a 2-fold increase in hepatocyte cell size (Fig. 2, A–E). Additionally, a 2-fold increase in the number of cells displaying keratin-containing Mallory–Denk bodies was observed in HFHC diet–fed hLrp1−/− mice compared with hLrp1+/+ mice (Fig. 2F).
Figure 1.
Hepatic LRP1 deficiency has minimal effects on plasma lipid levels but increases liver weight in response to high-fat high-cholesterol diet. The hLrp1+/+ (filled bars) and hLrp1−/− (open bars) mice were fed a low-fat, low-cholesterol chow diet or the HFHC diet for 16 weeks. Food intake was measured everyday over a 2-week period and averaged (A). Plasma cholesterol (B), triglyceride (C), glucose (D), and NEFA (E) levels were determined after an overnight fast. The body weight (F), fat content (G), and liver weight (H) were determined after 16 weeks on the HFHC diet. Data were reported as mean ± S.E. from 16 hLrp1+/+ mice and 14 hLrp1−/− mice. *, significant difference from hLrp1+/+ mice at p < 0.01.
Figure 2.
Hepatic LRP1 deficiency promotes steatosis, hepatomegaly, and Mallory–Denk body accumulation. Livers were excised from hLrp1+/+ (filled bars) and hLrp1−/− (open bars) mice after feeding a low-fat, low-cholesterol chow or the HFHC diet for 16 weeks. Hepatic steatosis was assessed after lipid extraction and quantification of triglycerides (A) and cholesterol (C) from eight liver samples from each group. Liver sections from HFHC-fed mice were also processed for histological staining. Representative images of hematoxylin and eosin (H&E)-stained sections showed the accumulation of lipid vacuoles (B), and Oil Red O–stained sections showed lipid accumulation (D) (right panels). E, the stained liver sections also revealed an increase in hepatocyte cell size (30–40 cells measured in each field). F, the liver sections were also used for immunofluorescence detection of keratin 8/18. Representative images are shown in the right panel, with white highlighting of selected cells with Mallory–Denk bodies. The number of cells with Mallory–Denk bodies were counted (from 16–20 mice in each group) and reported as a bar graph in the left panel. *, significant difference from hLrp1+/+ mice at p < 0.01. Scale bar in each image, 50 μm.
Hepatic LRP1 deficiency suppresses HFHC-induced expression of LXR-responsive genes
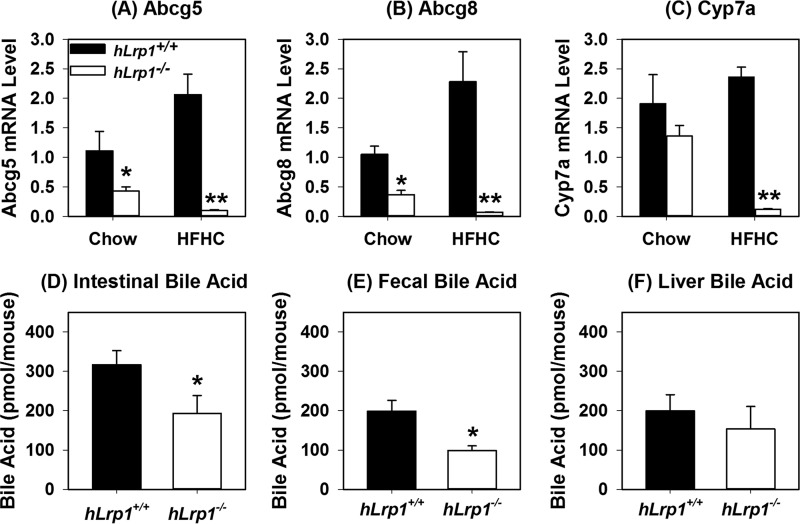
Previous studies have shown more triglyceride accumulation in the livers of hLrp1−/− mice compared with hLrp1+/+ mice due to reduced VLDL secretion (12). However, hepatic cholesterol levels were similar between high-fat–fed hLrp1+/+ and hLrp1−/− mice (12). To identify the mechanism by which the additional cholesterol in the diet also caused cholesterol accumulation in the livers of hLrp1−/− mice, we focused our attention on LXR-responsive genes that are known to be regulated by LRP1 in other cell types, including macrophages and smooth muscle cells (16, 17). Results showed that whereas hLrp1+/+ mice displayed increased hepatic expression of ABCG5 and ABCG8 after HFHC feeding, expression levels of these genes along with Cyp7a were significantly reduced in the livers of hLrp1−/− mice after HFHC feeding (Fig. 3, A–C). The reduction in Cyp7a that encodes cholesterol 7α-hydroxylase, the rate-limiting enzyme for cholesterol conversion to bile acids, also led to reduction of bile acid levels in the intestine and in the excrement of HFHC-fed hLrp1−/− mice (Fig. 3, D and E). However, bile acid levels in the liver were comparable between HFHC-fed hLrp1+/+ and hLrp1−/− mice (Fig. 3F). The hepatic bile acids in HFHC-fed hLrp1−/− mice may be derived from the alternative pathway (18). Because ABCG5 and ABCG8 are responsible for cholesterol excretion into the bile, their reduced expression along with decreased bile acids found in the intestine and feces indicated that the robust hepatic cholesterol accumulation observed in hLrp1−/− mice is due to reduced excretion of cholesterol and its metabolic products to the bile.
Figure 3.
LRP1 deficiency inhibits expression of representative LXR-responsive genes and reduces bile acid excretion by liver. Total cellular RNA was isolated from hLrp1+/+ (filled bars) and hLrp1−/− (open bars) mice after feeding the low-fat, low-cholesterol chow or HFHC diet for 16 weeks. The RNA was subjected to RT-qPCR analysis of representative LXR-responsive genes, including Abcg5 (A), Abcg8 (B), and Cyp7a (C). The expression levels were normalized to the levels of cyclophilin in each sample. Cyp7a activity was also assessed by measuring bile acid levels in intestine (D), feces (E), and liver (F) of HFHC-fed mice. The gene expression data represent the mean ± S.E. from 12 mice in each group. Bile acid levels were determined from tissues isolated from seven hLrp1+/+ and six hLrp1−/− mice. * and **, significant differences from hLrp1+/+ mice at p < 0.01 and p < 0.001.
Hepatic LRP1 deficiency does not affect autophagic flux
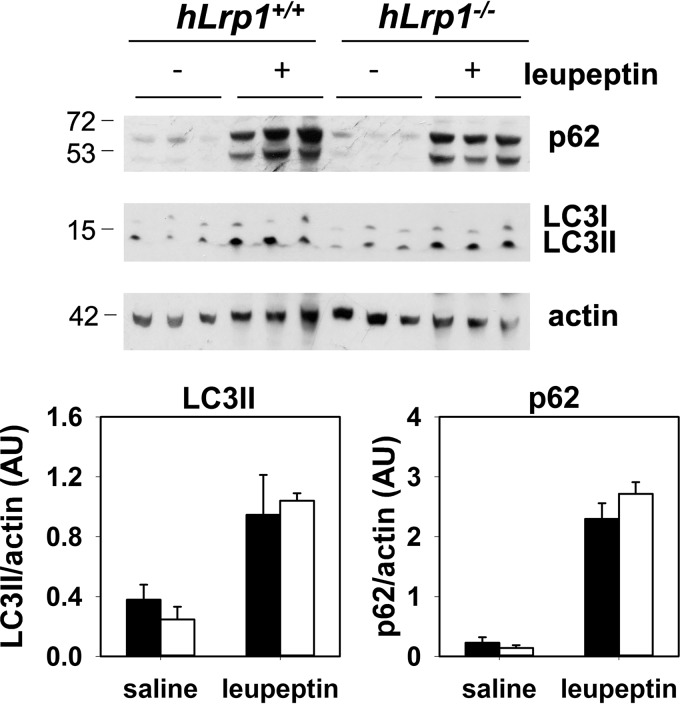
The underlying mechanism responsible for the excessive Mallory–Denk body accumulation in the livers of HFHC-fed hLrp1−/− mice was explored with a focus on the autophagy–lysosome pathway for degradation of protein aggregates (19). The comparison of autophagic flux in HFHC-fed hLrp1+/+ and hLrp1−/− mice showed that leupeptin-induced p62 and LC3II accumulation was similar between the two groups of mice (Fig. 4). These data suggested that the Mallory–Denk bodies accumulated in livers of HFHC-fed hLrp1−/− mice could not be explained by changes in autophagy activity but were probably the result of lysosomal defects due to LRP1 deficiency, as we have shown previously (11).
Figure 4.
Hepatic LRP1 deficiency does not affect autophagic flux. HFHC-fed hLrp1+/+ (filled bars) and hLrp1−/− (open bars) mice were fasted overnight before injection with saline or leupeptin (40 mg/kg). Livers were harvested from these animals after 4 h for Western blot analysis of p62 and LC3b using β-actin as loading control. Molecular size markers around the targeted protein bands are indicated in kDa. Expression levels were determined by densitometry and normalized to β-actin levels. The data represent the mean ± S.E. from three biological replicates.
Hepatic LRP1 deficiency accelerates HFHC-induced liver damage
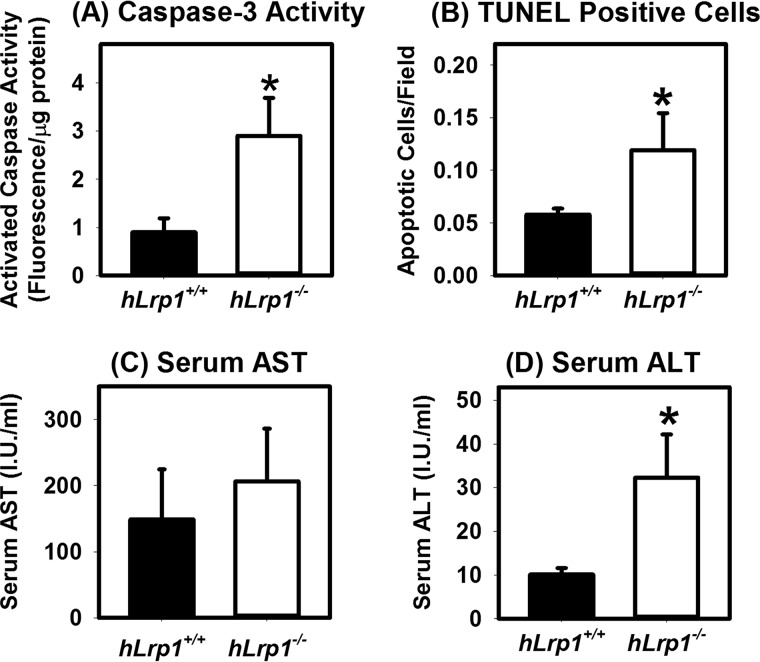
Our in vitro data also showed that LRP1-deficient hepatocytes were more susceptible to palmitate-induced lipotoxicity (11). Hence, we determined whether the hLrp1−/− mice are also more sensitive to HFHC diet-induced liver injury. For these experiments, caspase-3 activity was assessed in protein lysates prepared from HFHC diet-fed hLrp1+/+ and hLrp1−/− mice. Results showed a ∼3-fold elevation of activated caspase-3 in hLrp1−/− mouse livers (Fig. 5A). Consistent with these results was the detection of a ∼3-fold increase in the number of apoptotic cells in livers from hLrp1−/− mice compared with hLrp1+/+ mice (Fig. 5B). Although serum AST levels were higher in hLrp1−/− mice compared with hLrp1+/+ mice, these differences did not reach statistical significance (Fig. 5C). Nevertheless, the hLrp1−/− mice displayed ∼3-fold higher serum ALT levels compared with hLrp1+/+ mice (Fig. 5D). Taken together, these data indicated that hepatic LRP1 inactivation increases sensitivity to HFHC diet–induced liver damage.
Figure 5.
Hepatic LRP1 deficiency accelerates HFHC diet-induced liver cell death. The hLrp1+/+ (filled bars) and hLrp1−/− (open bars) mice were fed the HFHC diet for 16 weeks. A, caspase-3 activity was measured from liver extracts prepared from eight mice in each group. B, liver sections were stained with TUNEL reagents to identify apoptotic cells in each field (n = 20 mice in each group). Liver cirrhosis was estimated based on AST (C) and ALT (D) activities in serum of 14 mice in each group. The data represent mean ± S.E. *, significant difference from hLrp1+/+ mice at p < 0.01.
Hepatic LRP1 deficiency accelerates HFHC-induced liver inflammation
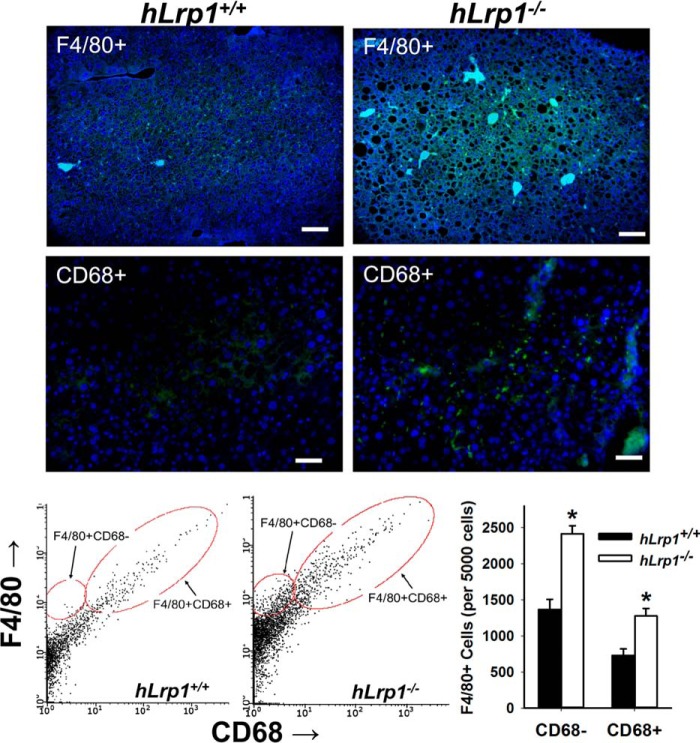
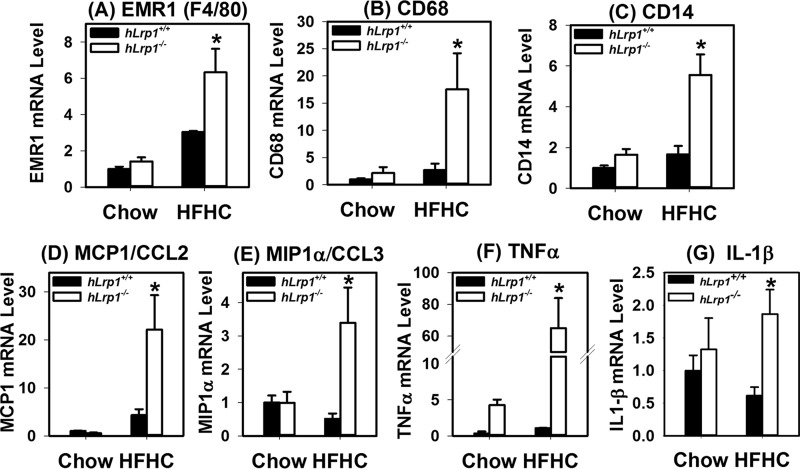
The increased liver injury observed in HFHC-fed hLrp1−/− mice is consistent with the hypothesis that hepatic LRP1 deficiency accelerates the progression of NAFLD to NASH. Indeed, immunofluorescence staining of liver sections prepared from HFHC-fed hLrp1+/+ and hLrp1−/− mice showed an increased number of F4/80+ cells as well as CD68+ cells in hLrp1−/− mice (Fig. 6). Flow cytometry analysis of nonparenchymal cells revealed an increase in both CD68− and CD68+ subsets of Kupffer cells/macrophages (Fig. 6), suggesting that both inflammatory cytokine and reactive oxygen production may be enhanced in the livers of hLrp1−/− mice (20). Additional experiments analyzing gene expression by quantitative RT-PCR showed that the HFHC diet increased F4/80 and CD68 mRNA levels in the livers of hLrp1−/− mice more dramatically compared with the increase observed in hLrp1+/+ mice (Fig. 7, A and B). The hLrp1−/− mouse livers also showed a higher CD14 expression level, indicative of increased lymphocytes in addition to the increase in Kupffer cells/macrophages (Fig. 7C). The increased presence of inflammatory cells in HFHC-fed hLrp1−/− mice is consistent with increased inflammation, as demonstrated by the elevated expression of inflammatory chemokines and cytokines, such as the monocyte chemoattractant protein-1 (MCP1/CCL2), the macrophage inflammatory protein (MIP1α/CCL3), tumor necrosis factor-α (TNFα), and interleukin-1β (IL-1β) (Fig. 7, D–G).
Figure 6.
Hepatic LRP1 deficiency promotes monocyte-macrophage infiltration into the liver. The hLrp1+/+ and hLrp1−/− mice were fed the HFHC diet for 16 weeks. Liver sections were prepared from these animals for immunofluorescence detection of F4/80 (top panels) and CD68+ cells (middle panels). The number of F4/80+ and CD68+ cells in the livers of hLrp1+/+ (filled bars) and hLrp1−/− (open bars) mice were also quantified by flow cytometry. The data represent mean ± S.E. *, significant difference from hLrp1+/+ mice at p < 0.01.
Figure 7.
Hepatic LRP1 deficiency increases inflammatory cell markers and cytokine expression. The hLrp1+/+ (filled bars) and hLrp1−/− (open bars) mice were fed the HFHC diet for 16 weeks. Total RNA was prepared from the livers of 24 hLrp1+/+ and 23 hLrp1−/− mice. Expression levels of EMR1 (F4/80 gene) (A), CD68 (B), CD14 (C), MCP1/CCL2 (D), MIP1α/CCL3 (E), TNFα (F), and IL-1β (G) genes were quantified by real-time PCR using cyclophilin mRNA levels as controls. The data represent mean ± S.E. *, significant difference from hLrp1+/+ mice at p < 0.01.
Hepatic LRP1 deficiency accelerates HFHC-induced liver fibrosis
The liver sections of HFHC diet–fed hLrp1+/+ and hLrp1−/−mice were also stained with Sirius Red to assess fibrosis. Whereas Sirius Red staining was observed only sporadically in hLrp1+/+ mouse livers, significant Sirius Red staining indicative of fibrosis was consistently observed in the portal triad region of hLrp1−/− mouse livers (Fig. 8, top panels). Immunofluorescence staining of smooth muscle α-actin also revealed more activated hepatic stellate cells in the livers of hLrp1−/− mice compared with hLrp1+/+ mice (Fig. 8, middle panels). These histology observations were corroborated with RT-PCR data showing increased expression of fibrotic genes, including collagen-1 and osteopontin (Fig. 8, bottom panels).
Figure 8.
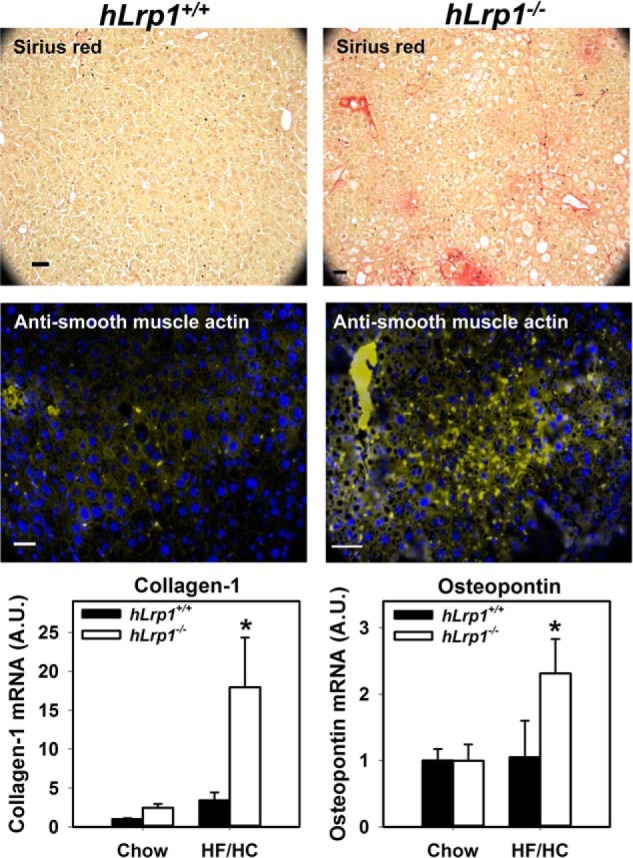
Hepatic LRP1 deficiency accelerates HFHC diet-induced liver fibrosis. The hLrp1+/+ and hLrp1−/− mice were fed the HFHC diet for 16 weeks. Top panels, representative liver sections stained with Sirius Red to visualize tissue fibrosis. Middle panels, representative liver section images stained with fluorescently labeled antibodies against smooth muscle α-actin to visualize activated hepatic stellate cells. Bottom panels, expression levels of representative fibrotic genes, such as collagen-1 and osteopontin, in livers of chow- and HFHC-diet fed hLrp1+/+ (filled bars) and hLrp1−/− (open bars) mice. The data represent mean ± S.E. from 24 chow-fed and 27 HFHC diet-fed mice in each group. *, significant difference from hLrp1+/+ mice at p < 0.01.
Hepatic LRP1 deficiency synergizes with cholesterol to activate the hedgehog signaling pathway in promotion of fibrosis
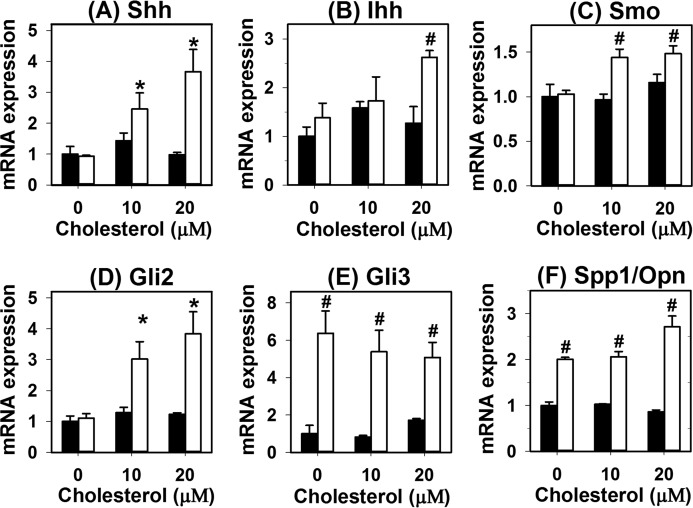
The underlying mechanism by which cholesterol enrichment and LRP1 dysfunction in hepatocytes promotes fibrosis was explored by incubating primary hepatocytes from hLrp1+/+ and hLrp1−/− mice with cholesterol in vitro. Results showed that cholesterol loading of hLrp1+/+ hepatocytes had minimal effects on expression of hedgehog pathway genes, whereas cholesterol loading of hLrp1−/− hepatocytes led to elevated expression of Sonic and Indian hedgehogs, smoothened, Gli2, and Gli3 (Fig. 9, A–E). Additionally, osteopontin expression was also found to be higher in hLrp1−/− hepatocytes compared with hLrp1+/+ hepatocytes in a manner that was independent of cholesterol loading (Fig. 9F). Because hedgehog pathway activation in hepatocytes has been shown to trans-activate fibrogenic genes in hepatic stellate cells (21, 22), these results suggested that the increased fibrosis observed in HFHC-fed hLrp1−/− mice was due to cooperative effects of cholesterol loading and LRP1 deficiency in activating hedgehog pathway genes in hepatocytes.
Figure 9.
LRP1 deficiency synergizes with cholesterol to activate hedgehog pathway gene expression in hepatocytes. Primary hepatocytes isolated from chow-fed hLrp1+/+ (filled bars) and hLrp1−/− (open bars) mice were cultured in the presence or absence of cholesterol for 16 h. Expression levels of sonic hedgehog (Shh) (A), Indian hedgehog (Ihh) (B), smoothened (SMO) (C), Gli2 (D), Gli3 (E), and osteopontin (Spp1/Opn) (F) were quantified by real-time PCR using cyclophilin mRNA levels as controls. The data represent mean ± S.E. from four biological replicates in each group. The level of gene expression in hLrp1+/+ hepatocytes without cholesterol enrichment was set at 1.0. * and #, significant differences from hLrp1+/+ hepatocytes without cholesterol enrichment at p < 0.05 and p < 0.01, respectively.
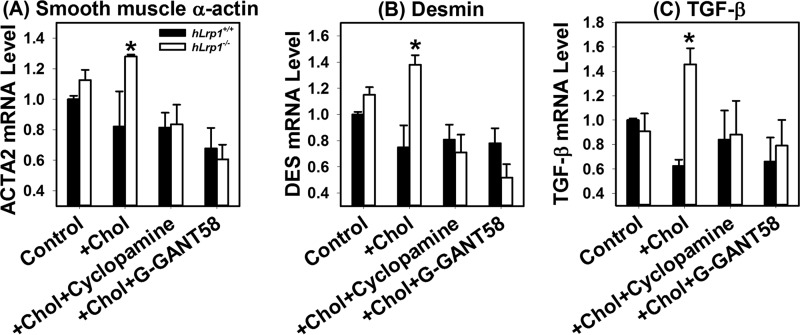
Additional experiments were performed to substantiate the hypothesis that sonic hedgehog pathway activation in cholesterol-loaded hLrp1−/− hepatocytes is responsible for the transactivation of hepatic stellate cells to cause fibrosis. In these experiments, conditioned media from hLrp1+/+ and hLrp1−/− hepatocytes incubated with or without 20 μm cholesterol for 16 h were added to HSC T6 hepatic stellate cells in culture. Cell activation was assessed by expression levels of smooth-muscle α-actin, desmin, and TGF-β mRNAs. Results showed no differences in expression levels of these stellate cell activation genes between hLrp1+/+ and hLrp1−/− hepatocytes under basal conditions. Cholesterol loading had minimal impact on expression of these genes in hLrp1+/+ hepatocytes, whereas their expression was significantly elevated in hLrp1−/− hepatocytes after cholesterol loading. Importantly, inhibition of hedgehog signaling by two distinct inhibitors, cyclopamine and GNAT-58, reduced the expression of smooth muscle α-actin, desmin, and TGF-β mRNA induced by cholesterol-loaded hLrp1−/− hepatocyte media to basal levels (Fig. 10).
Figure 10.
LRP1 and cholesterol loading in hepatocytes act synergistically to activate hepatic stellate cells via the sonic hedgehog pathway. Primary hepatocytes isolated from hLrp1+/+ (filled bars) and hLrp1−/− (open bars) mice were incubated without (control) or with 20 μm cholesterol (+ chol) for 16 h. Conditioned media from these cell cultures were added to the T6 hepatic stellate cells, and incubation was continued for an additional 24 h in the presence or absence of a 10 μm concentration of the hedgehog signaling inhibitor cyclopamine or GANT-58. Total cellular RNA was isolated for RT-qPCR analysis of smooth muscle α-actin (A), desmin (B), and TGF-β (C). The data were analyzed using cyclophilin mRNA levels as control. Expression levels observed when T6 cells were incubated with hLrp1+/+ hepatocyte conditioned medium in the absence of cholesterol were set as 1.0. The data represent mean ± S.E. from duplicate experiments, each performed with three biological replicate samples. *, significant differences at p < 0.05.
Discussion
Results of the current study showed that hepatic LRP1 deficiency accelerates HFHC diet–induced progression of NAFLD to NASH. Examination of liver histology revealed increased hepatic steatosis, inflammation, and fibrosis in HFHC diet–fed hLrp1−/− mice compared with similarly fed hLrp1+/+ mice. Additionally, hepatocyte cell size and liver weight were also significantly increased in hLrp1−/− mice. Interestingly, plasma cholesterol, triglyceride, and NEFA levels were not significantly different between hLrp1+/+ and hLrp1−/− mice after HFHC feeding. Thus, the accelerated pathology observed in the livers of hLrp1−/− mice is independent of plasma dyslipidemia and is most likely a result of aberrant intracellular lipid processing due to LRP1 deficiency in hepatocytes.
Similar to results reported previously when the mice were fed a 60% high-fat diet without cholesterol (12), no difference in plasma cholesterol levels was observed between HFHC-fed hLrp1+/+ and hLrp1−/− mice. However, in contrast to the earlier study, which showed lower plasma triglyceride levels in hLrp1−/− mice compared with hLrp1+/+ mice when fed the 60% high-fat diet (12), the current study showed that their plasma triglyceride levels were comparable when fed the HFHC diet. The different results most likely reflect differences in the composition of the diet used in the two studies. In particular, lard is the primary fat source in the 60% high-fat diet, whereas the HFHC diet contains primarily cocoa butter and soybean oil as the fat source. It is of note that a lard-based diet promotes hypertriglyceridemia due to elevated VLDL secretion in mice (23). Thus, the reduced secretion of VLDL in hLrp1−/− mice on a HFHC diet prevented the high-fat diet–induced VLDL secretion on the lard-based diet, leading to plasma triglyceride levels similar to that observed in chow-fed mice (12). In contrast, neither cocoa butter nor soybean oil increases plasma triglyceride levels in mice (23); hence, both hLrp1+/+ and hLrp1−/− mice displayed normal triglyceride levels despite the chronic feeding of the HFHC diet. Importantly, both the 60% high-fat diet and the HFHC diet resulted in significantly more triglyceride accumulation in the livers of hLrp1−/− mice compared with hLrp1+/+ mice. Thus, the results from the current HFHC diet study strengthened the conclusion of the earlier study with 60% high-fat diet that LRP1 expression in the liver is protective against diet-induced hepatic steatosis.
The current study showed that hepatic LRP1 deficiency also accelerates HFHC diet–induced liver disease progression with hepatocyte cell death, inflammation, and fibrosis that are hallmarks of NASH. Typically, HFHC diet–induced liver disease progression from simple steatosis toward inflammation and fibrosis in WT mice requires a prolonged feeding period of ≥30 weeks (15) but can be accelerated in genetically modified mouse models that are predisposed to severe hypercholesterolemia (13, 14). Interestingly, NASH development was observed in hLrp1−/− mice after only 16 weeks of HFHC feeding. Moreover, the accelerated NAFLD transition to NASH in hLrp1−/− mice was independent of plasma lipid levels but was related to a ∼10-fold increase in cholesterol accumulated in the livers of hLrp1−/− mice. As shown in Fig. 3, the robust cholesterol accumulation observed in the livers of hLrp1−/− mice is the result of synergism between excessive dietary cholesterol intake and the reduced expression of cholesterol excretion and bile acid synthesis genes as a consequence of LRP1 inactivation. Importantly, these results also indicated that intracellular cholesterol accumulation instead of plasma hypercholesterolemia may be the key determinant in HFHC diet–induced NAFLD transition to NASH. Excessive cholesterol has been shown to induce oxidative stress and exacerbates lipotoxicity in the liver to signal inflammatory macrophage infiltration (14). Cholesterol accumulating in hepatocytes also sensitizes mitochondria to inflammatory cytokine-induced injury, thereby perpetuating the vicious cycle of liver injury to promote tissue inflammation (24).
A second mechanism by which LRP1 deficiency accelerates liver inflammation may be due to the increased sensitivity of LRP1-deficient hepatocytes to steatosis-induced cell death. In previous studies, we showed that hepatic LRP1 deficiency impairs lipophagic lipid hydrolysis in the lysosomes, leading to the augmentation of palmitate-induced oxidative stress that ultimately results in cell death (11). In the current study, we showed the accumulation of Mallory–Denk bodies in hepatocytes of hLrp1−/− mice after HFHC feeding, indicating that LRP1 deficiency also impairs lysosomal degradation of protein aggregates. The combination of robust accumulation of cholesterol-rich lipid droplets and Mallory–Denk body protein aggregates increases hepatotoxicity, leading to increased immune cell infiltration and the accelerated inflammation observed in the livers of HFHC-fed hLrp1−/− mice.
In addition to liver inflammation, another hallmark of NAFLD transition to NASH is hepatic stellate cell activation and fibrosis. In this study, we showed that feeding an HFHC diet promotes liver fibrosis in hLrp1−/− mice, but fibrosis was sparingly observed in hLrp1+/+ mice during the 16-week time course of this study. The in vitro study revealed that cholesterol loading of hLrp1−/− hepatocytes induced expression of hedgehog pathway genes that are responsible for stellate cell activation (21). Whereas the excessive cholesterol accumulated in hLrp1−/− hepatocytes compared with that found in hLrp1+/+ hepatocytes may be responsible for induction of hedgehog pathway genes, it is likely that an additional mechanism(s) may be involved. It is of note that dietary promotion of NASH and hedgehog pathway induction has been attributed to elevated activity of the Hippo pathway transcriptional activator TAZ (22). In view of the recent reports linking Hippo signaling to liver size and hepatocellular carcinoma (25), the relationship between low LRP1 levels and hepatocellular carcinoma progression may also be due to TAZ activation in the absence of LRP1. Additional studies are warranted to test this possibility.
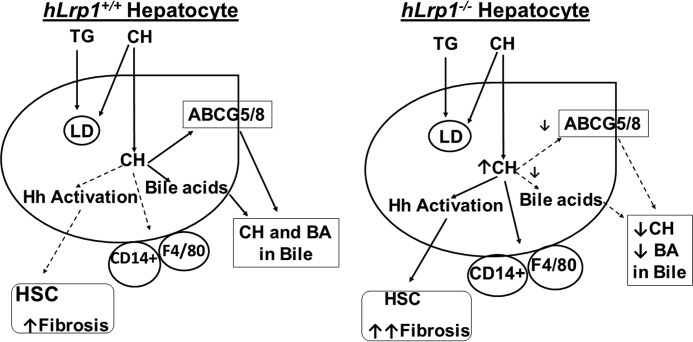
As summarized schematically in Fig. 11, results of the current study showed that dietary cholesterol and hepatic LRP1 deficiency act synergistically to promote the transition of NAFLD to NASH. The contributory role of LRP1 deficiency is probably mediated by excessive cholesterol-rich lipid droplets and protein aggregates accumulation to increase lipotoxicity and inflammation as well as induction of hedgehog pathway genes to activate hepatic stellate cells.
Figure 11.
Schematic summary of dietary triglyceride (TG) and cholesterol (CH) handling by hLrp1+/+ and hLrp1−/− hepatocytes. In normal hepatocytes, triglyceride and cholesterol are stored in lipid droplets (LD), and excessive cholesterol is excreted into the bile via ABCG5/8 as well as converted to bile acids (BA) for excretion. In hepatocytes with LRP1 deficiency, where ABCG5/8 and cyp7a expression is reduced, excessive cholesterol increases CD14+ and monocytes/macrophages/Kupffer (F4/80) cell activation, leading to liver inflammation. Excessive cholesterol in hLrp1−/− hepatocytes also promotes hedgehog (Hh) signaling activation, resulting in transactivation of hepatic stellate cells (HSC) with elevated fibrosis.
These results from mouse models are consistent with human epidemiology studies that have revealed dietary cholesterol consumption as an independent risk factor for liver cirrhosis and hepatocellular carcinoma (3) and revealed that low LRP1 levels are also associated with poor outcome of hepatocellular carcinoma after curative resection (6). Taken together, these results suggest that LRP1 expression level may be a genetic variable that dictates susceptibility of individuals to the effect of dietary cholesterol on liver diseases.
Experimental procedures
Antibodies
Antibodies against LRP1 were made in rabbits using peptide sequence corresponding to the C terminus of the 85-kDa subunit of human LRP1 and affinity-purified against the synthetic peptide antigen. Specificity of the LRP1 antibodies was verified based on reactivity with a single 85 kDa band on Western blotting with liver lysates from hLrp1+/+ mice with no reactivity detected with liver lysates from hLrp1−/− mice. All other antibodies as well as primers used in the current study were obtained commercially as listed in Tables 1 and 2.
Table 1.
Antibodies
| Antibody | Source | Catalog no. |
|---|---|---|
| F4/80 (immunofluorescence) | Abcam | Ab6640 |
| F4/80 (flow cytometry) | eBioscience | 25-4801-82 |
| CD68 (immunofluorescence) | Abcam | ab955 |
| CD68 (flow cytometry) | Abcam | ab53444 |
| LC3b | Novus Biologicals | NB 100-2220 |
| P62/SQSTM1 | Sigma | P0067 |
| Cytokeratin 8/18 | Abcam | ab53280 |
| Smooth muscle α-actin | Sigma | A2547 |
| Alexa Fluor 488–conjugated anti-rat IgG | Fisher | A11006 |
| Alexa Fluor 488–conjugated anti-mouse IgG | Invitrogen | A21202 |
| Alexa Fluor 488–conjugated anti-rabbit IgG | Molecular Probes | A-21206 |
| Alexa Fluor 594–conjugated anti-mouse IgG | Invitrogen | A21203 |
| Alexa Fluor 594–conjugated anti-rabbit IgG | Invitrogen | A21207 |
| Horseradish peroxidase–conjugated anti-rabbit IgG | Cell Signaling | 7074 |
Table 2.
PCR primers
| Primer | Sequence |
|
|---|---|---|
| Forward | Reverse | |
| EMR1 (F4/80) | TGTCTGACAATTGGGATCTGCCCT | ATACGTTCCGAGAGTGTTGTGGCA |
| CD68 | TTTCTCCAGCTGTTCACCTTGA | CCCGAAGTGTCCCTTGTCA |
| CD14 | CAGCCCTCTGTCCCCTCAA | TCTCCATCCCCGCGTTAC |
| MCP1/CCL2 | CTTCCTCCACCACCATGCA | CCAGCCGGCAACTGTGA |
| MIP1α/CCL3 | TTTGAAACCAGCAGCCTTTGCTCC | TCAGGCATTCAGTTCCAGGTCAGT |
| TNFα | ATCCGCGACGTGGAACTG | ACCGCCTGGAGTTCTGGA |
| IL-1β | CTACAGGCTCCGAGATGAACAC | TCCATTGAGGTGGAGAGCTTTC |
| Collagen-1 | CTTCACCTACAGCACCCTTGTG | TGACTGTCTTGCCCCAAGTTC |
| Osteopontin/ENPP1 | TGTTTCGGGTCATACCAGGTAAT | TTAATTCGACTTGCTGTGAATCCT |
| Cyclophilin | TCATGTGGCCAGGGTGGTGAC | CCATTCAGTCTTGGCAGTGC |
| Sonic hedgehog | CAGCGACTTCCTCACCTTCCT | AGCGTCTCGATCACGTAGAAGAC |
| Indian hedgehog | CCACCTTCAGTGATGTGCTTATTT | CGATGACCTGGAAAGCTCTCA |
| Smoothened | GAGGGTGGCCTGACTTTCTG | GAACTTGATGTTTTGTACCTCGTTTG |
| Gli2 | ATGAGAAACCCTACATCTGCAAGAT | GCGTCTGGCCCATGGA |
| Gli3 | ATGGGCACTTATCGGCAAGT | GAATGCGGAGCCTAAGCTTTG |
| α-Actin/ACTA2 | TCCTGACCCTGAAGTATCCGATA | GGTGCCAGATCTTTTCCATGTC |
| Desmin | AACCAGCCCTGAGCAAAGG | CATCCCGGGTCTCAATGG |
| TGFβ-1 | AGAAGTCACCCGCGTGCTA | TGTGTGATGTCTTTGGTTTTGTCA |
Animals and diets
Hepatocyte-specific LRP1-null (hLrp1−/−) mice were generated by cross-breeding Lrp1flox/flox mice on a C57BL/6J background (10, 26) with albumin promoter–driven recombinase transgenic mice on a C57BL/6J background (Jackson Laboratory, Bar Harbor, ME) as described previously (11). Age-matched Lrp1flox/flox mice littermates without the cre recombinase were used as hLrp1+/+ controls for all experiments. Adult male mice (12–18 weeks old) were fed a high-fat (20% by weight, 40% by calories) and high-cholesterol (1.25% by weight) (HFHC) Western-type diet (D12108C, Research Diets) for 16 weeks. All procedures and animal care techniques were approved by the University of Cincinnati institutional animal use and care committee.
Body composition and lipid measurements
Body weight measurements were performed biweekly, and body fat mass was measured in conscious mice using 1H magnetic resonance spectroscopy (EchoMRI-100, Echo-medical Systems) as described previously (27). Plasma was prepared from blood samples obtained from mice after an overnight fast. Plasma cholesterol, triglyceride, and NEFA were quantified by colorimetric assay kits (Thermo Electron Corp.). Serum ALT and AST were measured by enzymatic assay kits (Fisher, TR71121 and TR70121).
Liver tissue preparation and analysis
Mice were anesthetized and then perfused with 3 ml of 10% formalin in PBS. Liver tissues were then excised and weighed before storage in 10% formalin for 48 h before cryopreservation. Cryosections of 5-μm thickness were stained with hematoxylin and eosin for histological examination. Cryosections were also stained with Sirius Red (Abcam) to determine fibrosis. Immunofluorescence detection of antigens was performed with primary antibodies against F4/80, CD68, and smooth muscle α-actin, followed by secondary antibodies conjugated to Alexa Fluor 488 or 594. Immunohistological analysis of Mallory–Denk bodies was performed by staining with anti-cytokeratin 8/18 and visualized using a VectaStain Elite ABC kit (Vector). Additional cryosections were permeabilized to detect apoptotic cells with the TUNEL staining kit (Roche Diagnostics). All sections were counterstained with 4′,6-diamidino-2-phenylindole, and images were obtained with an Olympus BX61 microscope. Images were analyzed and quantified by ImageJ software.
Bile acid analysis
Bile acids were measured enzymatically using the mouse bile acid assay kit (80470, Crystal Chem) as described (28). Briefly, preweighed tissue and ground dried feces were extracted in 75% ethanol at 50 °C for 2 h. After centrifugation, 100 μl of the supernatant was then diluted with 400 μl of PBS for the assay.
Autophagic flux assay
Autophagic flux was measured in vivo as described by Haspel et al. (29). Briefly, HFHC-fed hLrp1+/+ and hLrp1−/− mice were fasted overnight before receiving an intraperitoneal injection of saline or leupeptin (40 mg/kg body weight) dissolved in saline. The mice were euthanized after 4 h, and livers were obtained and homogenized in buffer containing 10 mm Tris-HCl, pH 8.0, 5 mm EDTA, and 250 mm sucrose. Lysosome-enriched fractions were obtained by centrifugation for 10 min at 700 × g at 4 °C, followed by centrifugation of 2 mg of the homogenate for 30 min at 20,000 × g. The pellets were washed twice and solubilized in SDS gel sample buffer for analysis.
Flow cytometry
Mice were anesthetized, and livers were perfused with 10% Krebs–Henseleit buffer containing 0.5 mm EGTA before infusion with a digestion solution of Krebs–Henseleit buffer containing 125 units/ml collagenase (Sigma) and 2% BSA. The livers were excised and capsule-stripped in RPMI medium containing penicillin and streptomycin. The liver homogenates were sterile-filtered and then centrifuged to remove cell debris before pelleting hepatocytes and Kupffer cells by differential centrifugation at 90 × g and 300 × g, respectively. The remaining cells were plated in Dulbecco's modified Eagle's medium for 2 h and then detached with Accutase (Sigma) into flow cytometry buffer (Hanks' balanced salt solution containing 2% BSA and 0.1% sodium azide. The cells were incubated with conjugated anti-F4/80 or anti-CD68 with secondary antibodies conjugated to Alexa Fluor 488 and then analyzed using the Guava EasyCyteTM 8HT flow cytometry system (Millipore). Data were analyzed using Guava Incyte software (Millipore).
Western blots
Livers were perfused and then homogenized in ice-cold radioimmune precipitation assay buffer (Thermo Fisher Scientific) containing protease and phosphatase inhibitor mixture (Roche Diagnostics). Proteins in whole-cell lysates were resolved by SDS-PAGE and then transferred to polyvinylidene difluoride membranes (Bio-Rad). The membranes were blocked in Odyssey blocking buffer (LI-COR) with 0.1% Tween 20 for 1 h at 4 °C and then incubated for 90 min with a 1:1000 dilution of primary antibodies (Table 1). The membranes were washed and then incubated with horseradish peroxidase–conjugated secondary antibodies and visualized using enhanced chemiluminescence reagents (Pierce). Densitometry analysis was completed using ImageJ software.
Quantitative real-time RT-PCR
Livers were homogenized in Qiazol (Qiagen), centrifuged twice to remove lipid contents, and then subjected to Qiazol column purification of total cellular RNA. Reverse transcription was performed using an iScript kit (Bio-Rad), and PCR was performed on a Bio-Rad SyberOne RT-qPCR thermocycler using primers as indicated in Table 2.
Caspase activity
Mice were anesthetized using isoflurane, and livers were perfused with 3 ml of ice-cold PBS. Whole livers were excised and flash-frozen with liquid nitrogen. Tissue was thoroughly homogenized using buffer provided in the caspase activation kit (Pierce), and fluorescent caspase activity was determined via fluorescence at 496/520 nm. Sample fluorescence was normalized based on protein content (Life Technologies, Inc.).
Cholesterol enrichment of primary hepatocytes
Primary hepatocytes were isolated from hLrp1+/+ and hLrp1−/− mice as described previously (11). After plating in culture dishes for 4 h to achieve adhesion, the cells were treated with or without cholesterol-methyl-β-cyclodextrin (Sigma, catalogue no. C4951) in serum-free Williams medium for 16 h before harvesting for RNA isolation. Gene expression was assessed by quantitative RT-PCR as described above.
Hepatic stellate cell activation
Conditioned media were collected from hLrp1+/+ and hLrp1−/− hepatocytes after a 16-h incubation with or without 20 μm cholesterol-methyl-β-cyclodextrin and added to the T6 hepatic stellate cells for an additional 24-h incubation. The hedgehog inhibitors cyclopamine (Cayman Chemicals) and GANT-58 (Cayman Chemicals) were included in selected cultures at 10 μm concentrations. At the end of the incubation period, cellular RNA was isolated for RT-qPCR analysis.
Statistical analysis
Statistical analysis was performed using SigmaPlot version 13.0 software (SysStat Software, San Jose, CA). All data were expressed as mean ± S.E. Normality was examined using the Shapiro–Wilk test. Data with equal variance based on Levene's analysis were evaluated by Student's t test or analyzed by two-way analysis of variance. When analysis of variance demonstrated significant differences, individual mean differences were analyzed with the Student–Newman–Keuls test. Differences at p < 0.05 were considered statistically significant.
Author contributions
A. N. H. designed and conducted most of the in vivo experiments. S. C. designed and conducted the gene expression studies and the primary hepatocyte culture experiments. Y. D. and X. X. were responsible for analyzing fibrotic gene expression in mice fed the 60% high-fat diet. J. H. planned the high-fat diet studies and analyzed the data. A. J. participated in data analysis, interpreted the results, and assisted in experimental planning. D. Y. H. designed and conceptualized the project and the experimental approaches, analyzed the data, and wrote the paper.
This work was supported by National Institutes of Health Grants RO1 DK074932 (to D. Y. H.) and R37 HL63762, RO1 NS093382, and 1RF1 AG053391 (to J. H.) and by the Consortium for Frontotemporal Dementia Research and the Bright Focus Foundation. The authors declare that they have no conflicts of interest with the contents of this article. The content is solely the responsibility of the authors and does not necessarily represent the official views of the National Institutes of Health.
- NAFLD
- non-alcoholic fatty liver disease
- NASH
- non-alcoholic steatohepatitis
- LDL
- low-density lipoprotein
- LRP1
- LDL receptor related protein-1
- HFHC
- high-fat high-cholesterol
- NEFA
- nonesterified fatty acid(s)
- LXR
- liver X receptor
- ALT
- alanine aminotransferase
- AST
- aspartate aminotransferase
- CD68
- cluster of differentiation 68
- MCP1/CCL2
- monocyte chemoattractant protein-1/chemokine (C-C motif) ligand 2
- MIP1α/CCL3
- macrophage inflammatory protein 1-α/chemokine (C-C motif) ligand 3
- TNF
- tumor necrosis factor
- IL
- interleukin
- VLDL
- very low-density lipoprotein
- TUNEL
- terminal deoxynucleotidyltransferase-mediated dUTP nick-end labeling
- qPCR
- quantitative PCR.
References
- 1. Day C. P. (2011) Non-alcoholic fatty liver disease: a massive problem. Clin. Med. 11, 176–178 10.7861/clinmedicine.11-2-176 [DOI] [PMC free article] [PubMed] [Google Scholar]
- 2. Kneeman J. M., Misdraji J., and Corey K. E. (2012) Secondary causes of nonalcoholic fatty liver disease. Therap. Adv. Gastroenterol. 5, 199–207 10.1177/1756283X11430859 [DOI] [PMC free article] [PubMed] [Google Scholar]
- 3. Ioannou G. N., Morrow O. B., Connole M. L., and Lee S. P. (2009) Association between dietary nutrient composition and the incidence of cirrhosis or liver cancer in the United States population. Hepatology 50, 175–184 10.1002/hep.22941 [DOI] [PubMed] [Google Scholar]
- 4. Schutte K., Bornschein J., and Malfertheiner P. (2009) Hepatocellular carcinoma: epidemiological trends and risk factors. Dig. Dis. 27, 80–92 10.1159/000218339 [DOI] [PubMed] [Google Scholar]
- 5. Day C. P., and James O. F. (1998) Steatohepatitis: a tale of two hits. Gastroenterology 114, 842–845 10.1016/S0016-5085(98)70599-2 [DOI] [PubMed] [Google Scholar]
- 6. Huang X.-Y., Shi G.-M., Devbhandari R. P., Ke A.-W., Want Y., Wang X.-Y., Wang Z., Shi Y.-H., Xiao Y.-S., Ding Z.-B., Dai Z., Xu Y., Jia W.-P., Tang Z.-Y., Fan J., and Zhou J. (2012) Low level of low density lipoprotein receptor related protein 1 predicts an infavorable prognosis of hepatocellular carcinoma after curative resection. PLoS One 7, e32775 10.1371/journal.pone.0032775 [DOI] [PMC free article] [PubMed] [Google Scholar]
- 7. Herz J., Chen Y., Masiulis I., and Zhou L. (2009) Expanding functions of lipoprotein receptors. J. Lipid Res. 50, S287–S292 10.1194/jlr.R800077-JLR200 [DOI] [PMC free article] [PubMed] [Google Scholar]
- 8. Lillis A. P., Van Duyn L. B., Murphy-Ullrich J. E., and Strickland D. K. (2008) LDL receptor-related protein 1: Unique tissue-specific functions revealed by selective gene knockout studies. Physiol. Rev. 88, 887–918 10.1152/physrev.00033.2007 [DOI] [PMC free article] [PubMed] [Google Scholar]
- 9. May P., Woldt E., Matz R. L., and Boucher P. (2007) The LDL receptor related protein (LRP) family: an old family of proteins with new physiological functions. Ann. Med. 39, 219–228 10.1080/07853890701214881 [DOI] [PubMed] [Google Scholar]
- 10. Basford J. E., Wancata L., Hofmann S. M., Silva R. A., Davidson W. S., Howles P. N., and Hui D. Y. (2011) Hepatic deficiency of low density lipoprotein receptor related protein-1 reduces high density lipoprotein secretion and plasma levels in mice. J. Biol. Chem 286, 13079–13087 10.1074/jbc.M111.229369 [DOI] [PMC free article] [PubMed] [Google Scholar]
- 11. Hamlin A. N., Basford J. E., Jaeschke A., and Hui D. Y. (2016) LRP1 protein deficiency exacerbates palmitate-induced steatosis and toxicity in hepatocytes. J. Biol. Chem. 291, 16610–16619 10.1074/jbc.M116.717744 [DOI] [PMC free article] [PubMed] [Google Scholar]
- 12. Ding Y., Xian X., Holland W. L., Tsai S., and Herz J. (2016) Low density lipoprotein receptor related protein-1 protects against hepatic insulin resistance and hepatic steatosis. EBioMedicine 7, 135–145 10.1016/j.ebiom.2016.04.002 [DOI] [PMC free article] [PubMed] [Google Scholar]
- 13. Wouters K., van Gorp P. J., Bieghs V., Gijbels M. J., Duimel H., Lütjohann D., Kerksiek A., van Kruchten R., Maeda N., Staels B., van Bilsen M., Shiri-Sverdlov R., and Hofker M. H. (2008) Dietary cholesterol, rather than liver steatosis, leads to hepatic inflammation in hyperlipidemic mouse models of nonalcoholic steatohepatitis. Hepatology 48, 474–486 10.1002/hep.22363 [DOI] [PubMed] [Google Scholar]
- 14. Subramanian S., Goodspeed L., Wang S., Kim J., Zeng L., Ioannou G. N., Haigh W. G., Yeh M. M., Kowdley K. V., O'Brien K. D., Pennathur S., and Chait A. (2011) Dietary cholesterol exacerbates hepatic steatosis and inflammation in obese LDL receptor-deficient mice. J. Lipid Res. 52, 1626–1635 10.1194/jlr.M016246 [DOI] [PMC free article] [PubMed] [Google Scholar]
- 15. Savard C., Tartaglione E. V., Kuver R., Haigh W. G., Farrell G. C., Subramanian S., Chait A., Yeh M. M., Quinn L. S., and Ioannou G. N. (2013) Synergistic interaction of dietary cholesterol and dietary fat in inducing experimental steatohepatitis. Hepatology 57, 81–92 10.1002/hep.25789 [DOI] [PMC free article] [PubMed] [Google Scholar]
- 16. Xian X., Ding Y., Dieckmann M., Zhou L., Plattner F., Liu M., Parks J. S., Hammer R. E., Boucher P., Tsai S., and Herz J. (2017) LRP1 integrates murine macrophage cholesterol homeostasis and inflammatory responses in atherosclerosis. eLife 6, e29292 [DOI] [PMC free article] [PubMed] [Google Scholar]
- 17. Zhou L., Choi H. Y., Li W.-P., Xu F., and Herz J. (2009) LRP1 controls cPLA2 phosphorylation, ABCA1 expression and cellular cholesterol export. PLoS One 4, e6853 10.1371/journal.pone.0006853 [DOI] [PMC free article] [PubMed] [Google Scholar]
- 18. Ferrell J. M., Boehme S., Li F., and Chiang J. Y. (2016) Cholesterol 7α-hydroxylase-deficient mice are protected from high-fat/high-cholesterol diet-induced metabolic disorders. J. Lipid Res. 57, 1144–1154 10.1194/jlr.M064709 [DOI] [PMC free article] [PubMed] [Google Scholar]
- 19. Strnad P., Zatloukal K., Stumptner C., Kulaksiz H., and Denk H. (2008) Mallory-Denk-bodies: lessons from keratin-containing hepatic inclusion bodies. Biochim. Biophys. Acta 1782, 764–774 10.1016/j.bbadis.2008.08.008 [DOI] [PubMed] [Google Scholar]
- 20. Kinoshita M., Uchida T., Sato A., Nakashima M., Nakashima H., Shono S., Habu Y., Miyazaki H., Hiroi S., and Seki S. (2010) Characterization of two F4/80-positive cell subsets by their function and phenotype in mice. J. Hepatol. 53, 903–910 10.1016/j.jhep.2010.04.037 [DOI] [PubMed] [Google Scholar]
- 21. Verdelho Machado M., and Diehl A. M. (2016) Role of hedgehog signaling pathway in NASH. Int. J. Mol. Sci. 17, E857 10.3390/ijms17060857 [DOI] [PMC free article] [PubMed] [Google Scholar]
- 22. Wang X., Zheng Z., Caviglia J. M., Corey K. E., Herfel T. M., Cai B., Masia R., Chung R. T., Lefkowitch J. H., Schwabe R. F., and Tabas I. (2016) Hepatocyte TAZ/WWTR1 promotes inflammation and fibrosis in nonalcoholic steatohepatitis. Cell Metab. 24, 848–862 10.1016/j.cmet.2016.09.016 [DOI] [PMC free article] [PubMed] [Google Scholar]
- 23. Nishina P. M., Lowe S., Verstuyft J., Naggert J. K., Kuypers F. A., and Paigen B. (1993) Effects of dietary fats from animal and plant sources on diet-induced fatty streak lesions in C57BL/6J mice. J. Lipid Res. 34, 1413–1422 [PubMed] [Google Scholar]
- 24. Marí M., Caballero F., Colell A., Morales A., Caballeria J., Fernandez A., Enrich C., Fernandez-Checa J. C., and García-Ruiz C. (2006) Mitochondrial free cholesterol loading sensitizes to TNF- and Fas-mediated steatohepatitis. Cell Metab. 4, 185–198 10.1016/j.cmet.2006.07.006 [DOI] [PubMed] [Google Scholar]
- 25. Patel S. H., Camargo F. D., and Yimlamai D. (2017) Hippo signaling in the liver ergulates organ size, cell fate, and carcinogenesis. Gastroenterology 152, 533–545 10.1053/j.gastro.2016.10.047 [DOI] [PMC free article] [PubMed] [Google Scholar]
- 26. Rohlmann A., Gotthardt M., Hammer R. E., and Herz J. (1998) Inducible inactivation of hepatic LRP gene by Cre-mediated recombination confirms role of LRP in clearance of chylomicron remnants. J. Clin. Invest. 101, 689–695 10.1172/JCI1240 [DOI] [PMC free article] [PubMed] [Google Scholar]
- 27. Hofmann S. M., Zhou L., Perez-Tilve D., Greer T., Grant E., Wancata L., Thomas A., Pfluger P. T., Basford J. E., Gilham D., Herz J., Tschöp M. H., and Hui D. Y. (2007) Adipocyte LDL receptor-related protein-1 expression modulates postprandial lipid transport and glucose homeostasis in mice. J. Clin. Invest. 117, 3271–3282 10.1172/JCI31929 [DOI] [PMC free article] [PubMed] [Google Scholar]
- 28. Zhang J., Gupte J., Gong Y., Weiszmann J., Zhang Y., Lee K. J., Richards W. G., and Li Y. (2017) Chronic over-expression of fibroblast growth factor 21 increases bile acid biosynthesis by opposing FGF15/19 action. EBioMedicine 15, 173–183 10.1016/j.ebiom.2016.12.016 [DOI] [PMC free article] [PubMed] [Google Scholar]
- 29. Haspel J., Shaik R. S., Ifedigbo E., Nakahira K., Dolinay T., Englert J. A., and Choi A. M. (2011) Characterization of macroautophagic flux in vivo using a leupeptin-based assay. Autophagy 7, 629–642 10.4161/auto.7.6.15100 [DOI] [PMC free article] [PubMed] [Google Scholar]


