Abstract
Background
Cannabis sativa (hemp) is a source of various biologically active compounds, for instance, cannabinoids, terpenes and phenolic compounds, which exhibit antibacterial, antifungal, anti-inflammatory and anticancer properties. With the purpose of expanding the auxiliary application of C. sativa in the field of bio-nanotechnology, we explored the plant for green and efficient synthesis of gold nanoparticles (AuNPs) and silver nanoparticles (AgNPs).
Methods and results
The nanoparticles were synthesized by utilizing an aqueous extract of C. sativa stem separated into two different fractions (cortex and core [xylem part]) without any additional reducing, stabilizing and capping agents. In the synthesis of AuNPs using the cortex enriched in bast fibers, fiber-AuNPs (F-AuNPs) were achieved. When using the core part of the stem, which is enriched with phenolic compounds such as alkaloids and cannabinoids, core-AuNPs (C-AuNPs) and core-AgNPs (C-AgNPs) were formed. Synthesized nanoparticles were character-ized by UV–visible analysis, transmission electron microscopy, atomic force microscopy, dynamic light scattering, Fourier transform infrared, and matrix-assisted laser desorption/ionization time-of-flight. In addition, the stable nature of nanoparticles has been shown by thermogravimetric analysis and inductively coupled plasma mass spectrometry (ICP-MS). Finally, the AgNPs were explored for the inhibition of Pseudomonas aeruginosa and Escherichia coli biofilms.
Conclusion
The synthesized nanoparticles were crystalline with an average diameter between 12 and 18 nm for F-AuNPs and C-AuNPs and in the range of 20–40 nm for C-AgNPs. ICP-MS analysis revealed concentrations of synthesized nanoparticles as 0.7, 4.5 and 3.6 mg/mL for F-AuNPs, C-AuNPs and C-AgNPs, respectively. Fourier transform infrared spectroscopy revealed the presence of flavonoids, cannabinoids, terpenes and phenols on the nanoparticle surface, which could be responsible for reducing the salts to nanoparticles and further stabilizing them. In addition, the stable nature of synthesized nanoparticles has been shown by thermogravimetric analysis and ICP-MS. Finally, the AgNPs were explored for the inhibition of P. aeruginosa and E. coli biofilms. The nanoparticles exhibited minimum inhibitory concentration values of 6.25 and 5 µg/mL and minimum bactericidal concentration values of 12.5 and 25 µg/mL against P. aeruginosa and E. coli, respectively.
Keywords: Cannabis sativa, hemp, gold nanoparticles, silver nanoparticles, biofilm, nanotechnology, medicinal plant, ICP-MS, nanoparticle concentration, biomedical application, pathogenic strains
Introduction
Nano-biotechnology is an interdisciplinary research field involving biology, medicine and molecular engineering. Its aim is the production of biocompatible and environmentally safe nanoparticles for medical applications using green synthesis methodologies.1 In the production of biocompatible nanoparticles, the use of plants or microorganisms is increasingly being used, and nanoparticles from such “green synthesis” have been applied for drug and gene delivery and various medical treatments including antimicrobial, anticancer, anti-inflammatory, antiaging, antioxidant and anti-biofilm inhibition.2 Silver nanoparticles (AgNPs) have emerged as a promising candidate for the development of various antimicrobial products and applications. They have been used effectively in cases where antibiotics failed to act against multidrug-resistant microorganisms.3 This includes the production of medical tools and membranes to avoid biofilm formation. They have been implemented as nanofertilizers and nanopesticides.4 As they have been shown to be effective against infections, they have often been cited for their potential in novel nanomedicines.5,6 Likewise, gold nanoparticles (AuNPs) are very popular for their biocompatible nature and were recently applied for the identification of chemical and biological molecules, photo-imaging and photothermal therapy against cancer cells for control and treatment of many infectious diseases, such as inflammation and skin whitening.7,8 This increasing need for biocompatible nanoparticles requires new nanotechnology solutions for green synthesis of these metallic nanoparticles with biocompatible surfaces.
Green synthesis of metal nanoparticles is an economical, facile and environmentally benign approach. It not only eliminates utilization of industrial chemicals but also provides an active coating of biological residues on the nanoparticle surface.9,10 Importantly, these green synthesis methodologies, specifically plant-mediated, utilize water as a reducing medium, thereby reducing human exposure to other reducing agents. Functional groups (eg, hydroxyl groups) from green resources also play reductive roles in the formation of nanoparticles, while the strong interaction between biomolecules and nanoparticles helps in providing excellent stability to as-synthesized green nanoparticles. Phytonutrients play an active role in reducing and stabilizing metal nanoparticles as the sole or supplementary source of reducing power and stabilization.1 In addition to the nontoxic nature of the particle coating, green nanoparticles have the advantage of possessing enhanced biological activities for human medical applications due to the availability of active functional groups at the nanoparticle surface that can be exploited for the attachment of various biological molecules.11 For instance, flavonoids such as apigenin glycoside were extracted from Lawsonia inermis and used for the synthesis of AuNPs and AgNPs. These were attached to nascent nanoparticle through a carbonyl group, which was confirmed by Fourier transform infrared (FTIR) analysis.12 In this study, we set out to explore the potential of Cannabis sativa (hemp) to be used for green synthesis of AuNPs and AgNPs to medically fight infections caused by microbial biofilms.
Plants of the genus Cannabis are found in the northern hemisphere and produce more than 400 known secondary metabolites; more than 60 of which are cannabinoid compounds. The genus has two main subspecies: C. sativa and Cannabis indica.13 C. sativa is the tallest one with pale green thin leaves, and it is one of the fastest growing plants. It is very popular for industrial use due to its low but variable lignin content and enrichment with bast fibers. This makes the plant’s fibers applicable for producing textiles, paper, ropes, biofuel, biodegradable plastics, insulation, paint and animal feed. C. sativa plants have a higher content of psychoactive tetrahydrocannabinol (THC) compared with C. indica. During the past few decades, the plant has been increasingly used for medicinal treatments against various diseases such as inflammation, cancer, obesity, osteoporosis, multiple sclerosis, emesis, epilepsy, pain, glaucoma, anorexia, etc.14 The plant’s products have also been applied for the treatment of various neurodegenerative disorders (such as Tourette’s syndrome, Huntington’s disease, Alzheimer’s disease and Parkinson’s disease).15 The hemp components most commonly cited for their biomedical activity are the d-9-THC, cannabidiol, d-8-THC, cannabinol, cannabinoid and cannabinoid-related compounds. Besides the medical applications, the psychoactive properties of C. sativa are often misused. Regardless of the mild addiction to Cannabis and the possible effects in combination with other abusive substance, the therapeutic value of this plant is not negligible.
Microorganisms forming biofilms are the utmost concern for medical microbiology. Biofilms grow on both biological and nonbiological surfaces and are formed by structured consortia of microorganisms that can surround themselves by secreting a protective polymer layer consisting of polysaccharides, proteins and nucleic acids. This layer plays a critical role by restricting the antibiotics diffusion to the biofilm-producing cells and makes them antibiotic resistant. It has been found that bacterial cells growing within the biofilm secrete different surface molecules and virulence factors and show reduced growth rates, which enhances their pathogenicity by several 100-fold.16,17 Due to enhanced antibiotic resistance, the biofilm-producing microorganisms have emerged as a foremost public health concern by causing infections, such as pneumonia, fibrosis, osteomyelitis, periodontitis and many more. The biofilm-forming microorganisms can also grow on nonliving surfaces such as medical implants, urinary catheters, etc, and thus further contribute to infection. One of the current objectives of nanotechnology is developing nanoparticles, which are not only antimicrobial but also can cause biofilm inhibition.18,19 In this respect, AgNPs are very promising due to their high specific toxicity toward bacteria and low toxicity toward human beings.17 This in combination with their high surface area to volume ratio, surface charge density and very small and well-defined size and shape resulted in extensive interaction with the bacterial biofilms.20
In this study, C. sativa was applied for green synthesis of AuNPs and AgNPs. The objective was to combine the potential of this medicinal plant with the inherent antibacterial activity of AuNPs and AgNPs to develop a more effective treatment for bacterial biofilms.
Materials and methods
Materials
Analytical grade gold (III) chloride trihydrate (HAuCl4·3H2O) and silver nitrate (AgNO3) were purchased from Sigma-Aldrich Co. (St Louis, MO, USA).
C. sativa growth and harvest
C. sativa L USO-31 was cultivated in France near Paris (N 48.880°, E 3.040° [WGS84]) by the hemp cultivation company (Planète Chanvre, Meaux, France). The plants were sown on May 5, 2014, and fertilized with 80 kg/ha N, 45 kg/ha K and 45 kg/ha P. The plants were harvested after seed maturation on September 11, 2014, and air-dried at 40°C with an air flow of 150 m3/(m2 grid·hour) for 3 days as reported by Liu et al.21
Sample processing
Samples representing the whole stems were investigated after grinding. In general, hemp cortex (epidermis + fibers + cambium) was obtained from the individual stem samples by manual peeling off the stem surface. The woody core (xylem) represented the residual part. Crushing was performed in a microfine grinder (IKA, MF 10.1; IKA®-Werke GmbH, Staufen, Germany) to a particle size of 0.25 mm.
Chemical composition analysis of C. sativa source by high-performance liquid chromatography (HPLC)
Chemical analysis of the samples was measured using two-step sulfuric acid hydrolysis according to the method of the US National Renewable Energy Laboratory.21 First step was carried out using 72% H2SO4 for 1 h (30°C) with 100 g sample/L solution and subsequently diluted 30 times in water to 4% H2SO4 (w/w). The second step was conducted for 1 h at 121°C. After acid hydrolysis, the hydrolyzate was collected for monosaccharide analysis. Klason lignin content was gravimetrically determined as the residue of the hydrolysis, which was isolated by filtration, dried at 105°C and heated for 3 h at 550°C to convert into ash. The hydrolyzate concentrations of glucose formic acid and acetic acid were measured by HPLC.22 Shimadzu Corp. (Kyoto, Japan) equipment was used in the HPLC analysis (solvent delivery unit, LC-20AD, degasser, DGU-20A3, autosampler, SIL-20AC, system controller, SCL-10A, and column oven, CTO-10A). The column system consisted of an Aminex HPX-87H Ion Exclusion Column (300 × 8.7 mm; Bio-Rad Laboratories Inc., Hercules, CA, USA) and a security guard (H+) precolumn. The temperature was 63°C, the eluent was 4 mM H2SO4 and the flow rate was 0.6 mL/min. Detection was performed by a refractive index detector (RID-10A). The hydrolyzate concentrations of xylose, arabinose and galactose were measured by high performance anion exchange chromatography with pulsed amperometric detection analysis using an ion chromatography system-3000 system consisting of gradient pumps (model dual pump-1), an electrochemical detector/chromatography module (model DC-1) and an autosampler (Dionex Corp., Sunnyvale, CA, USA). Separation was achieved using a CarboPac™ PA20 (3 × 150 mm; ThermoFisher Scientific, Waltham, MA, USA) analytical column.21
Green synthesis of fiber-AuNPs (F-AuNPs), core-AuNPs (C-AuNPs) and core-AgNPs (C-AgNPs)
For the green synthesis of nanoparticles, the previously reported methodology was followed.23 The C. sativa was harvested, and the plant was separated into two parts as fibers and cores, which was further grinded separately. About 10 g of ground powder was boiled with sterile water maintaining 100 mL volume for 30 min to take out its aqueous extract. This aqueous extract was collected by filtration to completely remove the particulates. The aqueous extract was further purified by centrifugation at 8,000 rpm for 3 min to remove any fine suspended particles and finally obtained in liquid form, thus considered as a stock solution for synthesis. The crude extract was diluted in water at the ratio of 1:1 (extract to water). This diluted volume was used to synthesize AuNPs and AgNPs. For the nanoparticles synthesis, the optimized concentration of filter-sterilized metal salt solution (HAuCl4·3H2O and AgNO3) was used under optimized conditions. The synthesis was first monitored by visual color change of the reaction mixture, following spectral analysis. After the complete reduction in metal salt to nanoparticles, the nanoparticles were further purified by centrifugation at 2,000 rpm for 5 min, which allowed the removal of big particulates followed by the centrifugation at 14,000 rpm for 15 min to collect the fine nanoparticles.21 The obtained nanoparticles were washed thoroughly with distilled water to remove the unconverted metal ions or any other constituents. Finally, the nanoparticles were collected in the form of a pellet by air-drying, which was used for analytical characterization and in vitro biofilm inhibition application.
Characterization of nanoparticles
Ultraviolet (UV)–visible spectrophotometer (6,705 UV/visible spectrophotometer, Jenway; Cole-Parmer Ltd., Stone, UK) was used to confirm the reduction in metal ions into metal nanoparticles by scanning the reaction mixture in the range of 300–700 nm. The optimization studies were also conducted using UV–visible. The shape, size and nature of partially purified nanoparticles products were characterized by transmission electron microscopy (TEM) by FEI Tecnai T20 G2 instrument operated at 200 kV (FEI, Hillsboro, OR, USA). TEM was further used for analyzing the selected area electron diffraction (SAED) pattern of nanoparticles. The sample preparation was done following liquid spotting on carbon-coated copper grids, subsequently air-drying before transferring it to the microscope.9 The atomic force microscopy (AFM; Park NX20 from www.parkafm.com) measurements were carried out in intermittent contact mode using standard probes of single-crystal highly doped silicon with a radius of curvature of less than 30 nm (PointProbe Plus™ or SuperSharpSilicon™ Non-contact AFM probes from Nanosensors; NanoWorld AG, Neuchâtel, Switzerland). The standard uncertainty u(d) of the measured diameter is u(d)<0.05′d.
The particle size distribution and zeta potential of the nanoparticles were studied by using dynamic light scattering (DLS; Zetasizer Nano ZS; Malvern Panalytical Ltd., Malvern, UK). Hydrodynamic diameters and polydispersity index (PDI) were analyzed at 25°C. As a reference, a dispersive medium of pure water with a refractive index of 1.330, a viscosity of 0.8872 and a dielectric constant of 78.5 was used.18 The particles size and zeta potential of nanoparticles were conducted to measure the size distribution with a surface charge on nanoparticles.
Nanoparticles surface study by FTIR spectroscopy
The FTIR measurements were conducted on FTIR, Nicolet iS50 (Thermo Fisher Scientific, Waltham, MA, USA). The samples were prepared by air-drying the purified nanoparticles and scanned on FTIR over the range of 4,000–450 cm−1 at a resolution of 4 cm−1. FTIR analysis was performed to study the interactions between the functional groups present as a source of reducing and stabilizing agents on the surface of synthesized nanoparticles. The spectra recorded were plotted as transmittance (%) versus wave number (cm−1).7
Nanoparticles surface study by matrix-assisted laser desorption/ionization time-of-flight (MALDI-TOF) mass spectrometry
The presence of clusters and their composition on nano-particles surface was studied by using MALDI-TOF mass spectrometry; purified nanoparticles (1 µL) were loaded onto an AnchorChip™ target plate (Bruker Daltonik GmbH, Bremen, Germany), covered by 1 µL matrix solution (0.5 µg/µL 2,5-dihydroxybenzoic acid in 90% [v/v] acetonitrile, 0.1% [v/v] trifluoroacetic acid [TFA]) and washed with 0.5% (v/v) TFA. All the analyses were performed by MALDI-TOF mass spectrometer (Ultraflex II; Bruker Daltonik GmbH) in positive ion reflector modes with 1,000 laser shots per spectrum using Flex Control v3.4. Spectra were processed by Flex Analysis v3.0 (Bruker Daltonik GmbH), and mass calibration was performed using protein standards (tryptic digest of β-lactoglobulin, 5 pmol/µL).24
Detection and quantification of nanoparticles by single-particle inductively coupled plasma mass spectrometry (sp-ICP-MS)
ICP-MS was used for size fractionation and quantification of synthesized nanoparticles. Nanoparticles were measured in single particle mode (time-resolved analysis), sp-ICP-MS (NexION 350D; PerkinElmer Inc., Waltham, MA, USA). The dwell time was set to 50 µs and the scan time to 100 s. The particle size calculations were based on the calibration curve of the dissolved metal, which was matrix-matched with the samples (ie, prepared in the same medium). In brief, the signal intensity for the dissolved metal is correlated with the signal intensity of the particle, which allows calculations of particle mass and diameter, assuming that particles are spherical. The principle of the method together with equations has been described previously.25 The transport efficiency was calculated based on 60 nm particles (PerkinElmer Inc.), and the measurements were conducted in the same matrix used for experimental samples.
Nanoparticles stability
Nanoparticles stability has been studied by various perspectives, including a change in concentration of nanoparticles, thermal stability, pH and storage stability in water and medium (Luria-Bertani [LB] broth and tryptic soya broth [TSB]). For concentration stability, the nanoparticles concentration was measured for freshly prepared nanoparticles and after 2 weeks by sp-ICP-MS. Thermal stability of nanoparticles was determined by thermogravimetric analysis (TGA), for which the synthesis of AuNPs and AgNPs in powder form was performed on a Discovery TGA (TA Instruments, New Castle, DE, USA). For TGA, nanoparticles were placed in an alumina pan and heated from 20 to 700°C at a ramping time of 10°C/min. The nanoparticles stability was further studied by scanning the samples in the 300–700 nm range under the different ambient conditions. The nanoparticles were scanned before and after being kept for 1 week at room temperature. Next, the absorbance was measured for the sample solution mixed with sodium hydroxide (NaOH) to achieve the range of pH from 4 to 10 to address the nanoparticles stability.
Microorganisms and culture media
Escherichia coli UTI 89, Pseudomonas aeruginosa PAO1 and Staphylococcus epidermidis ATCC 35984 were used in this study. All the strains were tested to determine minimum inhibitory concentration (MIC) and minimum bactericidal concentration (MBC). Biofilms of E. coli and P. aeruginosa were further tested to demonstrate the antibiofilm activity of AgNPs. E. coli and P. aeruginosa were grown in LB, and S. epidermidis was grown in TSB.
MIC and MBC determination
MIC of AgNPs was determined by microdilution as described previously.26 Briefly, overnight grown culture of bacterial suspension was appropriately diluted, and 100 µL of diluted bacterial suspensions was mixed with a serial dilution of nanoparticles. The bacterial concentration in the mixtures was 1–2×10⁵ colony-forming unit (CFU)/mL, and the nanoparticles concentration ranged from 1.56 to 50 µg/mL in a series of twofold dilutions. The samples were incubated at 37°C for 24 h, and optical density (OD)550 (ie, bacterial growth) was measured. The MIC was defined as the lowest concentration of AgNPs which inhibited the bacterial growth. For defining the MBC, 100 µL of mixtures described earlier was streaked on agar plates and incubated at 37°C overnight. MBC value was defined as the lowest concentration of nanoparticles which prevented visible growth of bacteria on agar plates.
Biofilm inhibition assay
To determine the effect of AgNPs on bacterial biofilm inhibition, a 96-well microtiter plate was used. The overnight grown bacterial culture was diluted with respective medium to the final concentration of 1–2×10⁶ CFU/mL. This inoculum was added to the 96-well plate and incubated at 37°C for 5 h. After the incubation, the medium was replaced with a fresh medium containing different concentrations of AgNPs, and the samples were incubated at 37°C for further 19 h (bringing the total age of biofilm to 24 h). After 24 h, the medium was removed, and samples were gently washed two times to remove the planktonic state/free-floating bacteria and dried for 30 min at room temperature. The biofilms were stained with 0.1% of crystal violet for 20 min. The excessive stain was removed by washing with sterile water for five times, and biofilms were dried at room temperature for 1 h. Absolute ethanol (200 µL) was added to the stained biofilms, and samples were agitated vigorously for 15 min to extract the stain. The OD of extracted crystal violet was measured at 590 nm.
Biofilm cultivation and treatment with AgNPs
Biofilms of E. coli and P. aeruginosa were formed on 15 mm cover glass as described previously.27 Briefly, overnight grown bacterial culture was diluted with fresh LB to make final inoculum 2–5×10⁶ CFU/mL. About 300 µL of bacterial inoculum was loaded to 15 mm of cover glass and incubated at 37°C without any disruption of biofilm formation. After 24 h, the culture medium was replaced with fresh LB containing sterile water (negative control) or 1×MBC, 2×MBC, 4×MBC or 8×MBC of AgNPs and further incubated for 24 h. After the nanoparticle exposure, biofilms were collected in 5 mL of 0.89% of NaCl and homogenized by sonication. The homogenized bio-film suspension (100 µL) was serially diluted and plated on LB agar plates and incubated overnight at 37°C. The number of colonies was counted to determine the viability of bacterial cells (CFUs). To visualize the viable and dead cells, control biofilms and biofilms treated with AgNPs were stained for 20 min with a mixture of 6.0 µM SYTO 9 and 30 µM propidium iodide from a Live/Dead BacLight Viability kit L13152 (Thermo Fisher Scientific). Fluorescence microscopic imaging of the biofilms was performed using a Zeiss fluorescence microscope (Axio Imager.Z2m; Carl Zeiss Meditec AG, Jena, Germany). Scanning electron microscopy (SEM) analysis of biofilms was performed as described previously.28 Briefly, biofilms were fixed with 3% of glutaraldehyde for 2 h and dehydrated with graded series of ethanol concentrations (40%, 50%, 60%, 70%, 80% and 90% for 15 min each and with absolute ethanol for 20 min. The dehydrated biofilm samples were dried at room temperature for overnight and coated with gold before SEM imaging, which was performed with a Supra 60 VP microscope (Carl Zeiss Meditec AG).
Statistical analyses
All assays were performed for at least three biological replicates. Data are presented as mean ± standard deviation (SD). The intergroup differences were estimated by one-way analysis of variance, followed by a post hoc multiple comparisons (Tukey test). Values were considered statistically significant at P<0.05.
Results and discussion
Green synthesis of F-AUNPs, C-AUNPs and C-AgNPs
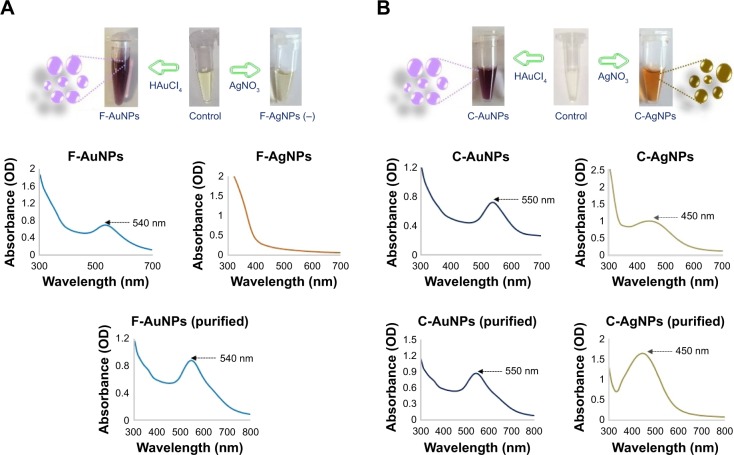
The plant powdered material used to make the aqueous extracts for nanoparticles synthesis has been analyzed by HPLC. This analysis revealed some differences between the hemp fibers and the core (Table 1). The C. sativa fibers have been found to possess a higher content of cellulose (57.5%), arabinan (1.2%) and minerals (2.9%), whereas the core material had a higher content of xylan (19.9%) and Klason lignin (23.9%) with no arabinan and minerals. For the green synthesis of AuNPs and AgNPs, the aqueous extracts of core and cortex (enriched with bast fibers) were incubated separately with respective metal salts at different conditions. For the C. sativa cortex extract, the F-AuNPs were synthesized successfully, as indicated by the change in color of the reaction mixture from light yellow to deep purple, which corresponds to the surface plasmon resonance property of the formed AuNPs (Figure 1A).29 For the silver nanoparticles, there was no color change despite the long incubation period, indicating that these nanoparticles were not produced (Figure 1A).30 The procedure was then carried out with the C. sativa core aqueous extract at high temperature, and this yielded both gold (C-AuNPs, deep purple) and silver nanoparticles (C-AgNPs, brown) in the respective reaction mixture (Figure 1B).31 This finding could be related to the data obtained by HPLC analysis of the plant material (Table 1), which suggests that high lignin and xylan content of the core extract could provide an advantage in reducing both AuNPs and AgNPs. This is in line with the published results suggesting that the higher content of lignin-related compounds such as phenolic compounds, alkaloids and cannabinoids of the core is also responsible for providing antibacterial properties. In addition, plant components containing flavonoids, polysaccharides, terpenoids, polyphenols, alkaloids, organic acids, amino acids and vitamins have significant roles in reducing, capping and stabilizing metals salts to nanoparticles.32
Table 1.
Compositional data
| Sample unit | Hemp fibers (g/100 g DM) | Hemp shives (g/100 g DM) |
|---|---|---|
| Glucan | 57.5 (0.5) | 42.9 (0.3) |
| Xylan | 1.6 (0.4) | 19.9 (2.4) |
| Arabinan | 1.2 (0.3) | 0.0 (0.0) |
| Galactan | 2.3 (0.4) | 0.5 (0.0) |
| Formic acid | 0.8 (0.0) | 0.6 (0.0) |
| Acetic acid | 2.0 (0.0) | 6.2 (0.0) |
| Klason lignin | 16.2 (0.6) | 23.9 (0.9) |
| Ash | 2.9 (0.1) | 0.0 (0.0) |
| Residuals | 15.5 (1.0) | 6.0 (2.5) |
Notes: Values are mean (standard deviation) for triplicates. Formic acid and acetic acid are identified after hydrolysis due to acetylation within the samples.
Abbreviation: DM, dry matter.
Figure 1.
Visible and UV–visible spectra of F-AuNPs and F-AgNPs (negative) (A), C-AuNPs and C-AgNPs (B).
Note: The purple and brownish colors with absorbance spectra at 540, 550 and 450 nm show the formation of gold and silver nanoparticles in the respective reaction mixture, since the color and absorbance are due to the SPR of synthesized nanoparticles.
Abbreviations: C-AgNPs, core–silver nanoparticles; C-AuNPs, core–gold nanoparticles; F-AgNPs, fiber-silver nanoparticles; F-AuNPs, fiber–gold nanoparticles; OD, optical density; SPR, surface plasmon resonance; UV, ultraviolet.
Next, the synthesis of nanoparticles was confirmed by a wavelength scan (300–700 nm) of the nanoparticles suspension. The literature suggests that the spectra in the range of 500–600 nm correspond to AuNPs and in the range of 350–500 nm correspond to AgNPs.33,34 For all types of nanoparticles, synthesis was successfully confirmed, both directly in suspension and with purified nanoparticles (Figure 1A and B).23
Optimization and kinetics of bioreduction of gold and silver ions into nanoparticles
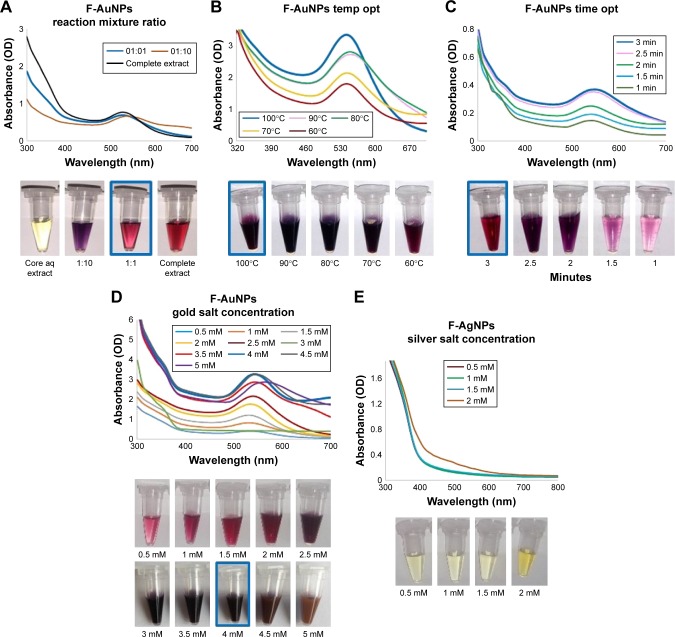
Reaction parameters such as reaction mixture ratio (plant aqueous to water), temperature, time and concentration of metal ions have been taken into consideration to evaluate the possibilities for complete and efficient synthesis of nanoparticles. At first, the reaction mixture ratio was optimized with respect to temperature, time and metal salt concentration (Figure 2). For the fiber extract samples, the optimization of reaction mixture ratio (ie, plant extract to water) for the production of F-AuNPs was conducted. The results demonstrated that 1:1 ratio of extract and water was optimal for economical synthesis of F-AuNPs (Figure 2A). Next, the temperature optimization was conducted. The results showed an optimal yield at 100°C, and in addition, the nanoparticles peak at this temperature was narrow, corresponding to lower polydispersity (Figure 2B). Further increase in temperature leads to degradation and precipitation in the reaction mixture, suggesting that nanoparticles are not stable and agglomerate at above 100°C. The time optimization studies revealed that 3 min were required for complete reduction in gold metal salt to metal nanoparticles. As shown in Figure 2C, the peaks corresponding to 2.5 and 3 min are close to overlapping, indicating that there was no significant accumulation of nanoparticles after 2.5 min. Next, we attempted to optimize gold salt concentration. The yield of nanoparticles increased continuously until reaching a maximum of 4 mM gold salt. At this concentration, the peak was almost narrow, indicating minimal loss in stability and nanoparticles agglomeration (Figure 2D). All the obtained spectra are in agreement with visual inspection of samples in tubes as shown in Figure 2. For AgNPs, F-AgNPs, it was attempted to increase the silver salt concentration up to 2 mM. No visible color difference or spectra appeared after scanning in UV–visible, confirming that hemp fiber extracts do not support the synthesis of AgNPs (Figure 2E).
Figure 2.
Optimization studies based on UV–visible spectral analysis for gold and silver nanoparticles production by C. sativa fiber extract.
Notes: The optimized parameters for F-AuNPs were as follows: reaction mixture ratio (extract:water) (A), temperature (B), time (C) and gold salt concentration (D). For F-AgNPs, an attempt was made to optimize silver salt concentration (E).
Abbreviations: aq, aqueous; C. sativa, Cannabis sativa; F-AgNPs, fiber-silver nanoparticles; F-AuNPs, fiber–gold nanoparticles; OD, optical density; temp opt, temperature optimization; UV, ultraviolet.
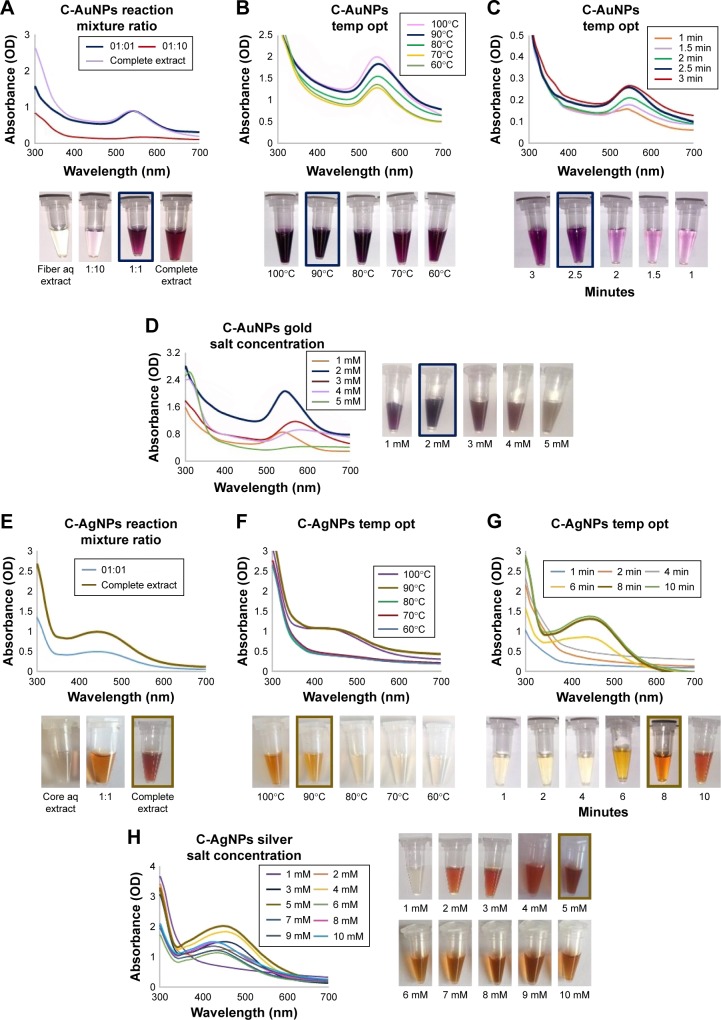
For the core extracts, C-AuNPs, the economically optimal extract:water ratio was also found to be 1:1 with a peak that was overlapping with the complete plant aqueous extract being used for synthesis (Figure 3A). Next, the temperature and time optimization were conducted, and the results suggested that 90°C and 2.5 min are optimal for gold salt reduction to C-AuNPs (Figure 3B and C). The gold salt concentration optimization results demonstrated that the 2 mM concentration was optimal for nanoparticles synthesis, and any change in concentrations resulted in decreased yield and broadening of the peak, ie, particle instability and agglomeration (Figure 3D). For C-AgNP optimization, the complete extract, without dilution, was the optimal synthesis medium (Figure 3E). The temperature and time optimization studies revealed that the 90°C and 8 min are optimal for C-AgNP formation (Figure 3F and G). For silver salt optimization, a range of salt concentration was tested from 1 to 10 mM with 5 mM as optimal concentration for AgNPs synthesis. Any further increase in salt concentration leads to a major shift in peak shift (Figure 3H). Thus, the optimal conditions have been identified for nanoparticles synthesis with all types of plant extract used, resulting in highest yield and minimal agglomeration.
Figure 3.
Optimization studies based on UV–visible spectral analysis for gold and silver nanoparticles production by C. sativa core extract.
Notes: The optimized parameters for C-AuNPs were as follows: the reaction mixture ratio (extract:water) (A), temperature (B), time (C) and gold salt concentration (D). The optimized parameters for C-AgNPs were as follows: the reaction mixture ratio (extract:water) (E), temperature (F), time (G) and silver salt concentration optimization (H).
Abbreviations: aq, aqueous; C-AgNPs, core–silver nanoparticles; C-AuNPs, core–gold nanoparticles; C. sativa, Cannabis sativa; OD, optical density; temp opt, temperature optimization; UV, ultraviolet.
Characterization of nanoparticles
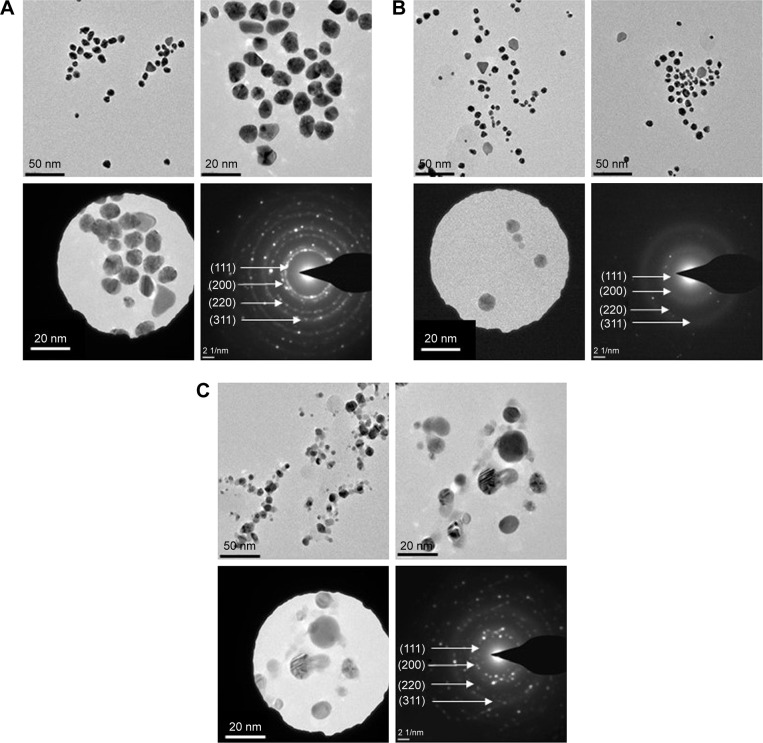
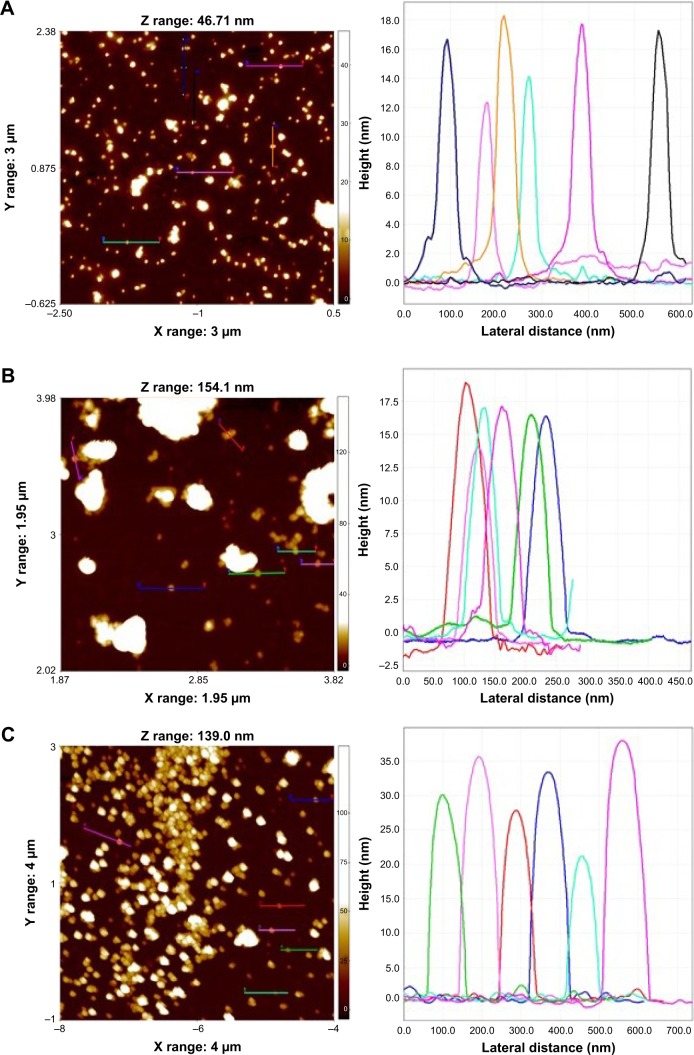
TEM observations confirmed the presence of quasi-spherical nanoparticles for F-AuNPs (Figure 4A), a majority of spherical with few triangular, rods and hexagonal-shaped nanoparticles for C-AuNPs (Figure 4B) and spherical nanoparticles for C-AgNPs (Figure 4C). The size of nanoparticles ranged from 12 to 20 nm for F-AuNPs and C-AuNPs, and it was 20–40 nm for C-AgNPs. The crystallinity of the biosynthesized nanoparticles was evaluated by SAED.35 The multiple electron diffraction patterns corresponded to the polycrystalline nature of the synthesized nanoparticles which conformed to lattice planes of Bragg’s reflection (111), (200), (220) and (311) planes (Figure 4).36 To complement the TEM analysis, which provides only a two-dimensional image of nanoparticles, AFM was performed, which allows three-dimensional profiling, ie, measurement of nanoparticles height (Figure 5). The AFM analysis showed that the particles such as F-AuNPs (Figure 5A) and C-AuNPs (Figure 5B) are in the range of 12–18 nm and for C-AgNPs in the range of 20–40 nm (Figure 5C). The results of AFM analysis were in close correlation with the TEM data.
Figure 4.
TEM images of F-AuNPs (A), C-AuNPs (B) and C-AgNPs (C) showing the particles shapes and SAED pattern with respective SAED apertures.
Note: The size of nanoparticles is 12–20 nm with crystalline nature.
Abbreviations: C-AgNPs, core–silver nanoparticles; C-AuNPs, core–gold nanoparticles; F-AuNPs, fiber–gold nanoparticles; SAED, selected area electron diffraction; TEM, transmission electron microscopy.
Figure 5.
The AFM analysis of nanoparticles which showed the particles average size for F-AuNPs (A) and C-AuNPs (B) is between 12–18 nm and for C-AgNPs (C) is in the range of 20–40 nm.
Notes: Each peak represents each single nanoparticle in the spectrum, chosen to measure the size of nanoparticles.
Abbreviations: AFM, atomic force microscopy; C-AgNPs, core–silver nanoparticles; C-AuNPs, core–gold nanoparticles; F-AuNPs, fiber–gold nanoparticles.
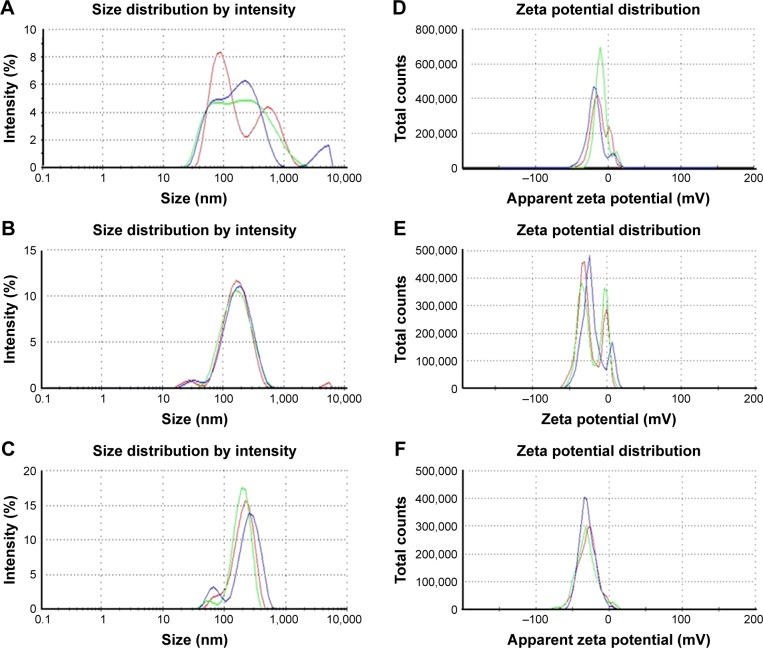
DLS analysis was performed to study the particles size distribution and zeta potential to determine their mean nanoparticle size (hydrodynamic diameter) and available surface charge on nanoparticles surface, which corresponded to their stability (Figure 6). The hydrodynamic diameter observed for F-AuNPs was 116.8 nm with a PDI of 0.48 (Figure 6A). For C-AuNPs, the hydrodynamic diameter was 143.7 nm with a PDI of 0.24 (Figure 6B). Finally, for C-AgNPs, the hydrodynamic diameter was 239.2 nm with a PDI of 0.43 (Figure 6C). The relatively high PDI is indicative of a low monodispersity index. All three nanoparticles types exhibited negative zeta potential: −12.3 for F-AuNPs, −20.6 for C-AuNPs and −29.2 for C-AgNPs (Figure 6D–F). High negative zeta potential values of this magnitude are indicative of nanoparticles, which carry sufficient surface charge to be electrostatically stabilized and resistant to spontaneous aggregation.37
Figure 6.
The particles size distribution with respect to the intensity of nanoparticles such as F-AuNPs (A), C-AuNPs (B) and C-AgNPs (C). Zeta potential analysis, which shows the surface charge on nanoparticles with respect to a total number of nanoparticles present in the solution for F-AuNPs (D), C-AuNPs (E) and C-AgNPs (F). The study has been performed in triplicate.
Note: The three different color lines simply show that the study has been done in triplicate, and the average is considered as result.
Abbreviations: C-AgNPs, core–silver nanoparticles; C-AuNPs, core–gold nanoparticles; F-AuNPs, fiber–gold nanoparticles.
Nanoparticles surface study
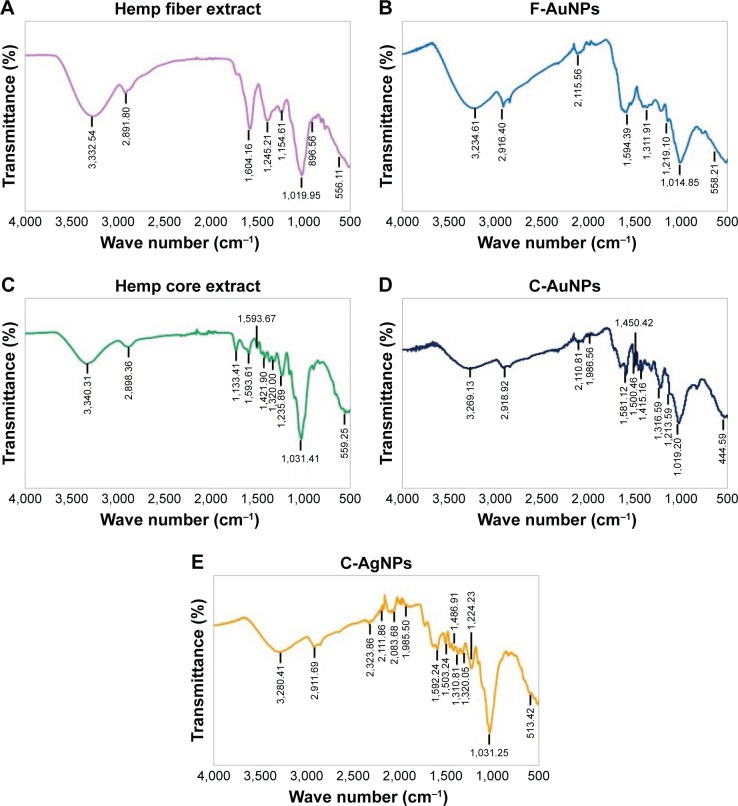
To acquire further information about the presence of biological compounds on the nanoparticles capping layer, FTIR measurements of all synthesized nanoparticles were carried out. The analysis of the FTIR spectrum of plant extracts and corresponding nanoparticles suggested extensive similarities between the samples. In particular, the spectra of C. sativa fiber extract and F-AuNPs are characterized by the O-H band at 3,332 and 3,234 cm−1, and the C-H stretching was observed between 2,897 and 2,916 cm−1. Moreover, C=C double-bond stretching at 1,604–1,594 cm−1 and C-O stretching at 1,019–1,014 cm−1 were detected in both samples (Figure 7A and B). Likewise, the spectra of C. sativa core extract, C-AuNPs and C-AgNPs revealed intense bands at 3,340, 3,269 and 3,280 cm−1, corresponding to O-H band stretching, 2,898, 2,918 and 2,917 cm−1 bands corresponding to C-H stretching and 1,421, 1,415 and 1,486 cm−1 band corresponding to CH3 and CH2 asymmetric deformation. The bands at 1,031, 1,019 and 1,031 cm−1 corresponded to C-O stretching (Figure 7C–E). The FTIR peaks of F-AuNPs, C-AuNPs and C-AgNPs suggested that phenolic compounds were likely to be responsible for the reduction in HAuCl4·3H2O and AgNO3 to AuNPs and AgNPs, respectively (Table 2). Water-soluble plant biomolecules and reducing sugars play major roles in reducing and capping agents in nanopar-ticle production. Terpenoids, which are a class of diverse organic polymers found in plants, have been suggested to be accountable for the reduction in silver and gold ions into nanoparticles.1,38 Similarly, flavonoids possess various functional groups, which are capable of reducing metal ions into nanoparticles.7,38 In previous studies, Geetha Bai et al showed that reduced graphene oxide-silver nanocomposite can be prepared using a green and facile one-step synthesis approach from the extract of a medicinal mushroom, Ganoderma lucidum. The active components present in the extract acted as a reducing agent to reduce the silver precursor into silver.39
Figure 7.
FTIR spectra of biosynthesized nanoparticles and plant extract for the identification of functional groups and interactions between molecules and the nanoparticle surfaces.
Note: FTIR spectra of (A) hemp fiber extract, (B) F-AuNPs, (C) hemp core extract, (D) C-AuNPs, and (E) C-AgNPs.
Abbreviations: C-AgNPs, core–silver nanoparticles; C-AuNPs, core–gold nanoparticles; F-AuNPs, fiber–gold nanoparticles; FTIR, Fourier transform infrared.
Table 2.
FTIR spectra of C. sativa plant material extracts and their respective nanoparticles
| Type of bond | Fiber extract wave number (cm−1) | F-AuNPs wave number (cm−1) |
|---|---|---|
| O-H stretch | 3,332.54 | 3,234.61 |
| C-H stretch | 2,897.80 | 2,916.40 |
| C=C stretch, C=O stretch | 1,604.76 | 1,594.39 |
| C-O stretch | 1,019.95 | 1,014.85 |
| C-C deformation | 556.77 | 558.21 |
| Type of bond | Core extract wave number (cm−1) | C-AuNPs wave number (cm−1) | C-AgNPs wave number (cm−1) |
|---|---|---|---|
| O-H stretch | 3,340.37 | 3,269.13 | 3,280.47 |
| C-H stretch | 2,898.36 | 2,918.92 | 2,917.69 |
| CH3, CH2 asymmetric deformation | 1,421.90 | 1,450.42, 1,415.76 | 1,486.91 |
| C-O stretch | 1,031.47 | 1,019.20 | 1,031.25 |
| C-C deformation | 559.25 | 444.59 | 513.42 |
Abbreviations: C-AgNPs, core–silver nanoparticles; C-AuNPs, core–gold nanoparticles; C. sativa, Cannabis sativa; F-AuNPs, fiber–gold nanoparticles; FTIR, Fourier transform infrared.
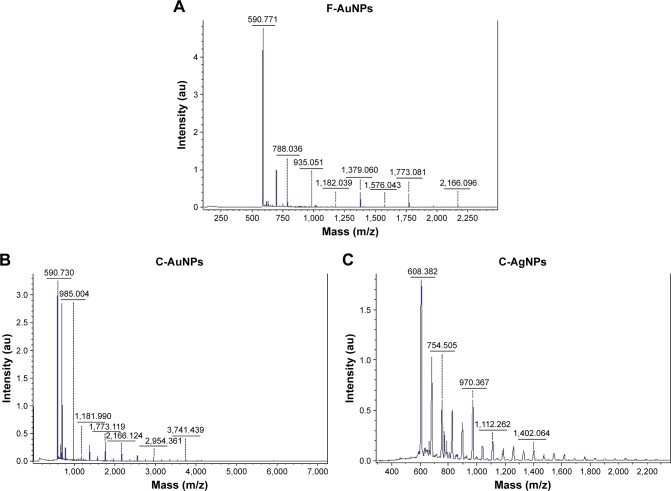
The mechanism behind the nanoparticles synthesis says that upon addition of metal salts to the plant extract solution at optimized conditions, the metal ions rapidly bind to the protein molecules available in the plant extract with functional groups (such as -OH and -COOH) and are entrapped. This leads to conformational changes in proteins and exposes its hydrophobic residues to aqueous phases. This causes the introductions of reducing agents from plant extracts and favors the transformations of entrapped metal into metal nanoparticles.11 In the case of C. sativa extracts used in this study, one could also assume that along with flavonoids and terpenoids, cannabinoids and water-soluble biomolecules play an important role as a reducing and stabilizing agent.11 Since the core extract that is enriched in lignin and cannabinoid compounds was capable of producing both AuNPs and AgNPs, unlike the fiber extracts that could only synthesize AuNPs, it could be assumed that lignin and cannabinoid compounds play a critical role for AgNPs reduction and stabilization. Finally, a MALDI-TOF analysis was performed to examine the protein content on nanoparticles surface.40 The MALDI-TOF spectral analysis was applied to confirm and further characterize the synthesized nanoparticles.24 The mass spectra show a series of intense single peaks in the range between 590 and 3,800 m/z (Figure 8A–C). For F-AuNPs and C-AuNPs, several peaks could be assigned to gold ions (197Au+, atomic weight 196.9666 u), specifically of higher silver cationic species, including 197Au3+ (calculated value 590.8997), 197Au4+ (787.8663), 197Au6+ (1,181.799), 197Au11+ (2,166.632), 197Au12+ (2,363.599), 197Au13+ (2,560.565), 197Au14+ (2,757.532), 197Au15 (2,954.498531), 197Au16+ (3,151.465) and 197Au17+ (3,348.432; Figure 8A and B). Silver is composed of two stable isotopes, ie, 107Ag and 109Ag, with 107Ag (atomic weight 107.8682 u) being the most abundant. For C-AgNPs, several peaks assigned to silver ions of higher cationic species were detected, such as 107Ag7+ (calculated value 755.0774), 107Ag9+ (970.8138), 107Ag11+ (1,186.5502), 107Ag13+ (1,402.2866) and 107Ag15+ (1,618.023; Figure 8C).24
Figure 8.
MALDI-TOF spectra for F-AuNPs (A), C-AuNPs (B) and C-AgNPs (C).
Notes: Ions identified in the spectra: F-AuNPs: 197Au3+ (calculated value 590.8997), 197Au4+ (787.8663), 197Au6+(1,181.799), 197Au11+ (2,166.632), 197Au12+ (2,363.599), 197Au13+ (2,560.565), 197Au14+ (2,757.532), 197Au15 (2,954.498531), 197Au16+ (3,151.465) 197Au17+ (3,348.432). C-AuNPs: 197Au3+ (calculated value 590.8997), 197Au6+ (1,181.799), 197Au11+ (2,166.632), 197Au13+ (2,560.565), 197Au16+ (3,151.465) 197Au17+ (3,348.432). C-AgNPs: 107Ag7+ (calculated value 755.0774), 107Ag9+ (970.8138), 107Ag11+ (1,186.5502), 107Ag13+ (1,402.2866), 107Ag15+ (1,618.023).
Abbreviations: C-AgNPs, core–silver nanoparticles; C-AuNPs, core–gold nanoparticles; F-AuNPs, fiber–gold nanoparticles; MALDI-TOF, matrix-assisted laser desorption ionization time-of-flight.
Nanoparticle stability study
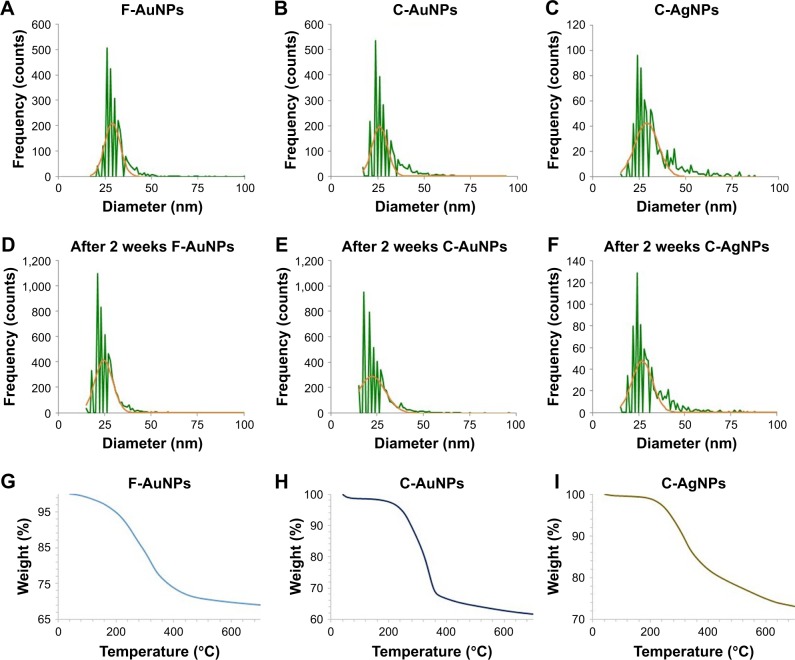
Sp-ICP-MS measurements were conducted to determine nanoparticles concentration and size distribution in the samples. The measured particle number concentrations were 77, 83 and 26 billion particles/mL, corresponding to total mass concentrations of 0.7, 4.5 and 3.6 mg/mL for F-AuNPs, C-AuNPs and C-AgNPs, respectively. The dissolved fraction was negligible (<0.1 ppb). The mean particle diameter was 30 nm for both AuNP types and 34 nm for C-AgNPs (Figure 9A–C). The measurements were repeated after 1 week, and the results indicated minor decrease in particles sizes, resulting in mean diameters of 26, 25 and 31 nm for F-AuNPs, C-AuNPs and C-AgNPs, respectively (Figure 9D–F), which indicated that the nanoparticles have highly stable for up to 1 week preservation. The particle number concentration stayed nearly the same after 1 week for C-AgNPs (25 billion parts/mL), and the storage time also had no effect on AgNP dissolution. However, for both AuNP types, the particle number concentration increased after 1 week, resulting in 165 and 153 billion parts/mL for F-AuNPs and C-AuNPs, respectively.
Figure 9.
ICP-MS measurement of F-AuNPs (A), C-AuNPs (B) and C-AgNPs (C) of freshly prepared nanoparticles, which shows the size distribution histogram. ICP-MS measurement after 2 weeks of nanoparticles incubation to analyze the nanoparticles stability for F-AuNPs (D), C-AuNPs (E) and C-AgNPs (F), respectively. The dwell time was set to 50 µs and the scan time to 100 s. TGA measurement of F-AuNPs (G), C-AuNPs (H) and C-AgNPs (I), which shows the complete nanoparticles degradation at high temperature.
Abbreviations: C-AgNPs, core–silver nanoparticles; C-AuNPs, core–gold nanoparticles; F-AuNPs, fiber–gold nanoparticles; ICP-MS, inductively coupled plasma mass spectrometry; TGA, thermogravimetric analysis.
The stability of F-AuNPs, C-AuNPs and C-AgNPs was further confirmed by keeping the purified nanoparticles solution for different time intervals up to 1 month at room temperature. There was no significant shift in the UV–visible spectrum of the nanoparticles solution even after a month, which revealed the nanoparticles stability in the aqueous system. The stability was further confirmed in LB broth and TSB medium in a difference of 2 weeks, and results suggested that the spectra appears in the same line after 2 weeks also; thus, the nanoparticles are stable in bacteriological media as well (Figure S1). In addition, the effect of pH change in the range of 4-10 pH was studied. The nanoparticles solution was observed before and after the addition of NaOH. In results, there was no major change in the wavelength, which further supports the particles stability.18 Second, TGA was conducted to measure the thermal stability and weight loss as a function of temperature. Figure 9 demonstrates the weight loss profiles of F-AuNPs (Figure 9G), C-AuNPs (Figure 9H) and C-AgNPs (Figure 9I) with respect to increasing temperature. The complete degradation of nanoparticles between 200 and 400°C indicates the actual organic phase materials adsorbed on the nanoparticles surface. With continued increase in temperature up to 700°C, nanoparticles degrade completely.23
Biofilm inhibition by nanoparticles
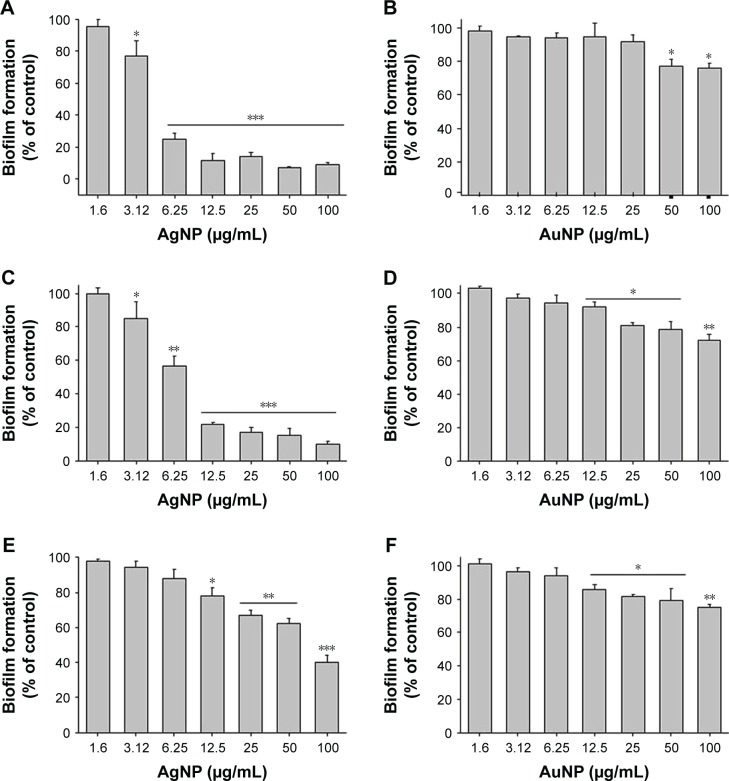
The physicochemical factors of nanoparticles such as size, shape, capping layer, functional groups and surface area to volume ratio play an important role in nanoparticle effect on the living cells. They affect initial nano–bio-interfacial interactions, particles adhesion on cell membrane/surface and their cellular uptake or direct penetration inside the cells. A combination of these effects ultimately results in either biocompatibility or cytotoxicity.41 The bacteriostatic and bactericidal effects of synthesized nanoparticles have been screened by the determination of MIC and MBC against P. aeruginosa, E. coli and S. epidermis. In primary screening, AgNPs showed a strong antibacterial activity with the MIC concentration of 6.25 and 12.5 µg/mL and the MBC concentration of 12.5 and 25 µg/mL against P. aeruginosa and E. coli, respectively. It has been suggested that this antibacterial property of AgNPs is dependent on their unique size and shape, and biological moieties present on the nanoparticles’ surfaces.42 Interestingly, the AgNPs did not exhibit an inhibitory effect against S. epidermidis at concentrations below 50 µg/mL. AuNPs were nontoxic for the tested strains. In previous studies, it has been shown that even sub-MIC concentration of nanoparticles could inhibit biofilm formation by preventing attachment of bacteria to the surface.43 In this study, the effect of a wide range of concentrations (1.6–100 µg/mL) of both AgNPs and AuNPs on biofilm formation, ie, initial attachment of bacteria, is shown in Figure 10. As expected, AgNPs showed strong inhibitory effect against the biofilm formation for all the tested bacterial strains even at sub-MIC level (Figure 10A and C and E).44 Results obtained from MIC, MBC and biofilm formation assays suggest that the Gram-negative bacteria (E. coli and P. aeruginosa) are more sensitive to our nanoparticles than the Gram-positive (S. epidermidis) (Table 3). This is consistent with previous observations.45 The major reason underpinning this difference in sensitivity to AgNPs is the different cell envelope composition. Gram-positive bacteria have a thick cell wall with negatively charged peptidoglycan, which prevents the penetration of these nanoparticles, resulting in weaker antibacterial effect.46 By contrast, Gram-negative bacteria have a thinner cell wall and a double cell membrane, which is more prone to get penetrated by nanoparticles, making these bacterial cells more susceptible to treatment.47
Figure 10.
Effect of gold and silver nanoparticles on bacterial biofilm formation.
Notes: P. aeruginosa (A and B), E. coli (C and D) and S. epidermidis (E and F). About 24 h biofilms were formed on cover glass. The biofilms were washed with sterile water and stained with 0.1% of crystal violet for 20 min. Excess crystal violet was washed with sterile water. The biofilm-staining crystal violet was dissolved with absolute ethanol, and OD was measured at 590 nm. Data are presented as mean ± SD error. *P<0.005, **P<0.0005 and ***P<0.0001.
Abbreviations: AgNP, silver nanoparticle; AuNP, gold nanoparticle; E. coli, Escherichia coli; OD, optical density; P. aeruginosa, Pseudomonas aeruginosa; SD, standard deviation; S. epidermidis, Staphylococcus epidermidis.
Table 3.
MIC and MBC of C-AgNPs
| Bacteria | MIC (µg/mL) | MBC (µg/mL) |
|---|---|---|
| P. aeruginosa PA01 | 6.25 | 12.5 |
| E. coli UTI89 | 12.5 | 25 |
| S. epidermidis | >50 | >50 |
Note: The MIC and MBC of gold nanoparticles are >50 µg/mL against the abovementioned bacteria.
Abbreviations: C-AgNPs, core–silver nanoparticles; E. coli, Escherichia coli; MBC, minimum bactericidal concentration; MIC, minimum inhibitory concentration; P. aeruginosa, Pseudomonas aeruginosa; S. epidermidis, Staphylococcus epidermidis.
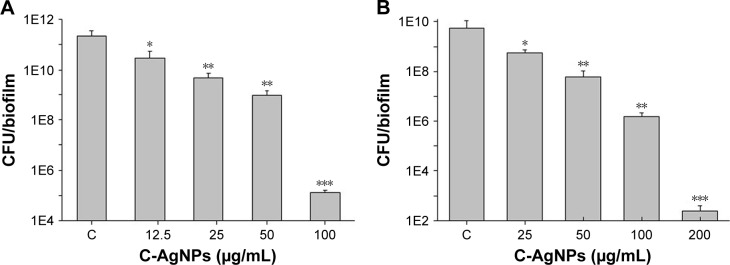
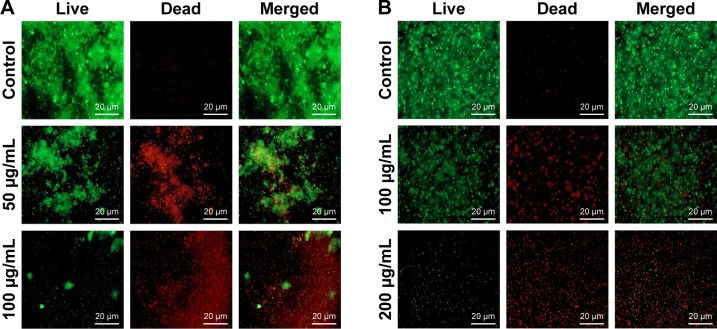
Mature biofilms are quite impenetrable to most antibacterial agents and, thus, represent a major cause of various chronic infections that are resistant to antibiotics. The effect of our AgNPs against the matured, established biofilms of E. coli and P. aeruginosa were therefore tested. A strong anti-biofilm effect of AgNPs was observed for the bacterial strains, measured as a decrease in the number of viable bacteria in correlation with increasing concentration of nanoparticles (Figure 11). A similar trend of decrease in the number of viable cells was observed up to 4×MBC, whereas a more drastic drop in viability occurred at 8×MBC concentration of nanoparticles. To verify the results obtained by CFU counting with an independent method, biofilms were stained with live/dead fluorescence probe and observed under fluorescence microscope. The representative images are shown in Figure 12. A drastic decrease in the density of biofilms was observed in nanoparticle-treated biofilms as well as the appearance of dead cells, confirming the pronounced destabilization effect of AgNPs against both bacterial strains. To visualize any morphological changes in biofilm cells after nanoparticle treatment, biofilms were examined with SEM (Figure 13). The results showed that significant morphological changes occurred after treatment with 100 and 200 µg/mL of AgNPs. Both strains had uneven cell surface, suggesting cell lysis (Figure 13A and B). Silver ions are possibly released from nanoparticles that adhere to cell membranes and damage the bacteria. Thus, the toxicity of nanoparticle was corroborated by extensive damage to the cell membrane and cell shrinkage. The size of nanoparticles plays a crucial role in their antimicrobial activity, since smaller nanoparticles are more easily internalized through cell membranes.48 The small size of C-AgNPs (20-40 nm) allows them to easily enter the cells and damage them. In addition, the particles with small size provide greater surface area to interact with microorganisms and release Ag+ via oxidation. This increases reactive oxidative species generation, which generates further damage to cellular components, ultimately resulting in death.49
Figure 11.
Biofilms were grown for 24 h without any disturbance.
Notes: (A) Pseudomonas aeruginosa; (B) Escherichia coli. After 24 h, old culture medium was replaced with different concentrations of C-AgNPs containing fresh medium and incubated for another 24 h. After 24 h of nanoparticles treatment, biofilms were homogenized by sonication and plated on agar plates for CFU counting. Data are presented as mean ± SD error. *P<0.005, **P<0.0005 and ***P<0.0001.
Abbreviations: C-AgNPs, core–silver nanoparticles; CFU, colony-forming unit; SD, standard deviation.
Figure 12.
Biofilms were grown for 24 h without any disturbance.
Notes: (A) Pseudomonas aeruginosa; (B) Escherichia coli. After 24 h, old culture medium was replaced with different concentrations of C-AgNPs containing fresh medium and incubated for another 24 h. After 24 h of nanoparticles treatment, biofilms were stained with live/dead staining and observed by using fluorescence microscopy.
Abbreviation: C-AgNPs, core–silver nanoparticles.
Figure 13.
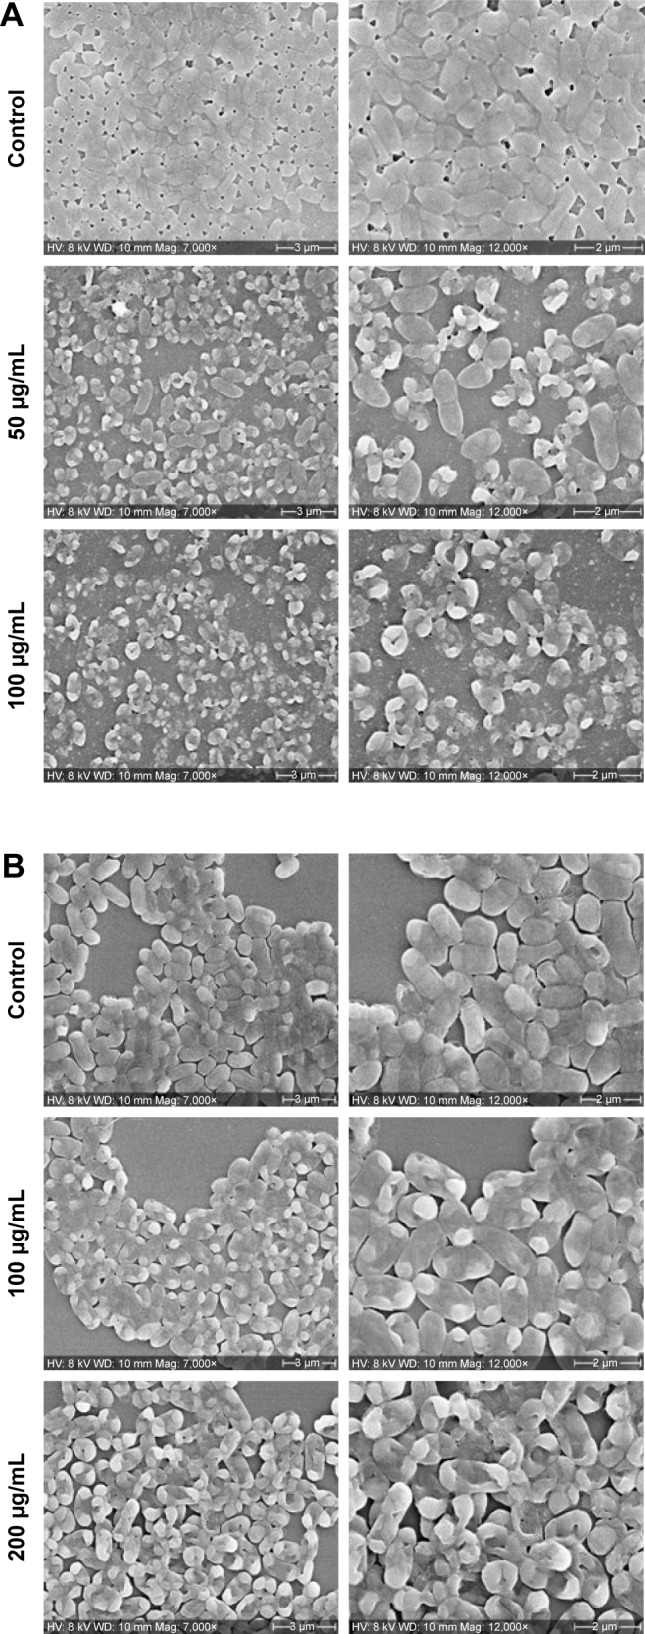
Biofilms were grown for 24 h without any disturbance.
Notes: (A) Pseudomonas aeruginosa; (B) Escherichia coli. After 24 h, old culture medium was replaced with different concentrations of C-AgNPs containing fresh medium and incubated for another 24 h. After 24 h of nanoparticles treatment, biofilms were fixed with glutaraldehyde and dehydrated with graded ethanol, and imaging was performed by using SEM after gold coating.
Abbreviations: C-AgNPs, core–silver nanoparticles; SEM, scanning electron microscopy.
Conclusion
This study demonstrated the applicability of C. sativa extracts for rapid and economical green synthesis of nanoparticles, some of which can be effectively used against biofilm formations. The developed methodology allowed to produce several types of nanoparticles: F-AuNPs, at 1:1 ratio of plant extract:water, 100°C, 4 mM gold salt in 3 min; C-AuNPs, at 1:1 ratio of plant extract:water, 90°C, 2 mM salt in 2.5 min; C-AgNPs, with complete extract, 90°C, 5 mM silver salt in 8 min. C-AgNPs were applied for effective inhibition and disruption of P. aeruginosa and E. coli biofilms. The question generating nanoparticles that would possess the desired morphology with well-defined size and shape is still open, and further study is required to develop a technology in which nanoparticles of specific size and shape can be obtained by the use of medicinal and industrially important C. sativa plants.
Supplementary material
Nanoparticles stability in LB broth and TSB measured during a 2-week interval.
Abbreviations: Abs, absorbance; C-AuNPs, core–gold nanoparticles; F-AgNPs, fiber-silver nanoparticles; F-AuNPs, fiber–gold nanoparticles; LB, Luria-Bertani; TSB, tryptic soya broth.
Acknowledgments
We acknowledge the financial support from the HC Ørsted fellowship, co-funded by Marie Skłodowska Curie, to PS, the Danish Agency for Institutions and Educational Grants, to JG, and from the Novo Nordisk Foundation and Vinnova to IM. Mass spectrometry analysis was performed at the DTU Proteomics Platform, Technical University of Denmark.
Footnotes
Disclosure
The authors report no conflicts of interest in this work.
References
- 1.Singh P, Kim YJ, Zhang D, Yang DC. Biological synthesis of nano-particles from plants and microorganisms. Trends Biotechnol. 2016;34(7):588–599. doi: 10.1016/j.tibtech.2016.02.006. [DOI] [PubMed] [Google Scholar]
- 2.Castro-Aceituno V, Ahn S, Simu SY, et al. Anticancer activity of silver nanoparticles from Panax ginseng fresh leaves in human cancer cells. Biomed Pharmacother. 2016;84:158–165. doi: 10.1016/j.biopha.2016.09.016. [DOI] [PubMed] [Google Scholar]
- 3.Wang C, Mathiyalagan R, Kim YJ, et al. Rapid green synthesis of silver and gold nanoparticles using Dendropanax morbifera leaf extract and their anticancer activities. Int J Nanomedicine. 2016;11:3691–3701. doi: 10.2147/IJN.S97181. [DOI] [PMC free article] [PubMed] [Google Scholar]
- 4.Soltani Nejad M, Bonjar GHS, Khatami M, Amini A, Aghighi S. In vitro and in vivo antifungal properties of silver nanoparticles against Rhizoctonia solani, a common agent of rice sheath blight disease. IET Nanobiotechnol. 2017;11(3):236–240. doi: 10.1049/iet-nbt.2015.0121. [DOI] [PMC free article] [PubMed] [Google Scholar]
- 5.Oh KH, Soshnikova V, Markus J, et al. Biosynthesized gold and silver nanoparticles by aqueous fruit extract of Chaenomeles sinensis and screening of their biomedical activities. Artif Cells Nanomed Biotechnol. 2017;46(3):599–606. doi: 10.1080/21691401.2017.1332636. [DOI] [PubMed] [Google Scholar]
- 6.Shanmugasundaram T, Radhakrishnan M, Gopikrishnan V, Kadirvelu K, Balagurunathan R. Biocompatible silver, gold and silver/gold alloy nanoparticles for enhanced cancer therapy: in vitro and in vivo perspectives. Nanoscale. 2017;9(43):16773–16790. doi: 10.1039/c7nr04979j. [DOI] [PubMed] [Google Scholar]
- 7.Ahn S, Singh P, Jang M, et al. Gold nanoflowers synthesized using acanthopanacis cortex extract inhibit inflammatory mediators in LPS-induced RAW264.7 macrophages via NF-kappaB and AP-1 pathways. Colloids Surf B Biointerfaces. 2017;160:423–428. doi: 10.1016/j.colsurfb.2017.09.053. [DOI] [PubMed] [Google Scholar]
- 8.Ahn S, Singh P, Castro-Aceituno V, et al. Gold nanoparticles synthesized using Panax ginseng leaves suppress inflammatory – mediators production via blockade of NF-kappaB activation in macrophages. Artif Cells Nanomed Biotechnol. 2017;45(2):270–276. doi: 10.1080/21691401.2016.1228661. [DOI] [PubMed] [Google Scholar]
- 9.Singh H, Du J, Singh P, Yi TH. Ecofriendly synthesis of silver and gold nanoparticles by Euphrasia officinalis leaf extract and its biomedical applications. Artif Cells Nanomed Biotechnol. 2017 Aug 8; doi: 10.1080/21691401.2017.1362417. Epub. [DOI] [PubMed] [Google Scholar]
- 10.Huo Y, Singh P, Kim YJ, et al. Biological synthesis of gold and silver chloride nanoparticles by Glycyrrhiza uralensis and in vitro applications. Artif Cells Nanomed Biotechnol. 2017;46(2):303–312. doi: 10.1080/21691401.2017.1307213. [DOI] [PubMed] [Google Scholar]
- 11.Huang J, Lin L, Sun D, Chen H, Yang D, Li Q. Bio-inspired synthesis of metal nanomaterials and applications. Chem Soc Rev. 2015;44(17):6330–6374. doi: 10.1039/c5cs00133a. [DOI] [PubMed] [Google Scholar]
- 12.Kasthuri J, Veerapandian S, Rajendiran N. Biological synthesis of silver and gold nanoparticles using apiin as reducing agent. Colloids Surf B Biointerfaces. 2009;68(1):55–60. doi: 10.1016/j.colsurfb.2008.09.021. [DOI] [PubMed] [Google Scholar]
- 13.Pearce DD, Mitsouras K, Irizarry KJ. Discriminating the effects of Cannabis sativa and Cannabis indica: a web survey of medical Cannabis users. J Altern Complement Med. 2014;20(10):787–791. doi: 10.1089/acm.2013.0190. [DOI] [PubMed] [Google Scholar]
- 14.Bar-Sela G, Vorobeichik M, Drawsheh S, Omer A, Goldberg V, Muller E. The medical necessity for medicinal Cannabis: prospective, observational study evaluating the treatment in cancer patients on supportive or palliative care. Evid Based Complement Alternat Med. 2013;2013:510392. doi: 10.1155/2013/510392. [DOI] [PMC free article] [PubMed] [Google Scholar]
- 15.Atakan Z. Cannabis, a complex plant: different compounds and different effects on individuals. Ther Adv Psychopharmacol. 2012;2(6):241–254. doi: 10.1177/2045125312457586. [DOI] [PMC free article] [PubMed] [Google Scholar]
- 16.Kostakioti M, Hadjifrangiskou M, Hultgren SJ. Bacterial biofilms: development, dispersal, and therapeutic strategies in the dawn of the postantibiotic era. Cold Spring Harb Perspect Med. 2013;3(4):a010306. doi: 10.1101/cshperspect.a010306. [DOI] [PMC free article] [PubMed] [Google Scholar]
- 17.Hoiby N, Bjarnsholt T, Givskov M, Molin S, Ciofu O. Antibiotic resistance of bacterial biofilms. Int J Antimicrob Agents. 2010;35(4):322–332. doi: 10.1016/j.ijantimicag.2009.12.011. [DOI] [PubMed] [Google Scholar]
- 18.Singh P, Singh H, Kim YJ, Mathiyalagan R, Wang C, Yang DC. Extracellular synthesis of silver and gold nanoparticles by Sporosarcina koreensis DC4 and their biological applications. Enzyme Microb Technol. 2016;86:75–83. doi: 10.1016/j.enzmictec.2016.02.005. [DOI] [PubMed] [Google Scholar]
- 19.Singh P, Kim YJ, Singh H, Mathiyalagan R, Wang C, Yang DC. Biosynthesis of anisotropic silver nanoparticles by Bhargavaea indica and their synergistic effect with antibiotics against pathogenic microorganisms. J Nanomater. 2015;2015:10. [Google Scholar]
- 20.Singh P, Kim YJ, Singh H, et al. Biosynthesis, characterization, and antimicrobial applications of silver nanoparticles. Int J Nanomedicine. 2015;10:2567–2577. doi: 10.2147/IJN.S72313. [DOI] [PMC free article] [PubMed] [Google Scholar]
- 21.Liu M, Fernando D, Meyer AS, Madsen B, Daniel G, Thygesen A. Characterization and biological depectinization of hemp fibers originating from different stem sections. Ind Crops Prod. 2015;76:880–891. [Google Scholar]
- 22.Thomsen MH, Thygesen A, Thomsen AB. Identification and characterization of fermentation inhibitors formed during hydrothermal treatment and following SSF of wheat straw. Appl Microbiol Biotechnol. 2009;83(3):447–455. doi: 10.1007/s00253-009-1867-1. [DOI] [PubMed] [Google Scholar]
- 23.Singh P, Kim YJ, Yang DC. A strategic approach for rapid synthesis of gold and silver nanoparticles by Panax ginseng leaves. Artif Cells Nanomed Biotechnol. 2016;44(8):1949–1957. doi: 10.3109/21691401.2015.1115410. [DOI] [PubMed] [Google Scholar]
- 24.Sekula J, Niziol J, Rode W, Ruman T. Silver nanostructures in laser desorption/ionization mass spectrometry and mass spectrometry imaging. Analyst. 2015;140(18):6195–6209. doi: 10.1039/c5an00943j. [DOI] [PubMed] [Google Scholar]
- 25.Pace HE, Rogers NJ, Jarolimek C, Coleman VA, Higgins CP, Ranville JF. Determining transport efficiency for the purpose of counting and sizing nanoparticles via single particle inductively coupled plasma mass spectrometry. Anal Chem. 2011;83(24):9361–9369. doi: 10.1021/ac201952t. [DOI] [PMC free article] [PubMed] [Google Scholar]
- 26.Pandit S, Chang KW, Jeon JG. Effects of Withania somnifera on the growth and virulence properties of Streptococcus mutans and Streptococcus sobrinus at sub-MIC levels. Anaerobe. 2013;19:1–8. doi: 10.1016/j.anaerobe.2012.10.007. [DOI] [PubMed] [Google Scholar]
- 27.Helgadottir S, Pandit S, Mokkapati VR, Westerlund F, Apell P, Mijakovic I. Vitamin C pretreatment enhances the antibacterial effect of cold atmospheric plasma. Front Cell Infect Microbiol. 2017;7:43. doi: 10.3389/fcimb.2017.00043. [DOI] [PMC free article] [PubMed] [Google Scholar]
- 28.Pandit S, Kim JE, Jung KH, Chang KW, Jeon JG. Effect of sodium fluoride on the virulence factors and composition of Streptococcus mutans biofilms. Arch Oral Biol. 2011;56(7):643–649. doi: 10.1016/j.archoralbio.2010.12.012. [DOI] [PubMed] [Google Scholar]
- 29.Amendola V, Pilot R, Frasconi M, Marago OM, Iati MA. Surface plasmon resonance in gold nanoparticles: a review. J Phys Condens Matter. 2017;29(20):203002. doi: 10.1088/1361-648X/aa60f3. [DOI] [PubMed] [Google Scholar]
- 30.Singh P, Kim YJ, Wang C, Mathiyalagan R, El-Agamy Farh M, Yang DC. Biogenic silver and gold nanoparticles synthesized using red ginseng root extract, and their applications. Artif Cells Nanomed Biotechnol. 2016;44(3):811–816. doi: 10.3109/21691401.2015.1008514. [DOI] [PubMed] [Google Scholar]
- 31.Singh P, Kim YJ, Wang C, Mathiyalagan R, Yang DC. The development of a green approach for the biosynthesis of silver and gold nanoparticles by using Panax ginseng root extract, and their biological applications. Artif Cells Nanomed Biotechnol. 2016;44(4):1150–1157. doi: 10.3109/21691401.2015.1011809. [DOI] [PubMed] [Google Scholar]
- 32.Abbai R, Mathiyalagan R, Markus J, et al. Green synthesis of multifunctional silver and gold nanoparticles from the oriental herbal adaptogen: Siberian ginseng. Int J Nanomedicine. 2016;11:3131–3143. doi: 10.2147/IJN.S108549. [DOI] [PMC free article] [PubMed] [Google Scholar]
- 33.Mortazavi SM, Khatami M, Sharifi I, et al. Bacterial biosynthesis of gold nanoparticles using Salmonella enterica subsp. enterica serovar Typhi isolated from blood and stool specimens of patients. J Cluster Sci. 2017;28(5):2997–3007. [Google Scholar]
- 34.Khatami M, Amini E, Amini A, Mortazavi SM, Kishani Farahani Z, Heli H. Biosynthesis of silver nanoparticles using pine pollen and evaluation of the antifungal efficiency. Iran J Biotechnol. 2017;15(2):95–101. doi: 10.15171/ijb.1436. [DOI] [PMC free article] [PubMed] [Google Scholar]
- 35.Singh H, Du J, Yi TH. Green and rapid synthesis of silver nanoparticles using Borago officinalis leaf extract: anticancer and antibacterial activities. Artif Cells Nanomed Biotechnol. 2017;45(7):1310–1316. doi: 10.1080/21691401.2016.1228663. [DOI] [PubMed] [Google Scholar]
- 36.Singh P, Ahn S, Kang JP, et al. In vitro anti-inflammatory activity of spherical silver nanoparticles and monodisperse hexagonal gold nanoparticles by fruit extract of Prunus serrulata: a green synthetic approach. Artif Cells Nanomed Biotechnol. 2018 Nov 30; doi: 10.1080/21691401.2017.1408117. Epub. [DOI] [PubMed] [Google Scholar]
- 37.Du J, Singh H, Yi TH. Antibacterial, anti-biofilm and anticancer potentials of green synthesized silver nanoparticles using benzoin gum (Styrax benzoin) extract. Bioprocess Biosyst Eng. 2016;39(12):1923–1931. doi: 10.1007/s00449-016-1666-x. [DOI] [PubMed] [Google Scholar]
- 38.Makarov VV, Love AJ, Sinitsyna OV, et al. “Green” nanotechnologies: synthesis of metal nanoparticles using plants. Acta Naturae. 2014;6(1):35–44. [PMC free article] [PubMed] [Google Scholar]
- 39.Geetha Bai R, Muthoosamy K, Shipton FN, et al. The biogenic synthesis of a reduced graphene oxide-silver (RGO-Ag) nanocomposite and its dual applications as an antibacterial agent and cancer biomarker sensor. RSC Adv. 2016;6(43):36576–36587. [Google Scholar]
- 40.Yang X, Gan L, Zhu C, et al. A dramatic platform for oxygen reduction reaction based on silver nanoclusters. Chem Commun (Camb) 2014;50(2):234–236. doi: 10.1039/c3cc47712f. [DOI] [PubMed] [Google Scholar]
- 41.Nel AE, Madler L, Velegol D, et al. Understanding biophysicochemical interactions at the nano-bio interface. Nat Mater. 2009;8(7):543–557. doi: 10.1038/nmat2442. [DOI] [PubMed] [Google Scholar]
- 42.Navya PN, Daima HK. Rational engineering of physicochemical properties of nanomaterials for biomedical applications with nanotoxicological perspectives. Nano Converg. 2016;3:1. doi: 10.1186/s40580-016-0064-z. [DOI] [PMC free article] [PubMed] [Google Scholar]
- 43.Nour El Din S, El-Tayeb TA, Abou-Aisha K, El-Azizi M. In vitro and in vivo antimicrobial activity of combined therapy of silver nanoparticles and visible blue light against Pseudomonas aeruginosa. Int J Nanomedicine. 2016;11:1749–1758. doi: 10.2147/IJN.S102398. [DOI] [PMC free article] [PubMed] [Google Scholar]
- 44.Singh P, Kim YJ, Wang C, Mathiyalagan R, Yang DC. Weissella oryzae DC6-facilitated green synthesis of silver nanoparticles and their antimicrobial potential. Artif Cells Nanomed Biotechnol. 2016;44(6):1569–1575. doi: 10.3109/21691401.2015.1064937. [DOI] [PubMed] [Google Scholar]
- 45.El Zowalaty ME, Hussein Al Ali SH, Husseiny MI, Geilich BM, Webster TJ, Hussein MZ. The ability of streptomycin-loaded chitosan-coated magnetic nanocomposites to possess antimicrobial and antituberculosis activities. Int J Nanomedicine. 2015;10:3269–3274. doi: 10.2147/IJN.S74469. [DOI] [PMC free article] [PubMed] [Google Scholar]
- 46.Feng QL, Wu J, Chen GQ, Cui FZ, Kim TN, Kim JO. A mechanistic study of the antibacterial effect of silver ions on Escherichia coli and Staphylococcus aureus. J Biomed Mater Res. 2000;52(4):662–668. doi: 10.1002/1097-4636(20001215)52:4<662::aid-jbm10>3.0.co;2-3. [DOI] [PubMed] [Google Scholar]
- 47.Pal S, Tak YK, Song JM. Does the antibacterial activity of silver nanoparticles depend on the shape of the nanoparticle? A study of the Gram-negative bacterium Escherichia coli. Appl Environ Microbiol. 2007;73(6):1712–1720. doi: 10.1128/AEM.02218-06. [DOI] [PMC free article] [PubMed] [Google Scholar]
- 48.Chudasama B, Vala AK, Andhariya N, Mehta RV, Upadhyay RV. Highly bacterial resistant silver nanoparticles: synthesis and antibacterial activities. J Nanopart Res. 2010;12(5):1677–1685. [Google Scholar]
- 49.Marambio-Jones C, Hoek EMV. A review of the antibacterial effects of silver nanomaterials and potential implications for human health and the environment. J Nanopart Res. 2010;12(5):1531–1551. [Google Scholar]
Associated Data
This section collects any data citations, data availability statements, or supplementary materials included in this article.
Supplementary Materials
Nanoparticles stability in LB broth and TSB measured during a 2-week interval.
Abbreviations: Abs, absorbance; C-AuNPs, core–gold nanoparticles; F-AgNPs, fiber-silver nanoparticles; F-AuNPs, fiber–gold nanoparticles; LB, Luria-Bertani; TSB, tryptic soya broth.


