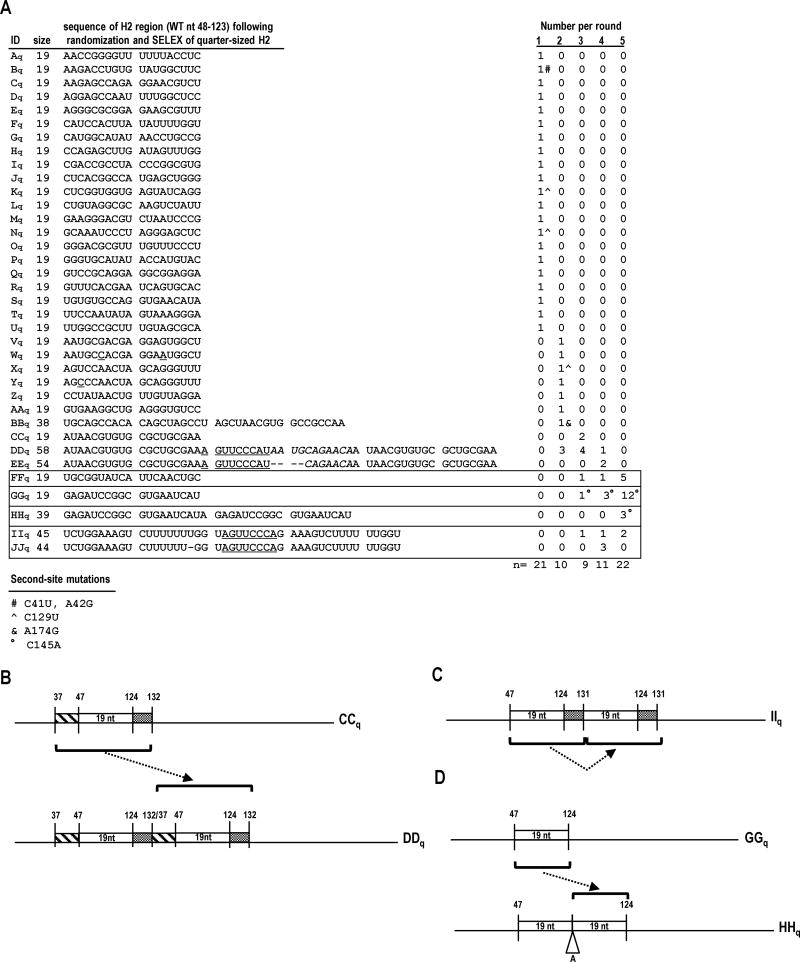
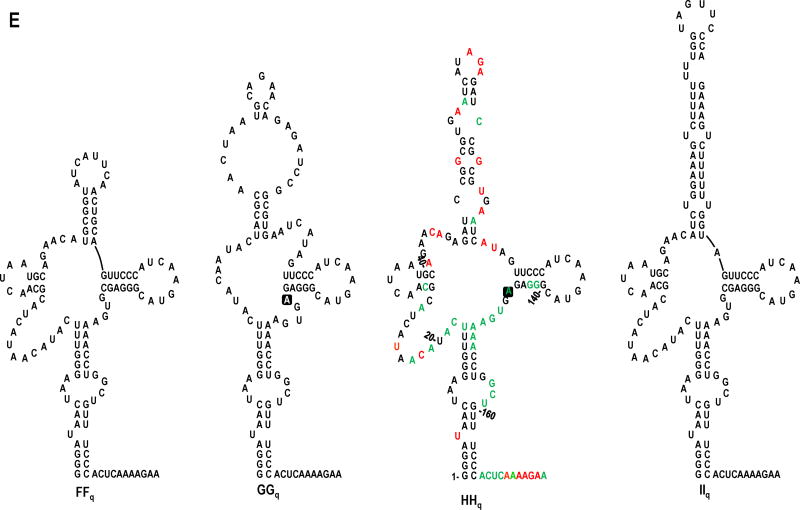
FIG. 5.
In vivo SELEX of satC19. (A) Results of five rounds of passaging satC with 19 random bases replacing H2 (satC19). Sequences related to the four distinct “winning” satCs (samples FFq, GGq, HHq, and IIq) are boxed. Underlined nt denote differences between related satC clones. Second-site mutations are identified by symbols and defined at the bottom of the figure. (B-D) Models for sequence expansion in DDq, IIq, and HHq. (E) Secondary structure models for the 5′ region of SELEX winners FFq, GGq, HHq and IIq. Results of SHAPE structure probing are shown on the model of HHq (see Fig. 1B for nucleotide coloring). Boxed nucleotides in GGq and HHq denote second-site mutations.


